How to Invest in International Shares From Australia
1 hr ago
A company reports record profits. The stock drops 8% the next morning. Financial headlines call it a “disappointing quarter.” For anyone watching from the outside, the reaction looks irrational, as if the market misread its own numbers.
With Q1 2026 earnings season currently underway (approximately 63% of S&P 500 companies had reported as of 1 May 2026, with the season expected to conclude by late May), this is the exact window where retail investors encounter price moves that appear to defy the underlying results. The confusion is understandable, but it is not random. Stock prices do not respond to earnings the way most people assume. This article explains what the market is actually responding to when quarterly results land, why post-earnings reactions often appear backwards, and how understanding the expectations framework changes the way every future earnings report reads.
Earnings season is the roughly six-week reporting window that follows each calendar quarter’s close, occurring four times per year. Public companies listed on U.S. exchanges are required to release quarterly financial results under SEC and FINRA disclosure rules. This is not optional corporate communication; it is a regulatory obligation that produces a concentrated, market-wide event.
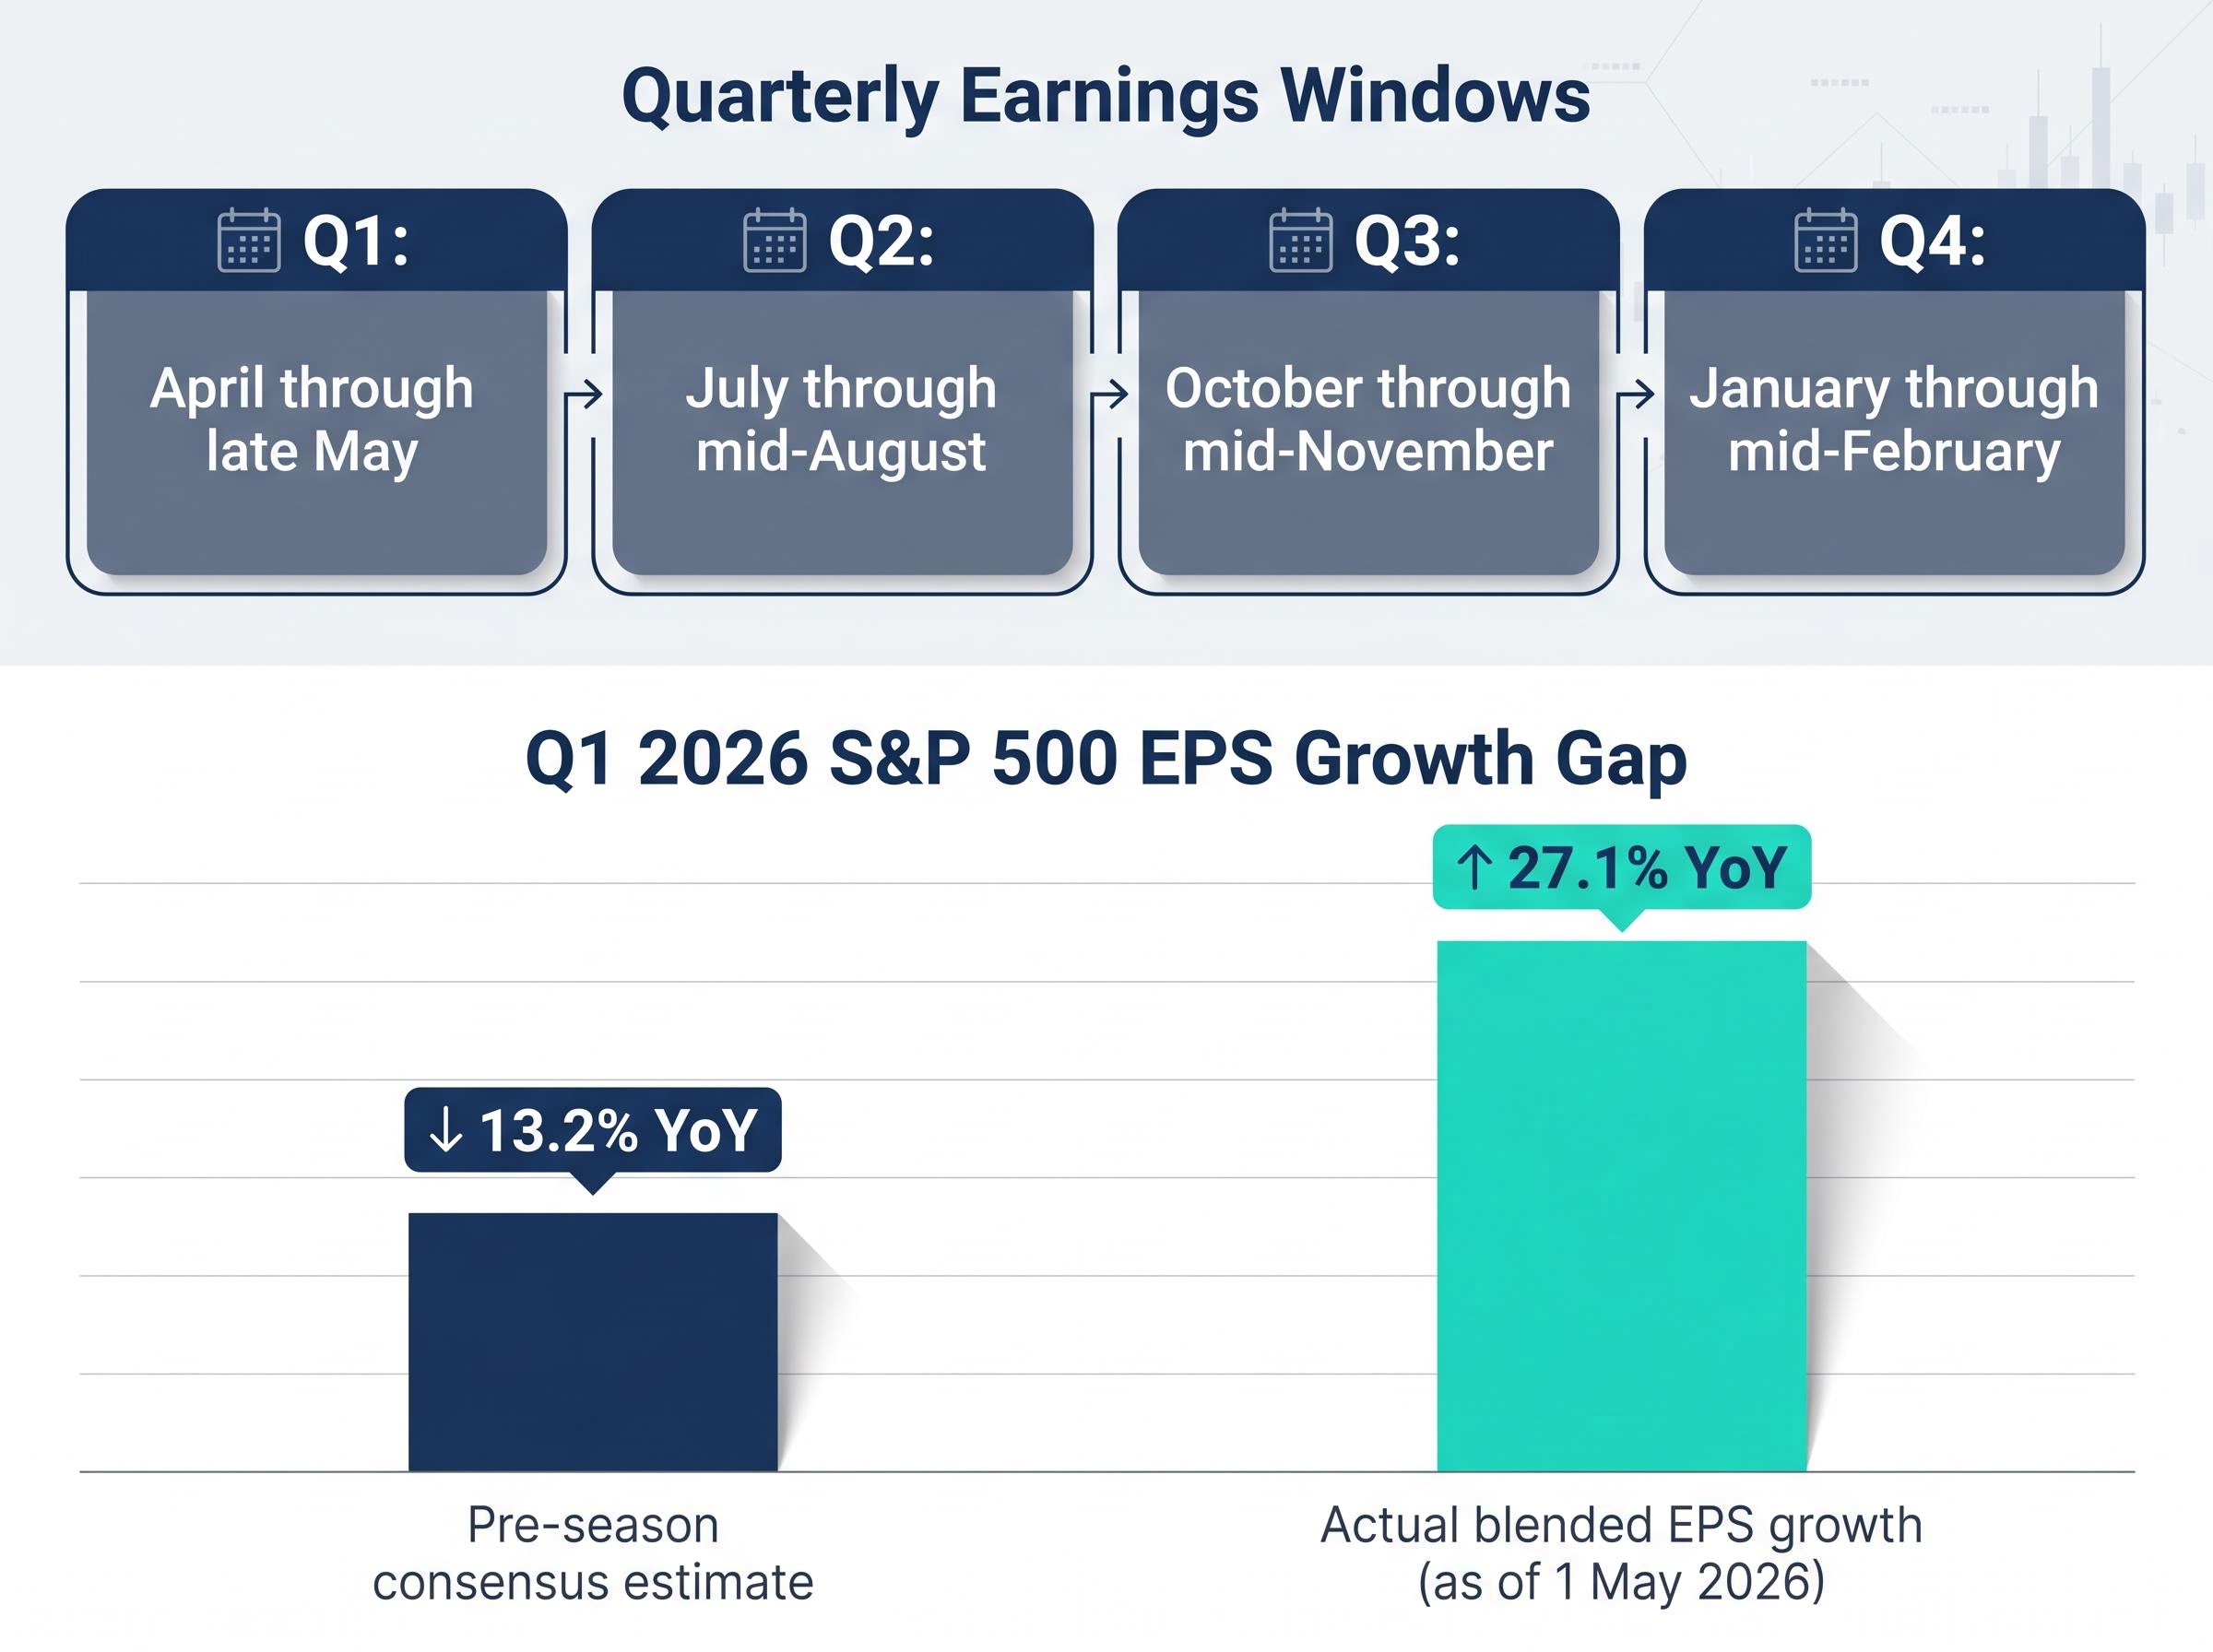
The four annual windows follow a consistent pattern:
A single earnings report can move a stock that has traded sideways for months by 5%, 10%, or more in either direction within hours. When large-cap companies report, the effects can ripple across entire sectors and, in some cases, shift the broader index.
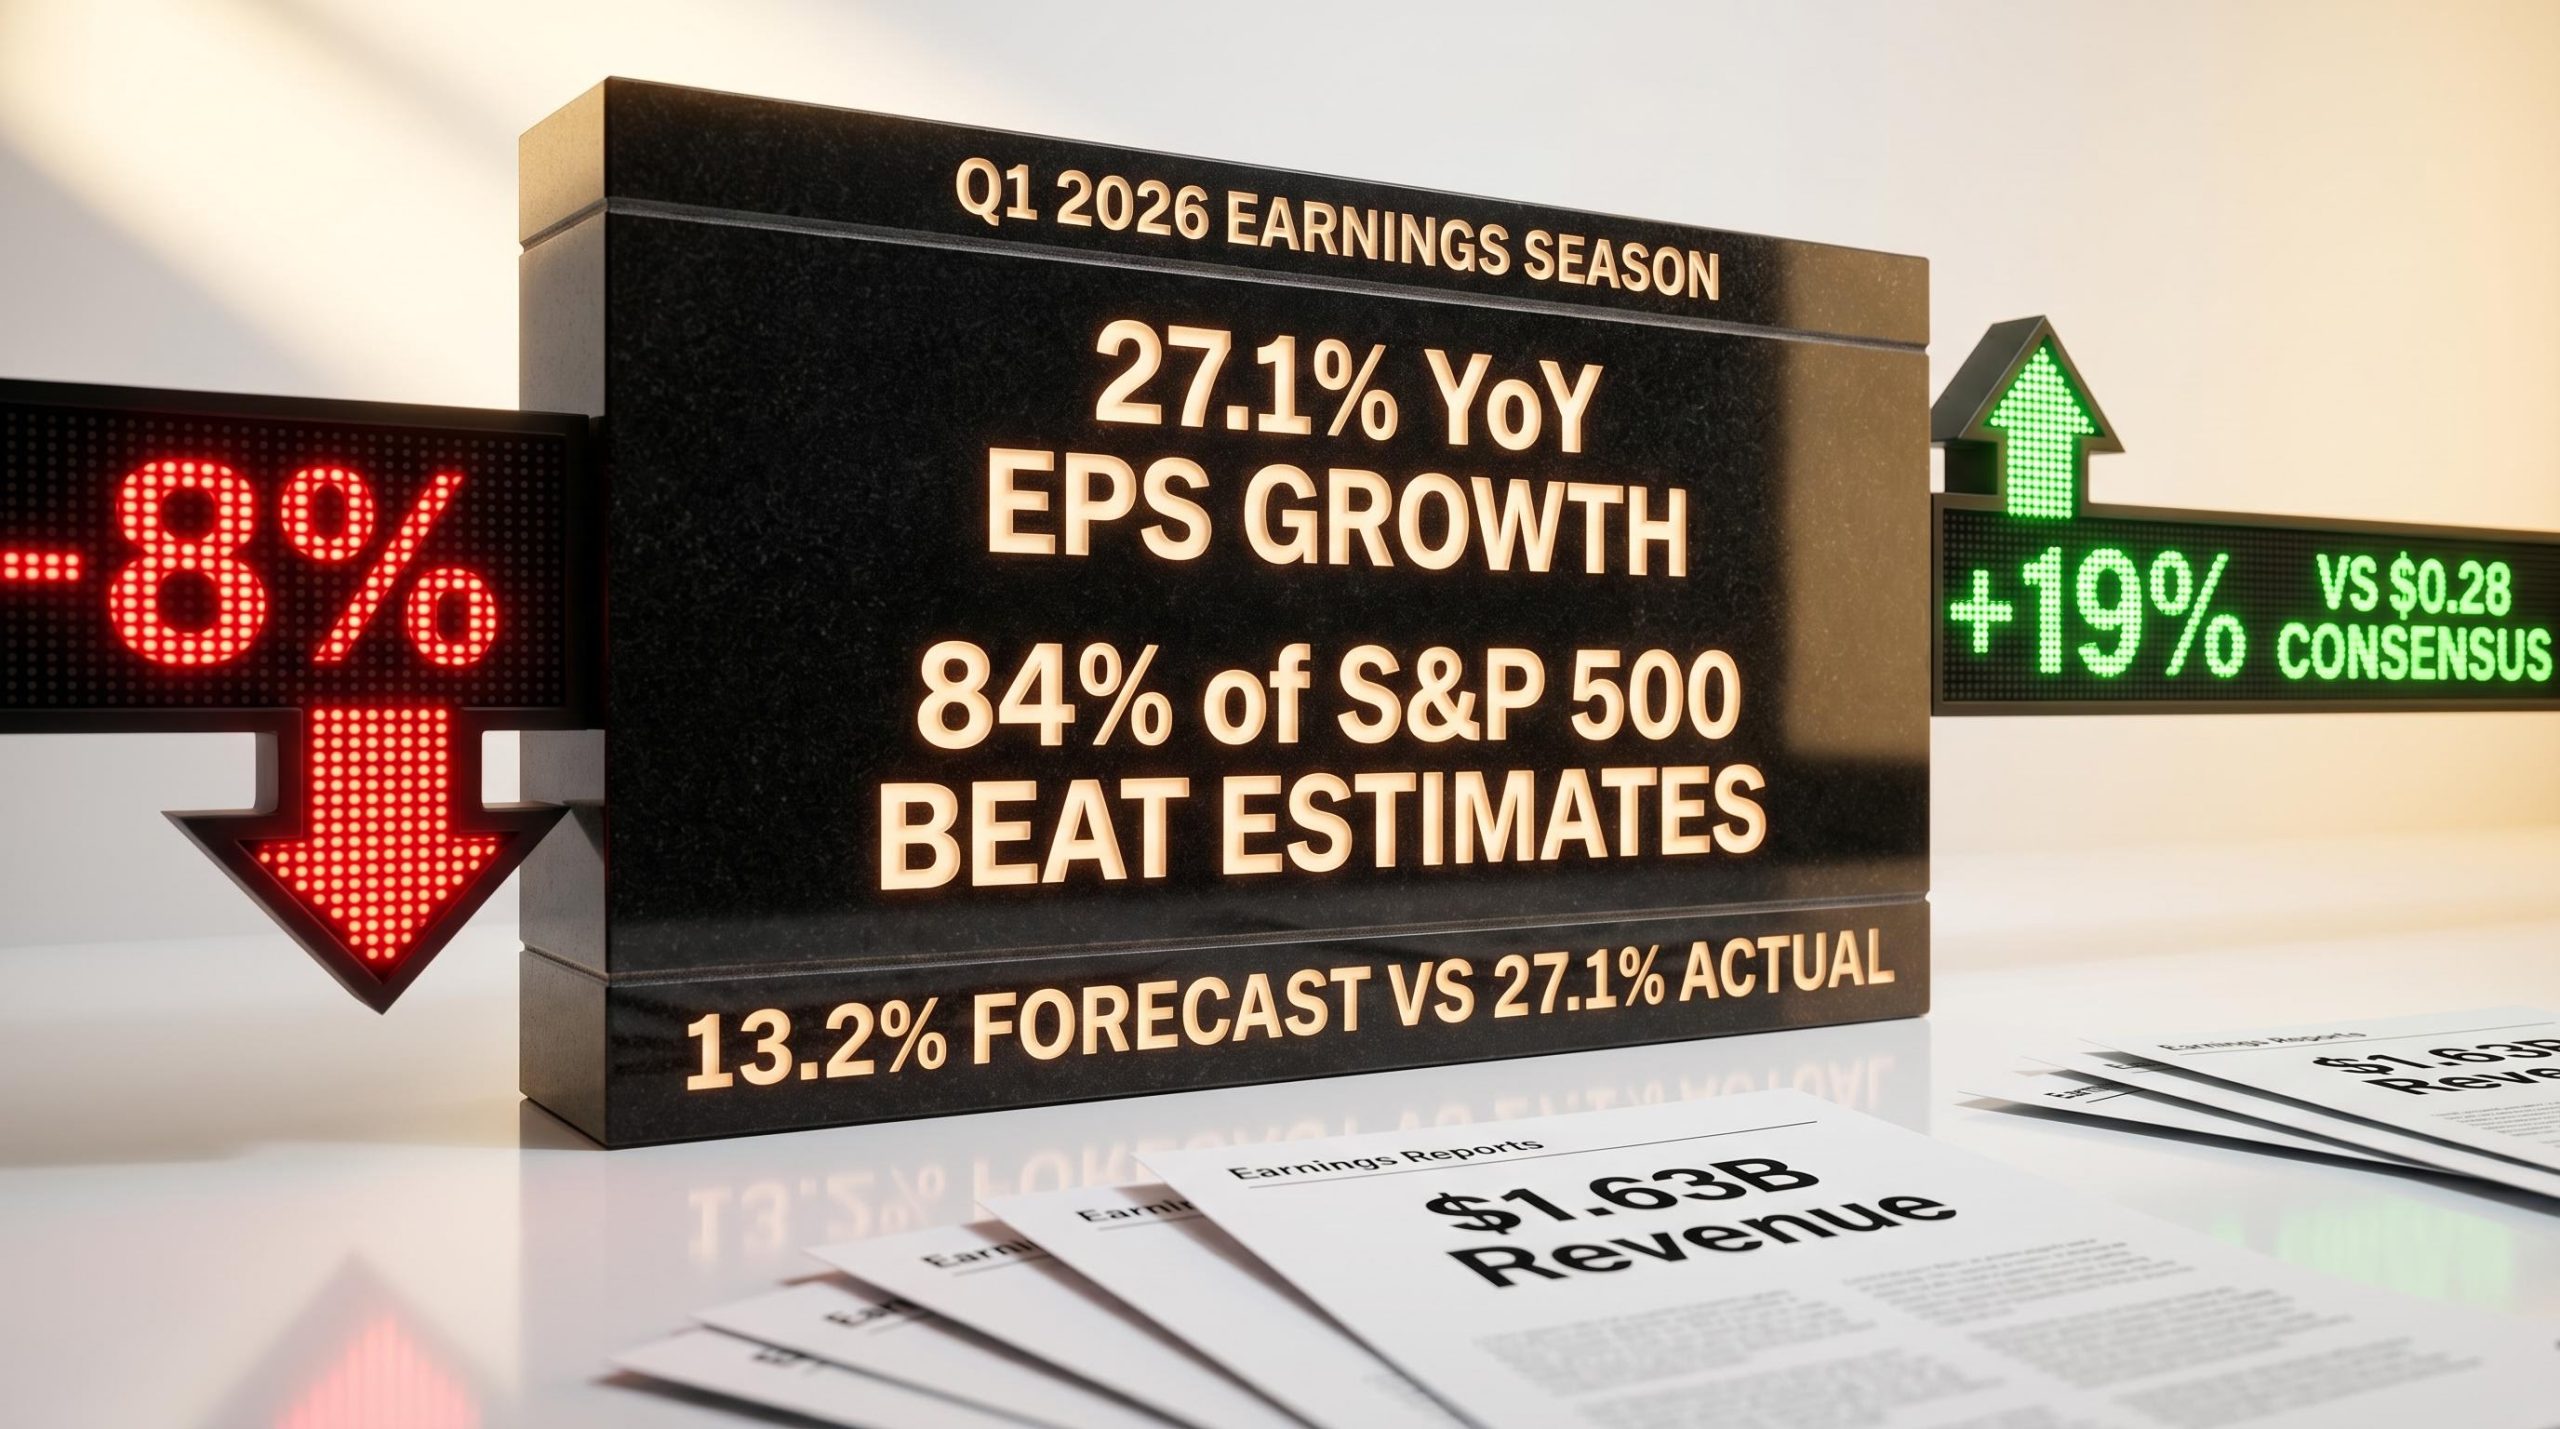
The scale of the gap between forecasts and reality is what makes these windows so consequential. Before Q1 2026 reporting began, analyst consensus estimated approximately 13.2% year-over-year earnings growth for the S&P 500. The actual blended figure as of 1 May 2026 told a different story.
Pre-season consensus estimate: approximately 13.2% YoY EPS growth. Actual blended EPS growth (as of 1 May 2026): 27.1% YoY, more than double the forecast.
That gap between forecast and reality is not unusual. It is the dynamic that defines earnings season and the one that makes the counterintuitive stock reactions so costly when misread.
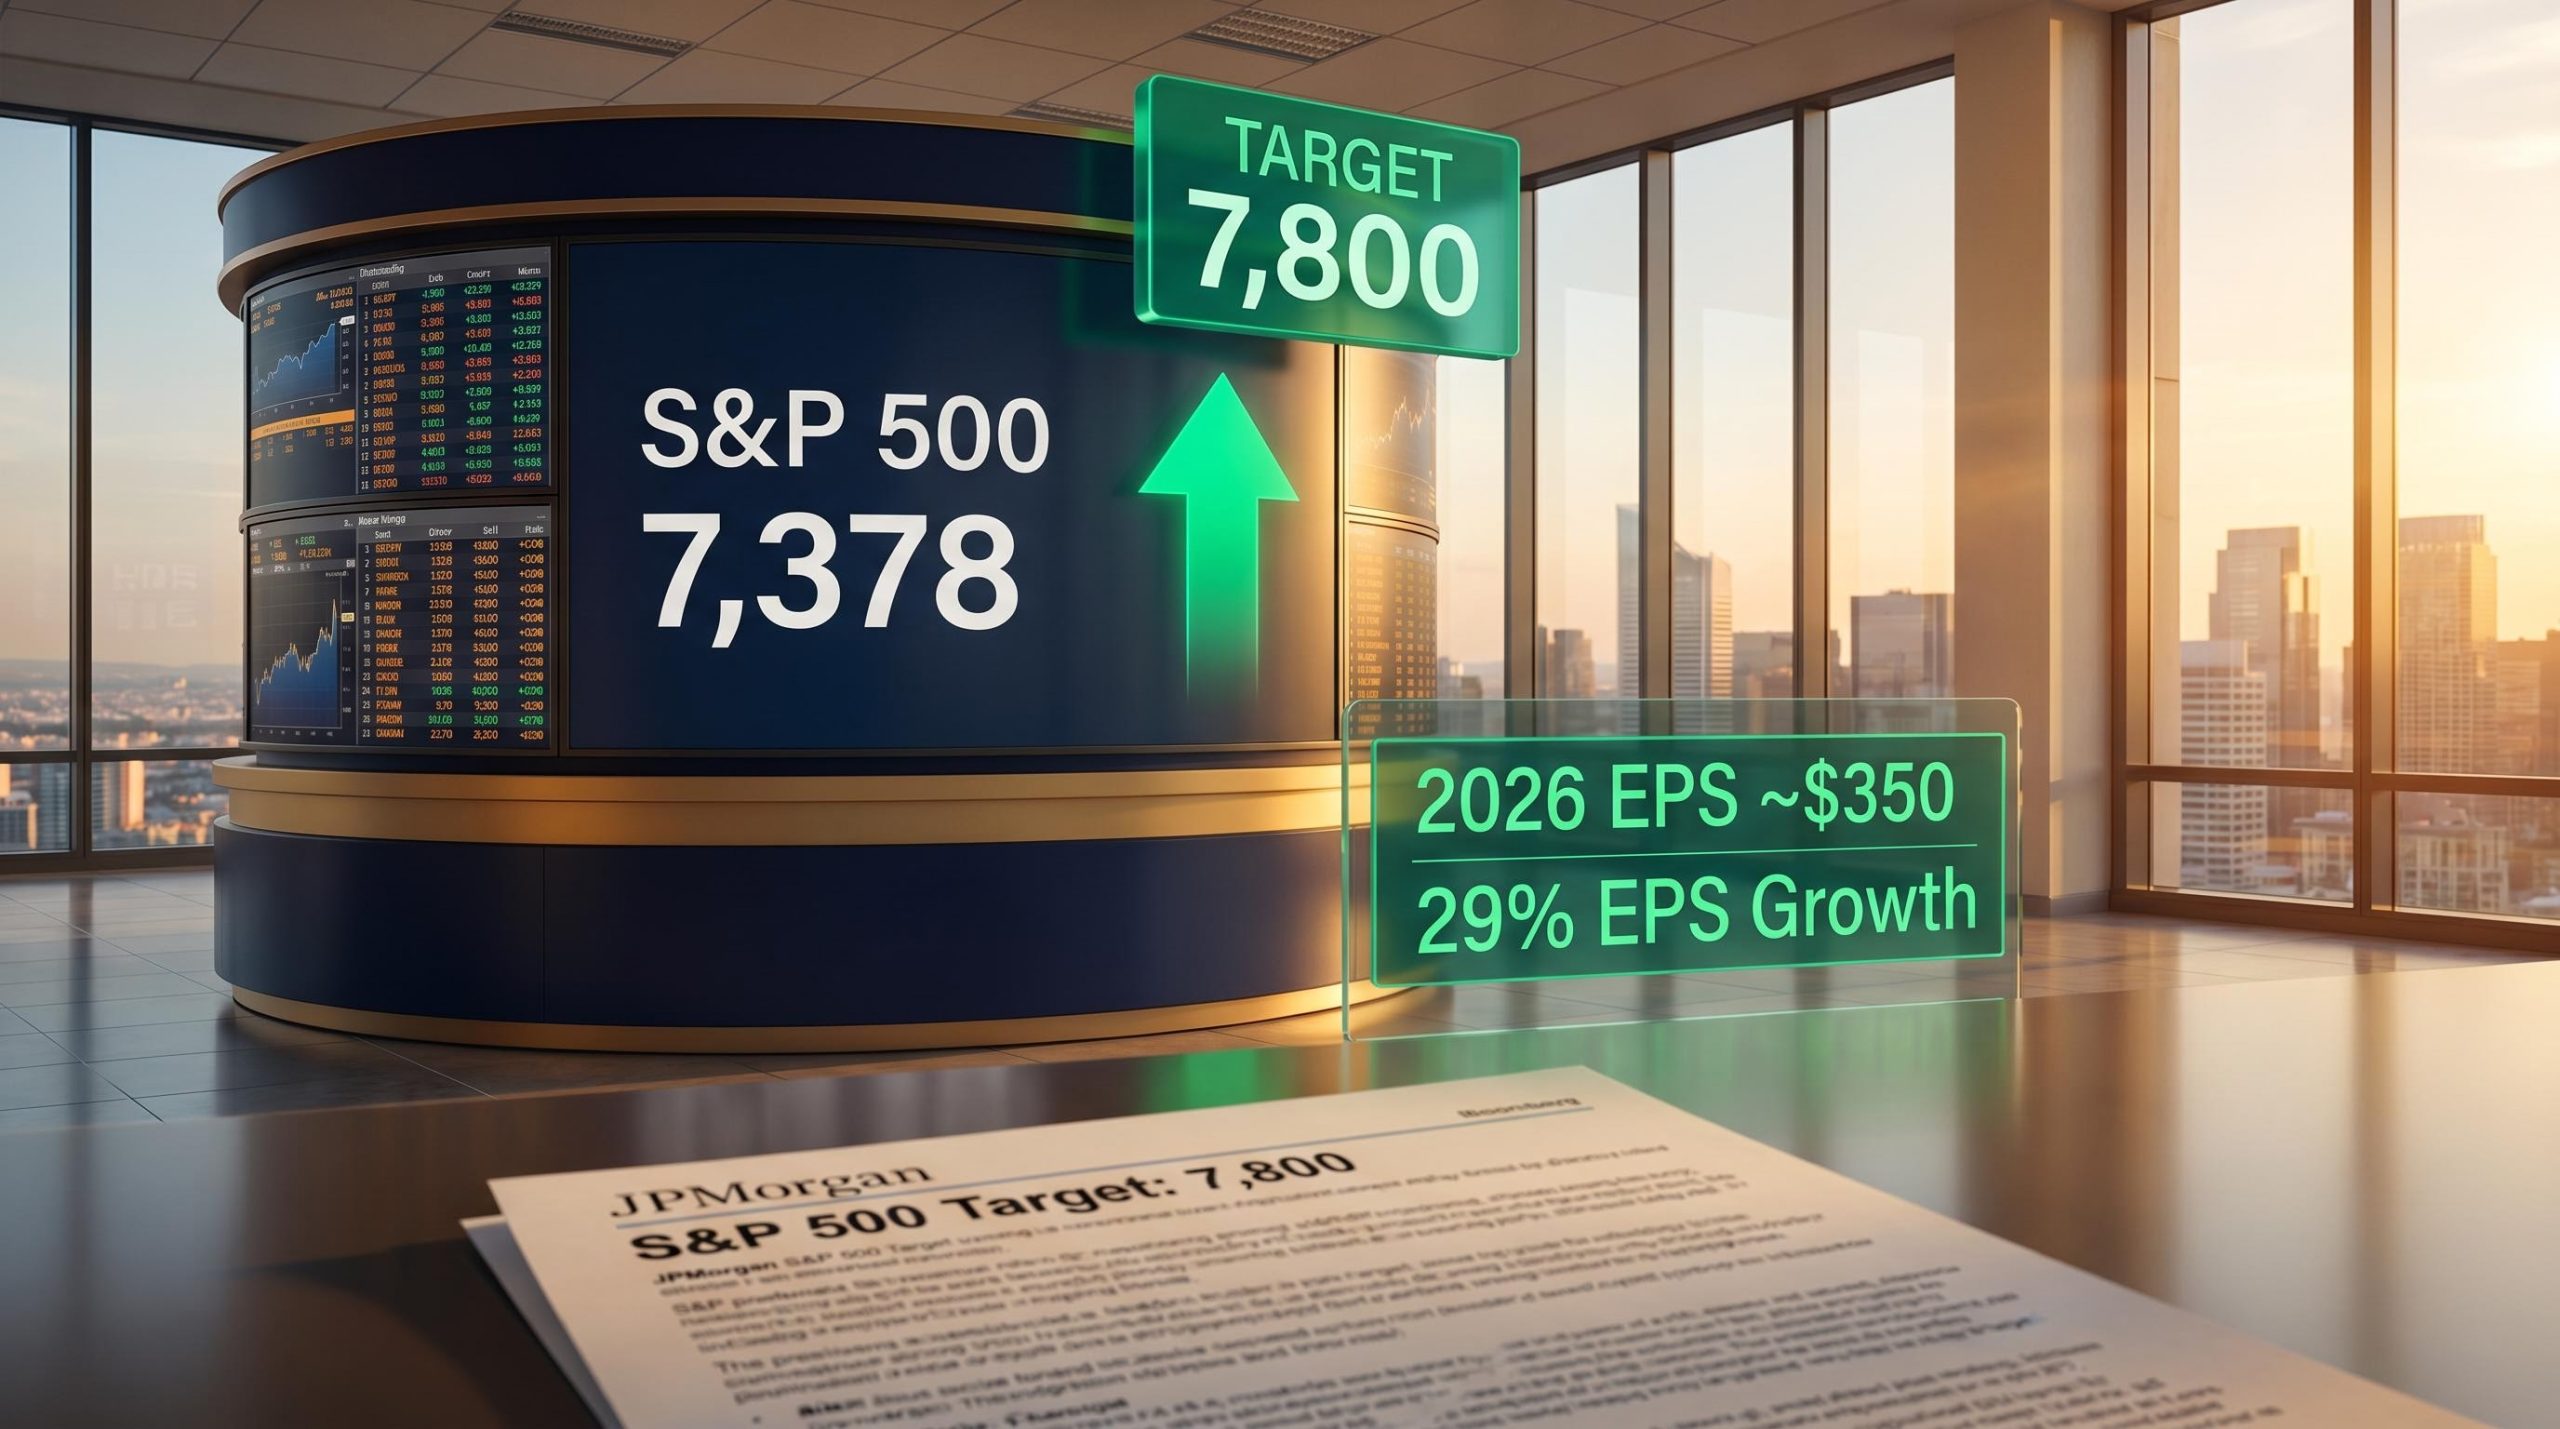
Consider what a stock price represents at any given moment. It is not a scorecard of past performance. It is the market’s collective forecast of future cash flows, discounted to the present. Every analyst estimate, every institutional positioning decision, and every options contract placed ahead of a report contributes to a price that already reflects what the market expects the company to deliver.
This is the concept J.P. Morgan Asset Management describes as “priced in”: by the time results are published, the market’s anticipated outcome is already embedded in the share price. The report itself does not land on a blank slate. It lands on a pre-existing expectation.
Implied volatility signals embedded in options pricing offer a precise, quantitative measure of what the market is pricing in ahead of a report; the cost of a front-month straddle on a mega-cap stock, for example, mathematically encodes the market’s expected move range before a single headline lands.
The implication is direct. A report’s impact on a stock is determined not by whether results are good or bad in absolute terms, but by whether they are better or worse than what was already priced in. A company that beats estimates by a small margin may see no move at all, because that small beat was exactly what the market anticipated.
The Q1 2026 data illustrates why this matters. As of 1 May 2026, 84% of S&P 500 companies had beaten EPS estimates. That figure sits well above the 10-year average of 76%. Beating estimates is the norm, not the exception, and the market has learned to anticipate it.
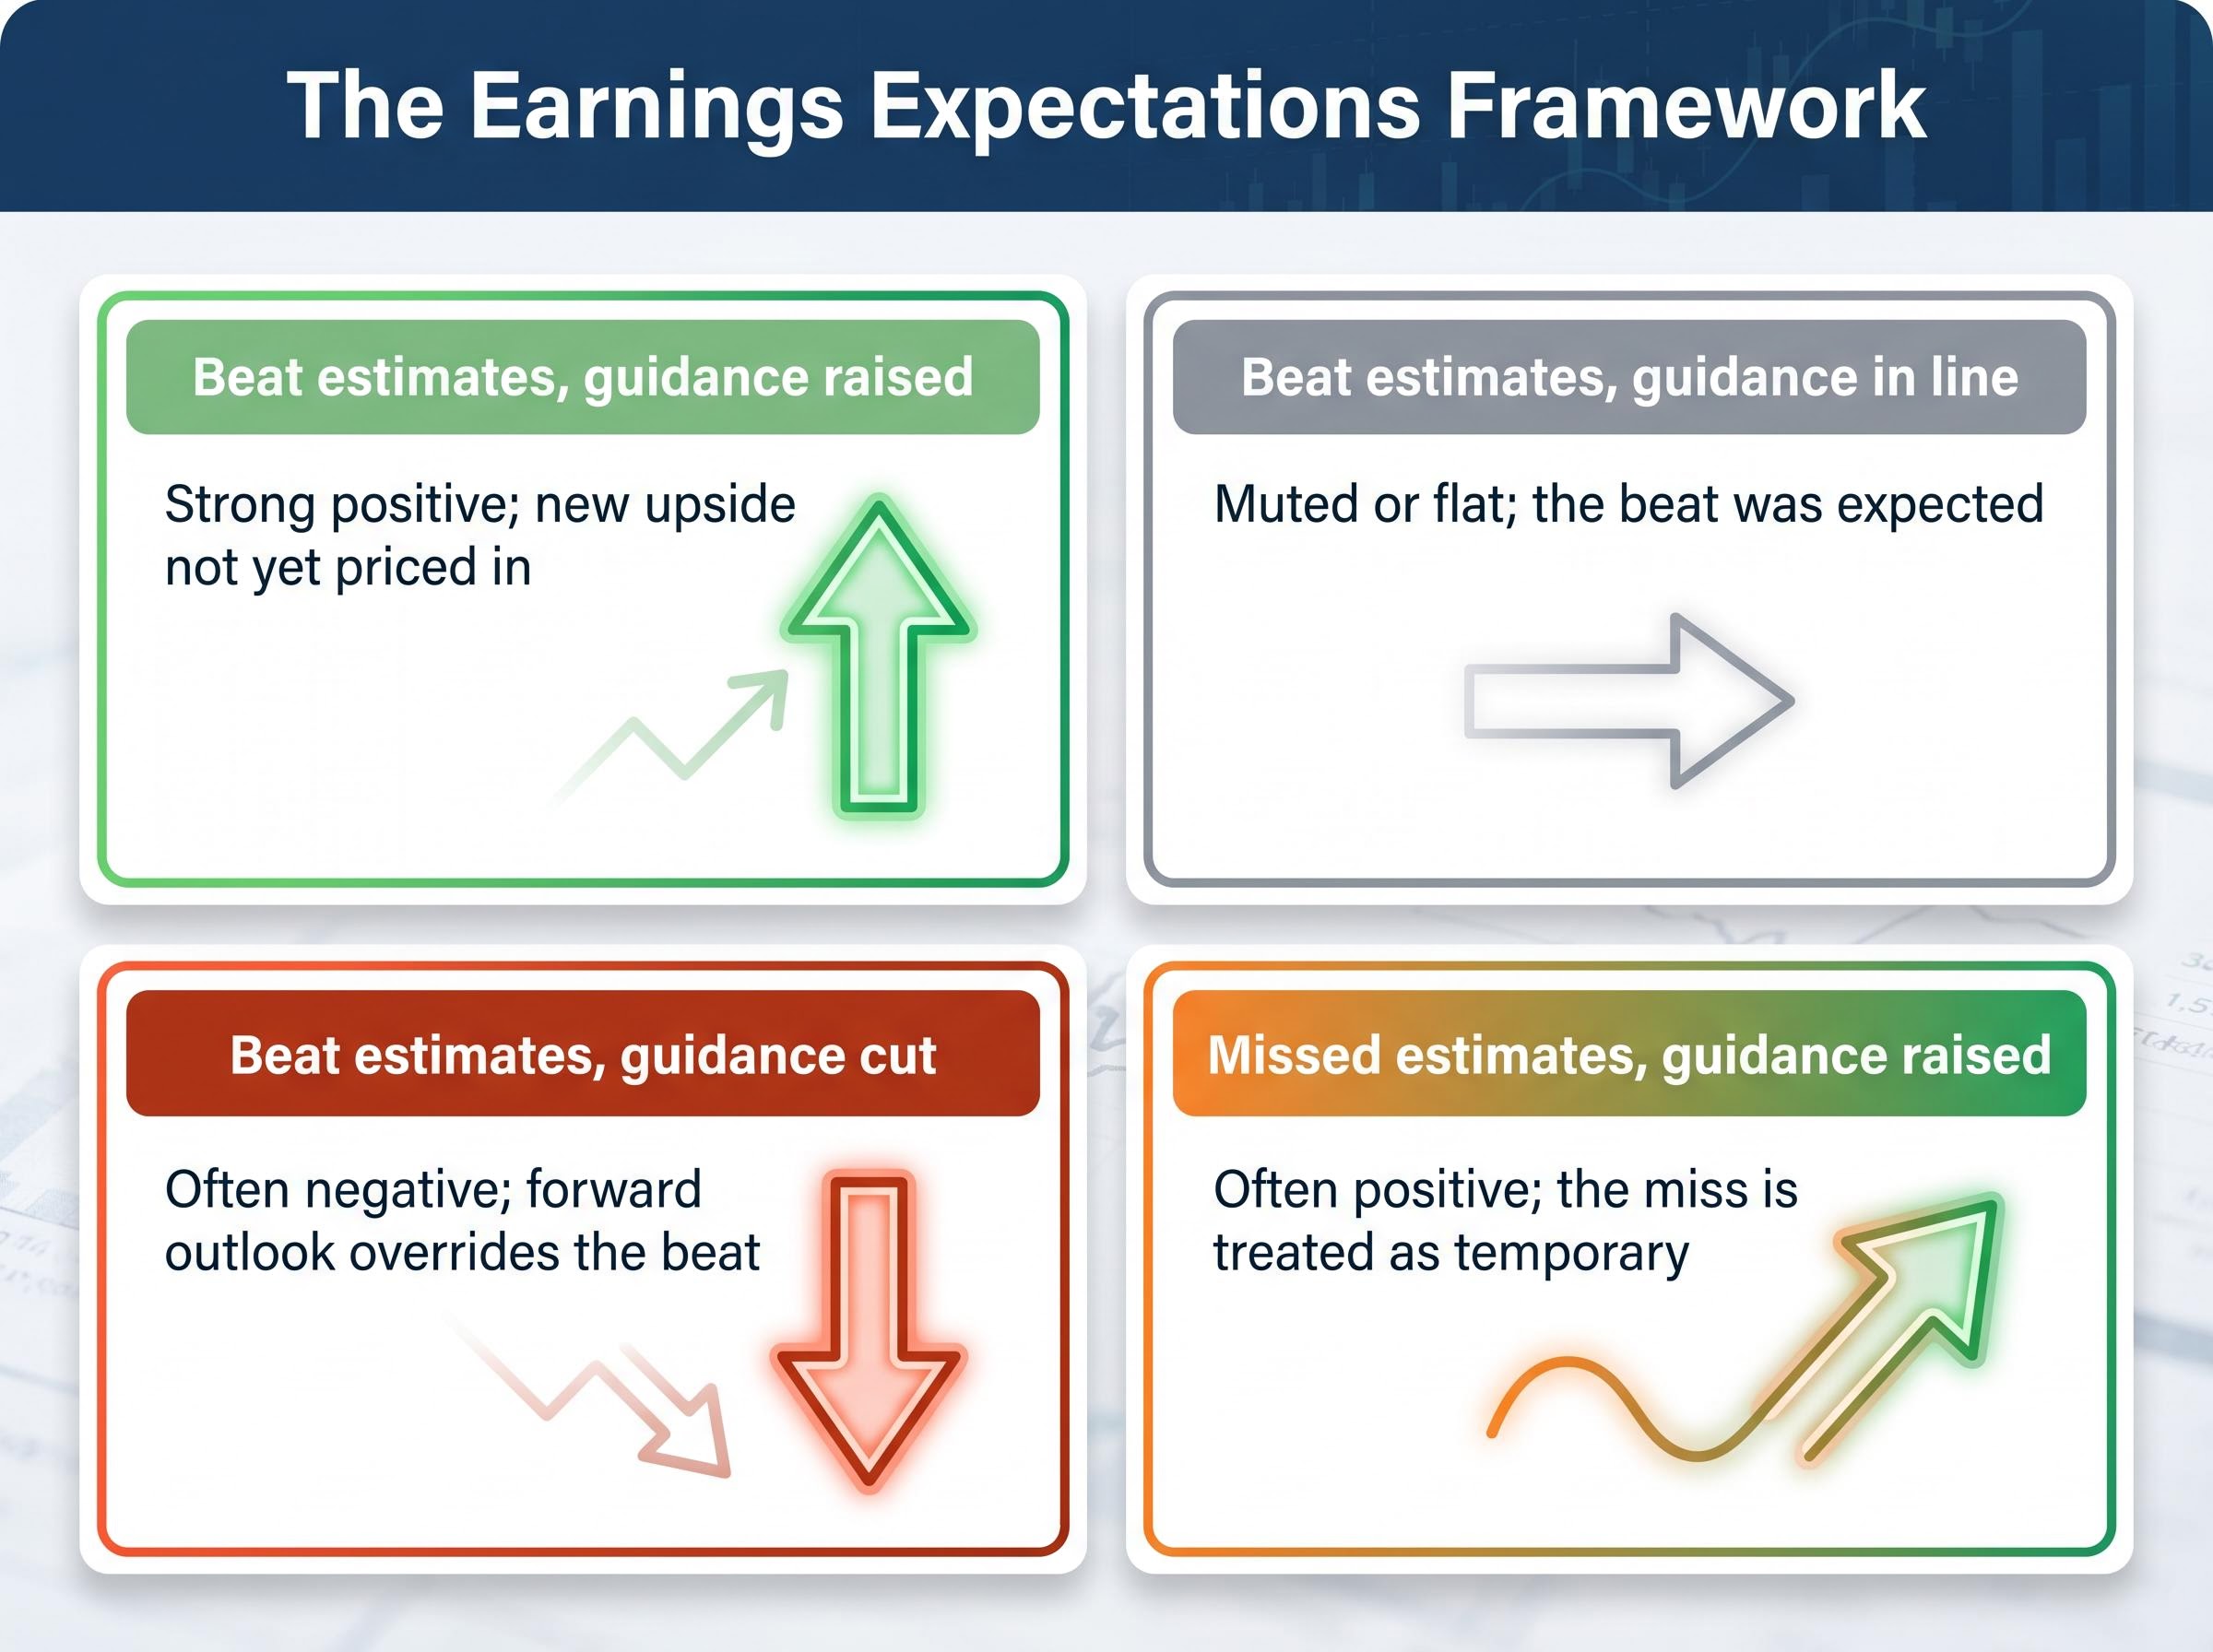
The following table illustrates how the combination of actual results and forward guidance, rather than the headline number alone, shapes the typical market response:
| Scenario | Typical market reaction |
|---|---|
| Beat estimates, guidance raised | Strong positive; new upside not yet priced in |
| Beat estimates, guidance in line | Muted or flat; the beat was expected |
| Beat estimates, guidance cut | Often negative; forward outlook overrides the beat |
| Missed estimates, guidance raised | Often positive; the miss is treated as temporary |
Without understanding that the stock price is a forward-looking mechanism rather than a scorecard, every post-earnings reaction will continue to seem irrational.
The sequence typically unfolds in three stages, each with its own mechanical logic.
Palantir’s Q1 2026 results, reported on approximately 4-6 May 2026, illustrate what a comprehensive beat-and-raise looks like. Revenue came in at $1.63 billion (up 85% year-over-year), EPS of $0.33 beat the $0.28 consensus estimate by approximately 19%, and management raised full-year 2026 guidance to +71% revenue growth. Whether a stock rises or falls on results of that magnitude still depends on how far expectations had already run ahead of the report.
Goldman Sachs’s proprietary sentiment indicator reaching the 73rd historical percentile in early May 2026 is a concrete illustration of earnings already absorbed into prices, with strategists noting that even genuine 16% EPS growth (stripping out one-time items) appeared insufficient to generate incremental upside when sentiment was already elevated.
S&P Global Ratings observed in early May 2026 that Q1 results showed “strong results but sentiment sours,” a reminder that forward sentiment can diverge sharply from historical performance data.
The pattern holds across sectors and market cycles. The earnings beat is the headline; the guidance and the whisper number are the mechanism.
If pessimistic expectations are already priced into a stock ahead of a report, the actual miss may contain no new negative information. The selling pressure that would normally accompany a miss has already played out in the weeks before the announcement. When the results land and confirm what was already feared, the absence of further bad news can itself trigger a relief rally.
The conditions that most commonly produce a rally on a miss follow a recognisable pattern:
The broader Q1 2026 context reinforces the point. Blended revenue growth came in at 11.1% year-over-year as of 1 May 2026, above the 9.9% quarter-end estimate, according to FactSet. Even modest beats on the revenue side contribute to positive sentiment shifts when the market’s baseline expectation was lower.
Sentiment and market price divergence reached a historically extreme level in April 2026, when the University of Michigan Consumer Sentiment Index hit a record low of 49.8 while the S&P 500 traded near all-time highs, a pattern that historically has tended to precede market recoveries rather than sustained declines.
Historical quarterly results describe what has already happened. Guidance describes what management believes is coming. For investors focused on future value, guidance is the more actionable signal.
A quiet reduction in forward guidance, sometimes framed as a “conservative” update, is one of the most telling warning signals to watch for. A company reporting strong headline numbers while trimming its forward outlook has effectively told the market that the best quarter may already be behind it. Conversely, raised guidance following a miss can carry more weight than the miss itself, because it reframes the trajectory as improving rather than deteriorating.
The practical filter starts with what to look at first. Guidance revisions, revenue trajectory across multiple quarters, and margin trends are the primary signals. The single-quarter EPS headline is the least useful number in isolation.
Fidelity’s framework offers a useful starting point: after reading an earnings report, the central question is whether the original reason for owning the stock still holds.
According to Fidelity, investors who reassess whether the original reason for buying a stock still holds, rather than reacting to the morning’s price move, are better positioned to make disciplined decisions during earnings volatility.
Having a predetermined plan before earnings drop (deciding in advance to trim if guidance is cut, for example) makes disciplined execution substantially easier under pressure.
The forward estimate trajectory for the S&P 500 also provides context beyond the current quarter. According to FactSet data as of 1 May 2026, analysts forecast EPS growth of +21.3% for Q2 2026, +23.0% for Q3, and +20.6% for Q4. Earnings season is not a single event; it is a recurring cycle where each quarter’s results reset the bar for the next.
The FactSet Earnings Insight report dated 1 May 2026 tracks these figures in real time across all S&P 500 reporters, showing blended EPS growth of 27.1% year-over-year alongside an 84% positive surprise rate, both of which sit well above historical seasonal averages.
A three-step evaluation sequence can help structure the response to any earnings report:
Loss aversion (the tendency for the pain of a falling stock to outweigh the satisfaction of an equivalent gain) and the fear of missing out on large post-earnings rallies consistently cause retail investors to react at the worst possible moment. Recognising these patterns does not eliminate them, but it does make the predetermined plan easier to follow.
Peer-reviewed research on loss aversion and earnings reactions confirms that retail investors respond more sharply to negative earnings surprises than to positive ones of equivalent magnitude, an asymmetry that helps explain why panic selling after a guidance cut tends to be more severe than the underlying revision warrants.
A stock’s post-earnings move is a signal about the gap between results and expectations, not a verdict on the company’s underlying health. The market is not reacting to whether a company performed well or poorly. It is reacting to whether the company performed differently from what was already priced in.
Investors who understand this framework will misread fewer post-earnings moves, make fewer panic-driven decisions, and hold through volatility more effectively when the original thesis remains intact. Q1 2026 illustrates the point clearly: blended EPS growth of 27.1% year-over-year and 84% of S&P 500 companies beating estimates as of early May demonstrate both the scale of corporate outperformance and why even outstanding results do not automatically translate into stock gains.
The Q1 2026 earnings season delivered blended EPS growth of 27.1%, an 84% beat rate, and an aggregate surprise of 20.7%, nearly three times the five-year average, with capital already rotating toward small-caps and value as investors broaden earnings exposure beyond mega-cap technology.
The next earnings report that lands on a portfolio position will test the framework. Preparation, not reaction speed, determines whether the result is a disciplined decision or an expensive mistake.
This article is for informational purposes only and should not be considered financial advice. Investors should conduct their own research and consult with financial professionals before making investment decisions.
Earnings season is the roughly six-week window after each calendar quarter closes when public U.S. companies are required by SEC and FINRA rules to release their quarterly financial results. It occurs four times per year, with the main windows in April-May, July-August, October-November, and January-February.
A stock drops after strong earnings when the positive results were already priced into the share price before the report landed, meaning the good news created no new upside for buyers. If forward guidance also disappoints or the informal whisper number sat above the official beat, selling pressure typically follows even a genuine earnings outperformance.
A whisper number is the informal market expectation for a company's earnings that often sits above the published analyst consensus estimate. A company can beat the official consensus and still disappoint investors if the actual expectation embedded in the stock price was even higher.
Investors should check forward guidance first before reacting to the headline EPS number, compare revenue and margin trends across the prior two or three quarters, and ask whether the original reason for owning the stock is still intact. Having a predetermined plan before results land, such as deciding in advance to trim if guidance is cut, makes disciplined execution substantially easier under pressure.
As of 1 May 2026, blended EPS growth for the S&P 500 came in at 27.1% year-over-year, more than double the pre-season consensus estimate of 13.2%, with 84% of companies beating EPS estimates, well above the 10-year average of 76%. Blended revenue growth also came in at 11.1% year-over-year, above the 9.9% quarter-end estimate according to FactSet.