
Why AUD/USD Hinges on the Strait of Hormuz, Not the RBA
1 hr ago
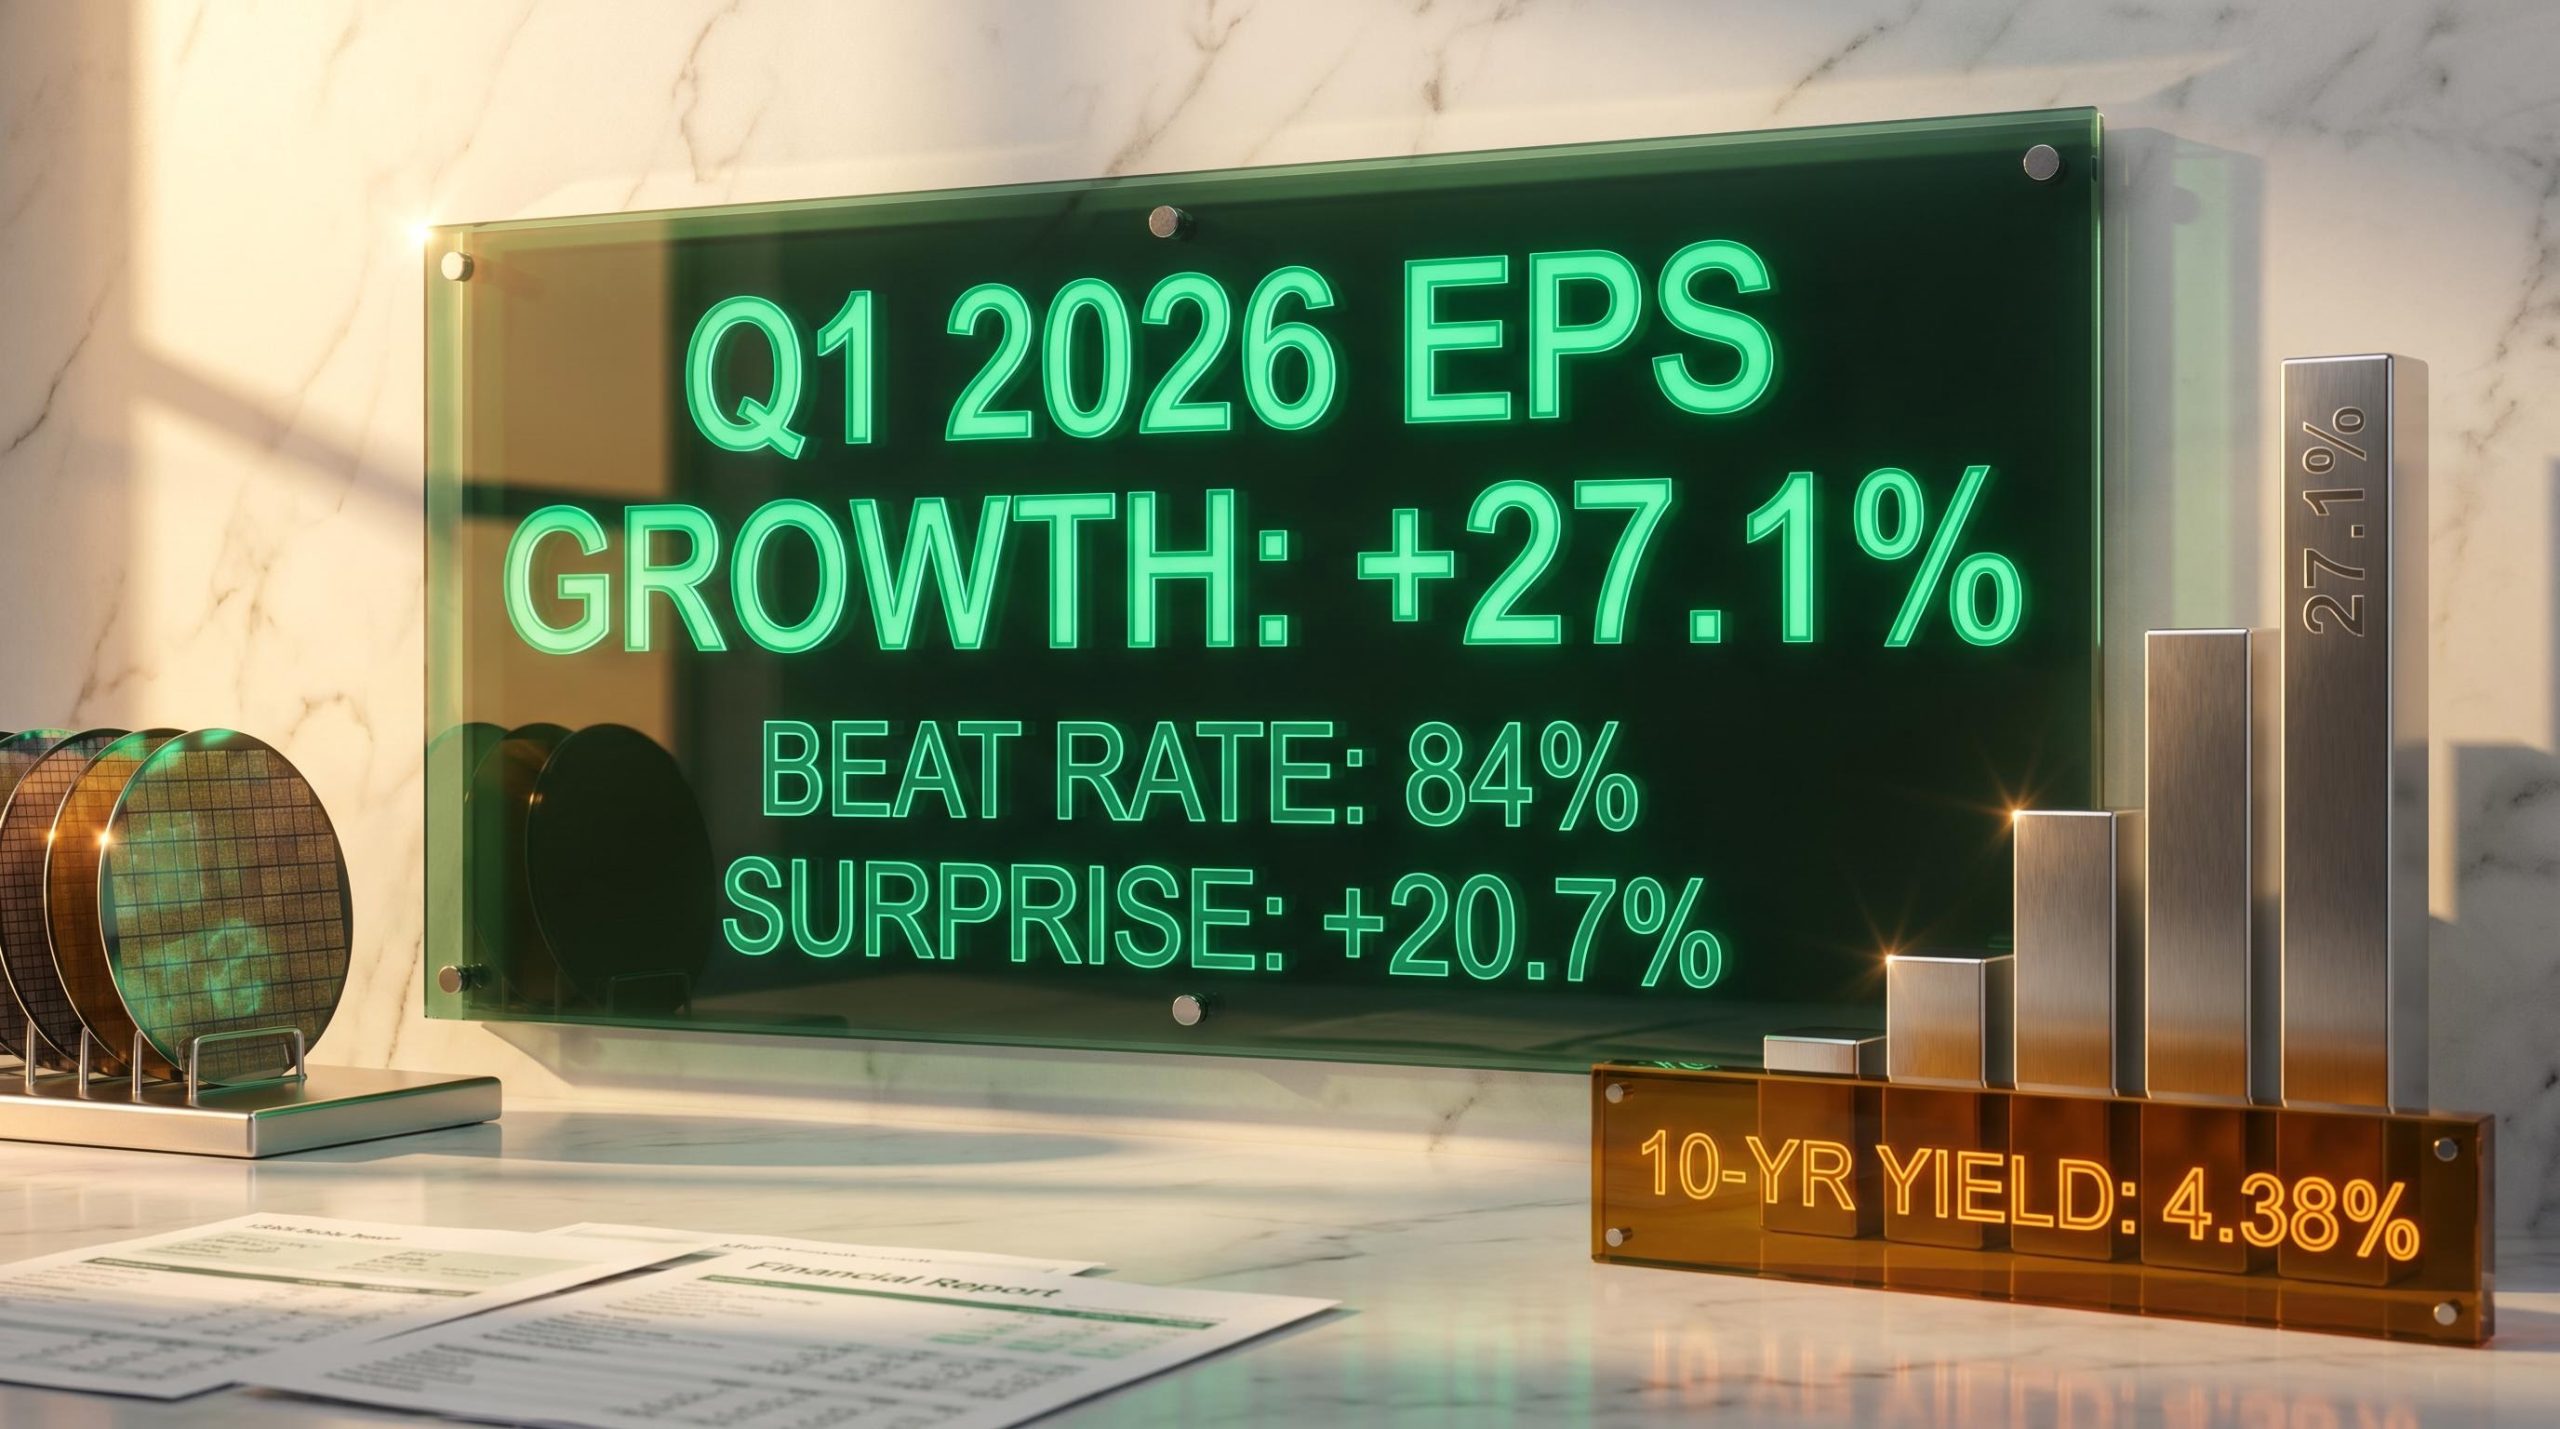
S&P 500 companies are beating earnings estimates by 20.7% on average this quarter, nearly three times the five-year norm. With 63% of the index having reported as of 1 May 2026, the Q1 2026 earnings season has produced a blended growth rate of 27.1%, up from 13.1% at quarter-end, driven by an extraordinary surge in technology and communications sector profits. The week of 5 May brings over 100 more results, including AMD, Palantir, Disney, and McDonald’s. What follows is an analysis of where the profit growth is actually coming from, what diverging results among mega-cap names reveal about sector health, why the semiconductor rally has been so aggressive, and what the macro backdrop means for whether this momentum can hold through summer 2026.
The blended earnings growth rate for Q1 2026 did not arrive at 27.1% in a single leap. It climbed there in three distinct moves, each one steeper than the last:
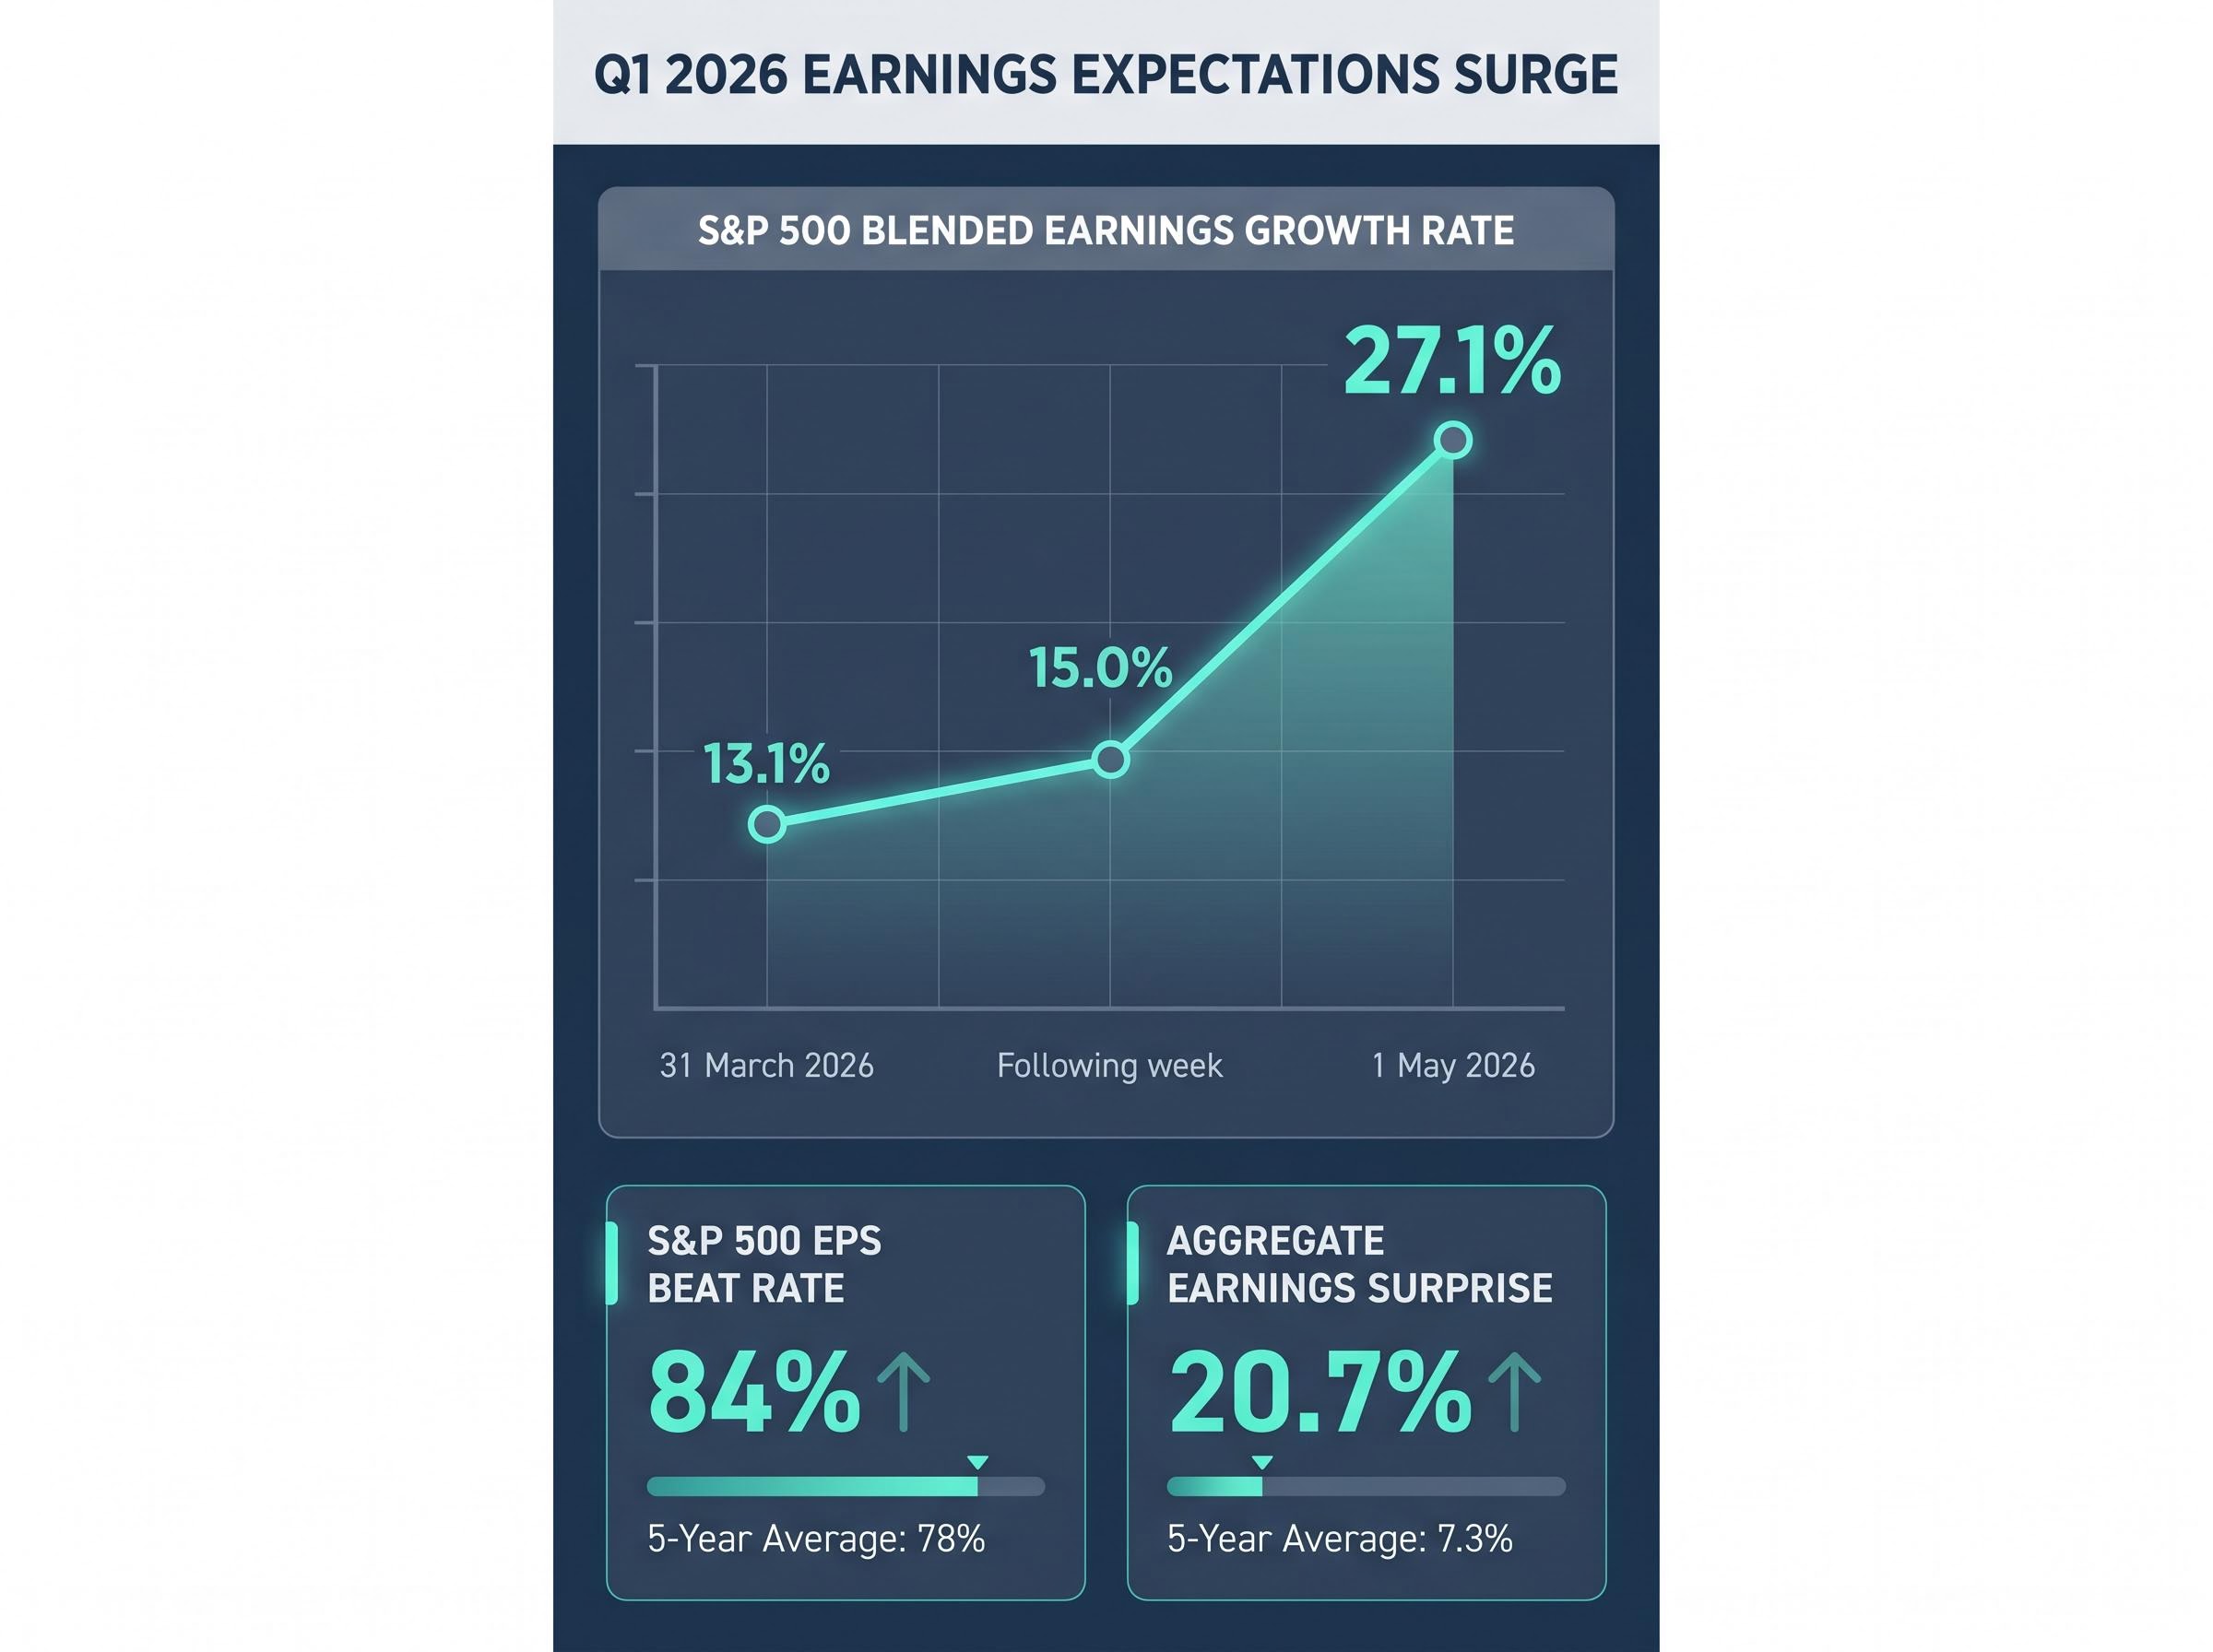
That trajectory matters. In a typical quarter, the blended rate drifts upward by a few percentage points as companies beat estimates by the usual margin. This season, the rate nearly doubled in four weeks. According to FactSet data, 84% of S&P 500 companies beat EPS estimates, above the five-year average of 78%, while 81% exceeded revenue expectations. Nine of eleven sectors are reporting year-over-year earnings growth, confirming the strength is broad-based rather than carried by a handful of names.
The trajectory from 13.1% to 27.1% was not visible in the pre-season setup: analysts entered April treating backward-looking quarterly results as the primary variable, while the forward guidance signals across tech, pharma, and consumer sectors were already indicating that the gap between estimate and delivery would be unusually wide.
FactSet Earnings Insight data for Q1 2026 places the blended earnings growth rate at 27.1% as of 1 May, with 84% of reporting companies beating EPS estimates and an aggregate surprise figure of 20.7%, nearly three times the five-year norm of 7.3%.
The aggregate earnings surprise of 20.7% is nearly three times the five-year average of 7.3%, the widest gap between expectation and reality in the current reporting cycle.
What this tells investors is specific: analysts entered Q1 with conservatively low estimates, and the gap between expectation and delivery has been the mechanical fuel powering equity gains. Whether the rally is justified or sentiment-driven depends on whether the incoming wave of reports sustains that gap.
The instinct heading into any earnings season is to treat “Big Tech” as a directional bloc. Q1 2026 results have made that instinct expensive. Alphabet posted strong cloud-computing results and saw its shares surge in response. Microsoft and Meta, despite reporting results that appeared solid on the surface, saw their shares decline.
| Company | Result Characterisation | Post-Earnings Share Move |
|---|---|---|
| Alphabet | Strong cloud-computing revenue growth | Shares surged |
| Microsoft | Solid headline figures, margin scrutiny | Shares declined |
| Meta | Solid headline figures, competitive pressure | Shares declined |
The market is drawing a distinction investors should note. Angelo Kourkafas, investment strategist at Edward Jones, observed that rapid profit expansion is being counterbalanced by oil and yield pressure, meaning the market is no longer rewarding “good enough” results; it is rewarding specificity about where growth is accelerating.
Alphabet’s Google Cloud unit is capturing AI infrastructure spend directly, converting hyperscaler demand into revenue growth that the market can price with confidence. Meta and Microsoft face more complex margin dynamics: Meta’s advertising revenue is subject to cyclical pressure, and Microsoft’s enterprise software division competes against an expanding field of AI-native challengers.
This distinction is the lens through which AMD’s upcoming results (scheduled for the week of 5 May) should be read. If cloud infrastructure spend is the engine, AMD’s data centre GPU revenue will confirm whether that engine is still accelerating.
Semiconductors are the integrated circuits that power AI servers, consumer devices, data centres, and industrial equipment. They are a foundational input for virtually every technology product, from the chips running cloud infrastructure to the processors in smartphones and vehicles.
Their earnings carry a signal that extends well beyond the chip sector itself. Chip orders reflect investment decisions made 6-12 months earlier. Strong semiconductor results today mean that enterprise customers and hyperscale cloud operators were aggressively investing in AI infrastructure during late 2025. Three characteristics make semiconductor earnings function as a leading economic indicator:
The Philadelphia SE Semiconductor Index (SOX) gained approximately 48% from late March through early May 2026. AMD climbed more than 80% over the same period.
The AI capital expenditure cycle, in which hyperscalers committed $650 billion in infrastructure spending for 2026, is the single structural force converting Alphabet’s cloud revenue growth and AMD’s order book into share price appreciation; semiconductor gains are not speculative sentiment but a direct reflection of capital commitments made quarters in advance.
Michael O’Rourke, chief market strategist at JonesTrading, described AMD’s upcoming results as especially significant given the stock’s dramatic recent appreciation.
If AMD’s report confirms the supply-side demand signal, it validates the technology-led growth story that has defined this earnings season. If it disappoints, it raises questions about whether semiconductor share prices have run ahead of the underlying order book.
The retrospective data is strong. The question now is whether the next wave of results confirms a broad-based expansion or reveals the growth as concentrated in technology.
Over 100 S&P 500 companies are scheduled to report the week of 5 May 2026. Three names in particular each test a distinct economic hypothesis:
The K-shaped consumer divide, in which high-income household spending props up aggregate metrics while lower-income households deplete savings to cover fuel and food costs, is precisely the dynamic that makes McDonald’s volume figures a more meaningful economic signal than headline retail sales data.
AMD and Palantir arrive as paired data points. AMD tests whether semiconductor demand from hyperscalers remains at the levels implied by its 80%+ share price gain. Palantir tests whether the AI spending cycle has matured enough to produce software revenue growth outside of defence procurement. Tajinder Dhillon of LSEG has cited a 27.8% growth tracking figure for the season; both results will determine whether that rate holds or compresses.
Disney and McDonald’s stress-test opposite ends of the consumer spectrum. Disney’s fiscal Q2 2026 results will show whether households continued spending on entertainment during January-March 2026. McDonald’s will reveal whether even the value segment is experiencing volume weakness. Softness in either would be a meaningful counterweight to the technology-driven optimism that has characterised the season.
The earnings data has been unambiguously strong. The environment surrounding it is less cooperative. Three specific mechanisms could slow the momentum:
Angelo Kourkafas of Edward Jones flagged 4.5% on the U.S. 10-year Treasury yield as the level that could prompt equity valuation reassessment. The yield stood at approximately 4.38% as of late 1 May 2026.
The FOMC March 2026 meeting minutes confirm that at least one board member voted against holding rates steady, citing elevated inflation and an uncertain economic outlook, providing the official policy record behind the yield pressure that equity strategists are now flagging as a valuation risk.
Jeff Buchbinder of LPL Financial described the labour market as “slowing but still holding up.” The payrolls print on 8 May will test that characterisation directly.
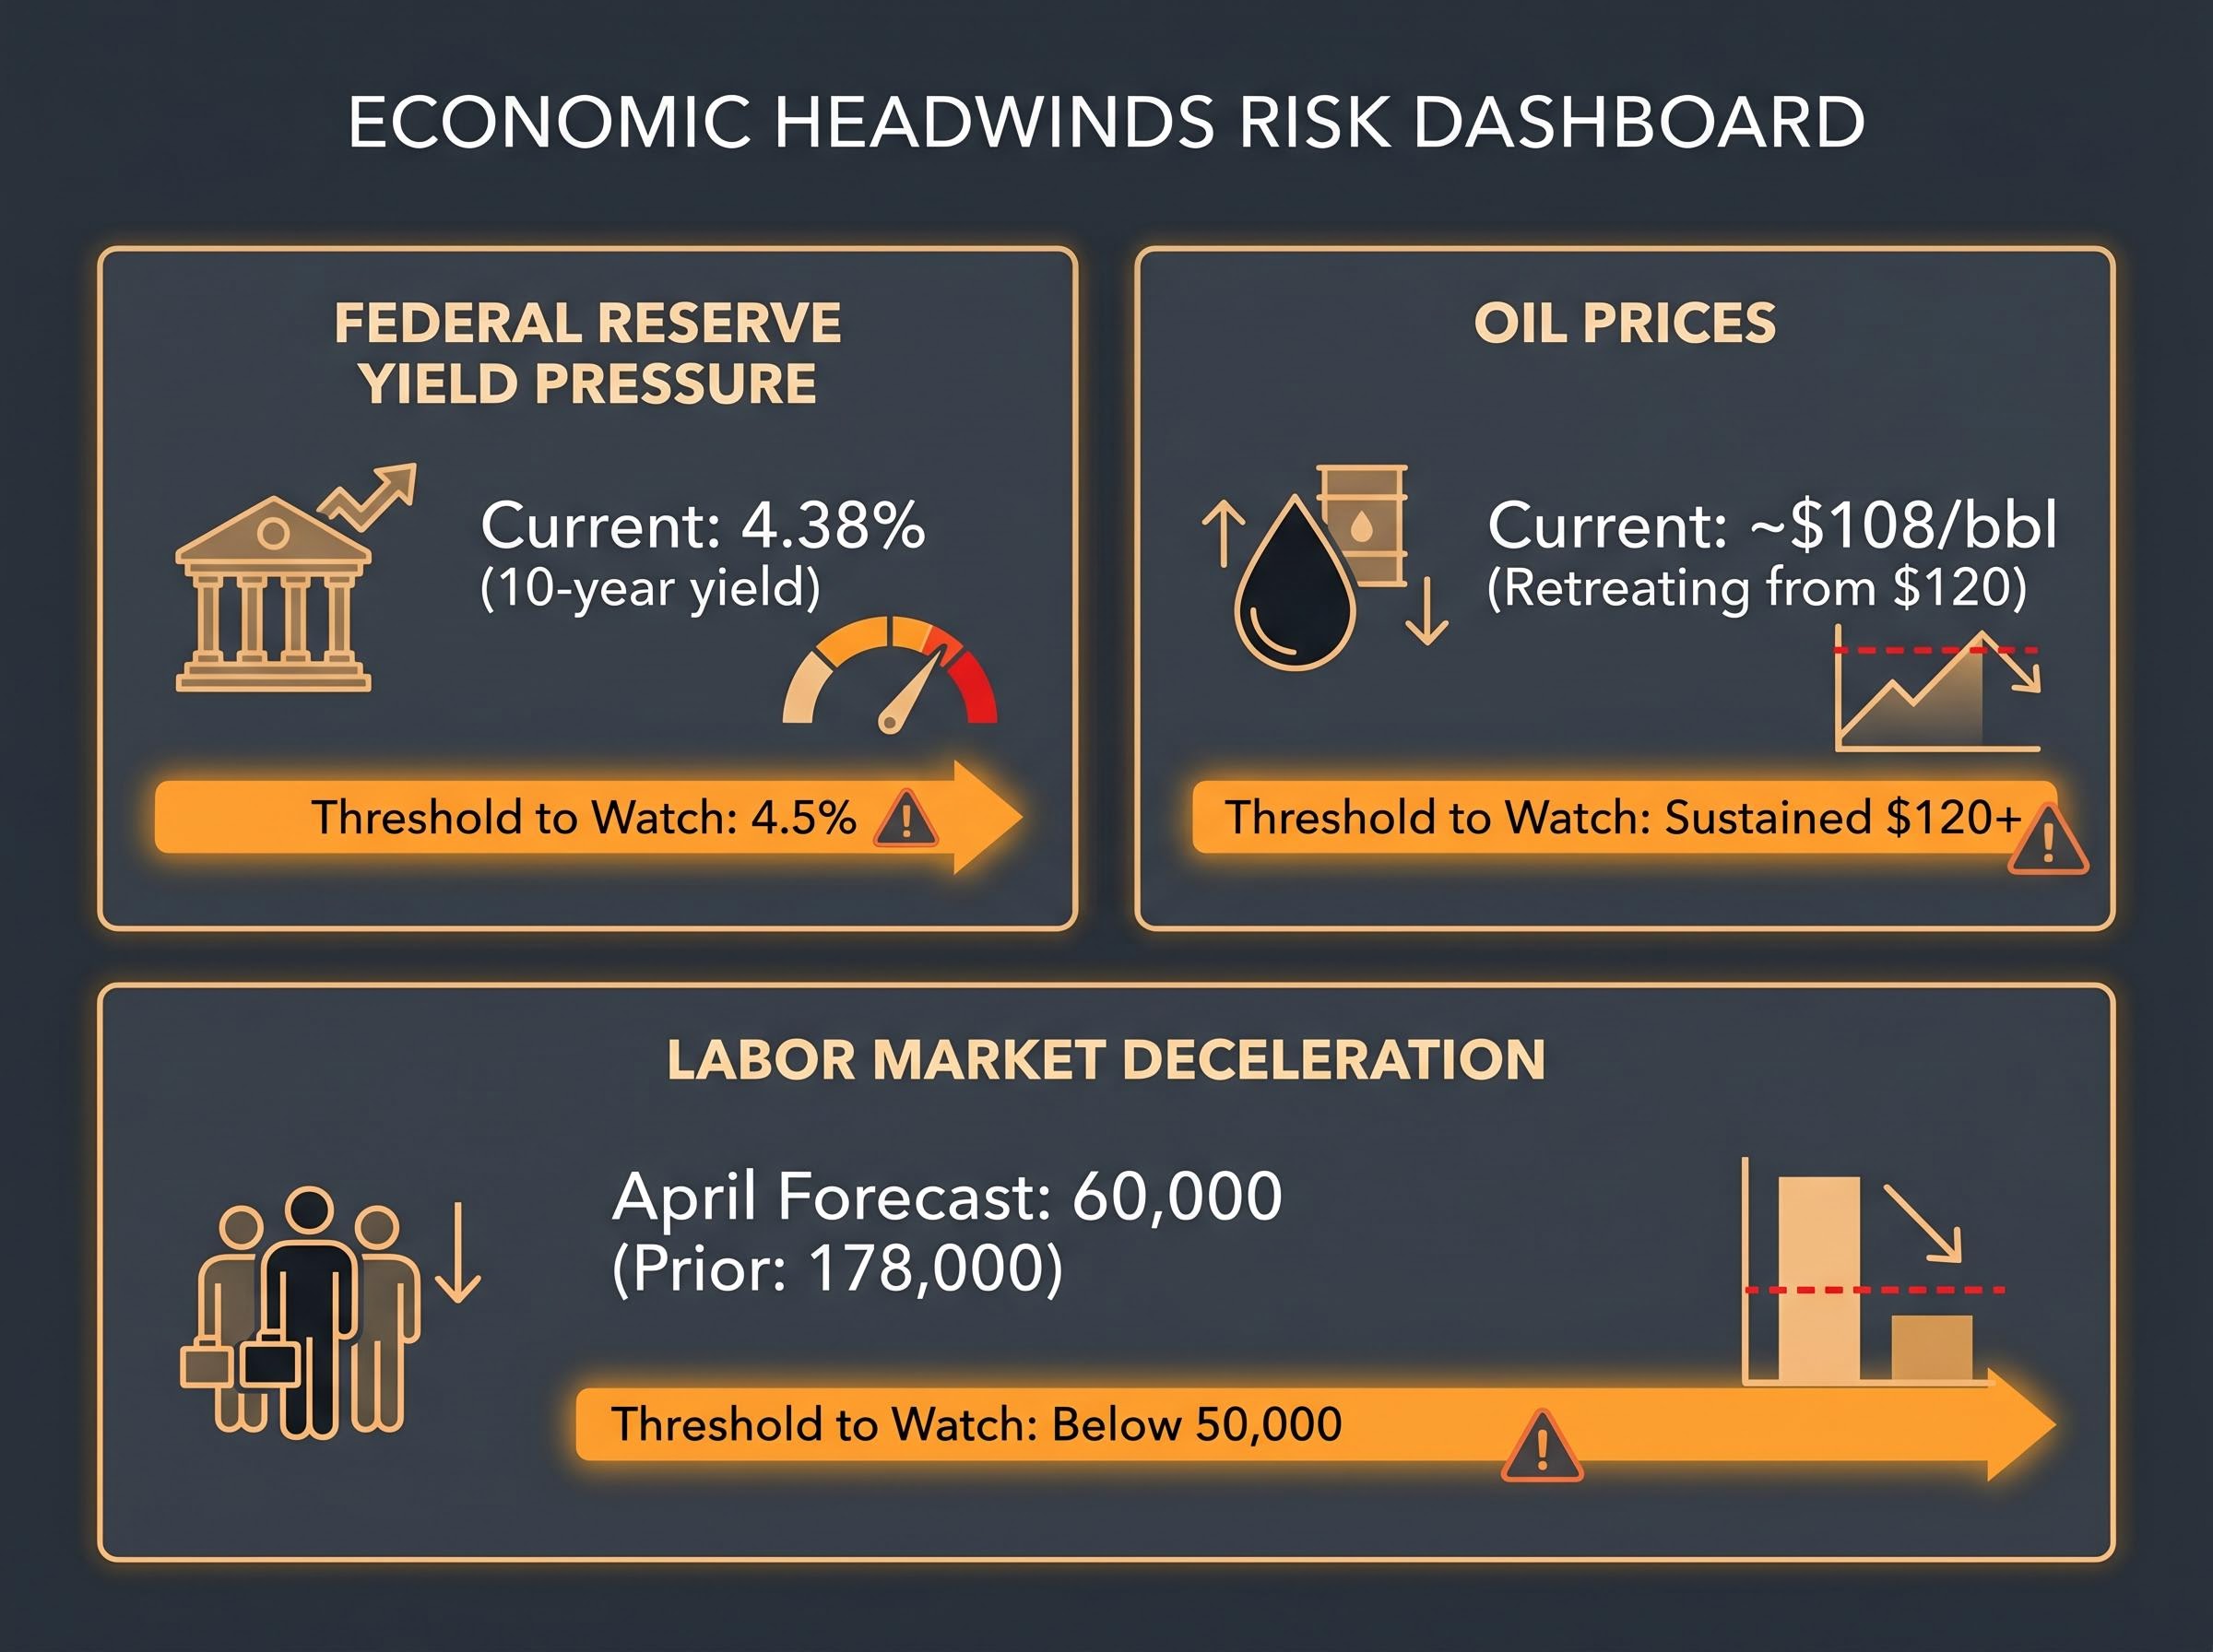
| Headwind | Current Reading | Threshold to Watch |
|---|---|---|
| Federal Reserve yield pressure | 4.38% 10-year yield | 4.5% trigger (per Kourkafas) |
| Oil prices | Approx. $108/bbl, retreating from $120 | Sustained $120+ as cost shock |
| April payrolls | 60,000 forecast vs. 178,000 prior | Print below 50,000 |
Each headwind operates on a different timeline. Yield pressure is immediate. Oil’s cost impact lags by 1-2 quarters. Payrolls signal the consumer spending capacity that underpins Q2 and Q3 earnings. Investors weighing only the current beat rate without these variables may be surprised by how quickly forward estimates shift.
The S&P 500 gained more than 10% in April 2026, its strongest monthly performance since 2020.
The Nasdaq climbed more than 15% over the same period, also its best month since 2020, a measure of how much optimism is already embedded in current equity prices.
Analyst projections for the remainder of 2026 show expected deceleration from Q1’s 27.1% pace, but sustained double-digit growth across every quarter:
| Quarter | Projected EPS Growth |
|---|---|
| Q1 2026 (actual) | 27.1% |
| Q2 2026 | 21.3% |
| Q3 2026 | 23.0% |
| Q4 2026 | 20.6% |
| Full-Year 2026 | 21.3% |
Three data points in the next seven days will determine whether the earnings momentum extends or stalls: AMD’s results (the semiconductor demand signal), the 8 May payrolls report (labour market and consumer health), and the aggregate beat rate once the full wave of the 5 May week is counted.
The same mega-cap technology outperformance that has driven the blended growth rate to 27.1% also concentrates index concentration risk at historically extreme levels, with five stocks controlling approximately 23% of the broad US market and engineering more than half of April’s recovery after causing roughly 70% of Q1’s prior decline.
With the market having already priced in exceptional results, the risk-reward calculation shifts. The question is no longer whether earnings will be strong. It is whether they will be strong enough to justify current prices against rising yields and slowing job growth. That is the question to carry into the second half of the season.
This article is for informational purposes only and should not be considered financial advice. Investors should conduct their own research and consult with financial professionals before making investment decisions. Past performance does not guarantee future results. Financial projections are subject to market conditions and various risk factors.
The blended earnings growth rate for Q1 2026 stands at 27.1% as of 1 May 2026, up sharply from the 13.1% analysts forecast at quarter-end, according to FactSet data.
Analysts entered Q1 2026 with conservatively low estimates, and technology and communications sector profits surged well beyond those forecasts, producing an aggregate earnings surprise of 20.7%, nearly three times the five-year average of 7.3%.
Investors should focus on AMD (semiconductor demand signal), Palantir (AI software monetisation), Disney (consumer discretionary health), and McDonald's (lower-income consumer resilience), plus the 8 May April payrolls report, which carries a consensus forecast of just 60,000 jobs added.
Three main risks are elevated Treasury yields (with 4.5% flagged as the equity valuation threshold), Brent crude oil that surpassed $120 per barrel before retreating to around $108, and a potentially weak April jobs report that could signal consumer spending deterioration heading into Q2 and Q3.
The Philadelphia SE Semiconductor Index gained approximately 48% from late March through early May 2026, reflecting the $650 billion AI infrastructure capex cycle committed by hyperscalers for 2026; strong chip results confirm that enterprise investment decisions made 6-12 months earlier are now converting into real revenue growth.