Analysts at professional research houses routinely spend more than 100 hours on qualitative investigation before they open a spreadsheet. For most retail investors analysing ASX bank stocks, the sequence is reversed: the model comes first, and the qualitative layer, if it arrives at all, comes as an afterthought.
Valuation tools such as the Dividend Discount Model (DDM) and price-to-earnings (PE) ratio comparisons are well understood and widely taught. What receives far less attention is the layer of judgment, macro context, and qualitative risk assessment that determines whether those model outputs are meaningful or misleading. In May 2026, with the RBA shifting back toward a hiking bias after three cuts in 2025, that distinction matters more than usual.
This guide explains what professional bank share valuation analysis actually looks like beyond the numbers: the economic conditions, property trends, credit quality signals, regulatory risks, and management credibility factors that separate a mechanical valuation from an informed investment view on ASX banking stocks.
Why the numbers alone will mislead you
Bendigo and Adelaide Bank (BEN) traded at approximately $10.40 in mid-2026, carrying a PE ratio of roughly 12x against a sector average of 18x. A straightforward sector-adjusted PE calculation, applying BEN’s FY24 earnings per share of $0.87 to the sector multiple, produces a valuation of $15.49 per share. On the surface, the gap between market price and model output looks like opportunity.
The DDM tells a similar story. Using BEN’s cash dividend of $0.63 and its gross dividend (including franking credits) of $0.93, a standard DDM produces an output range of $13.32 to $19.64 per share, depending on the discount rate and growth assumptions selected. Stretch the assumption matrix to its full range, and DDM outputs span from $7.22 to $32.50.
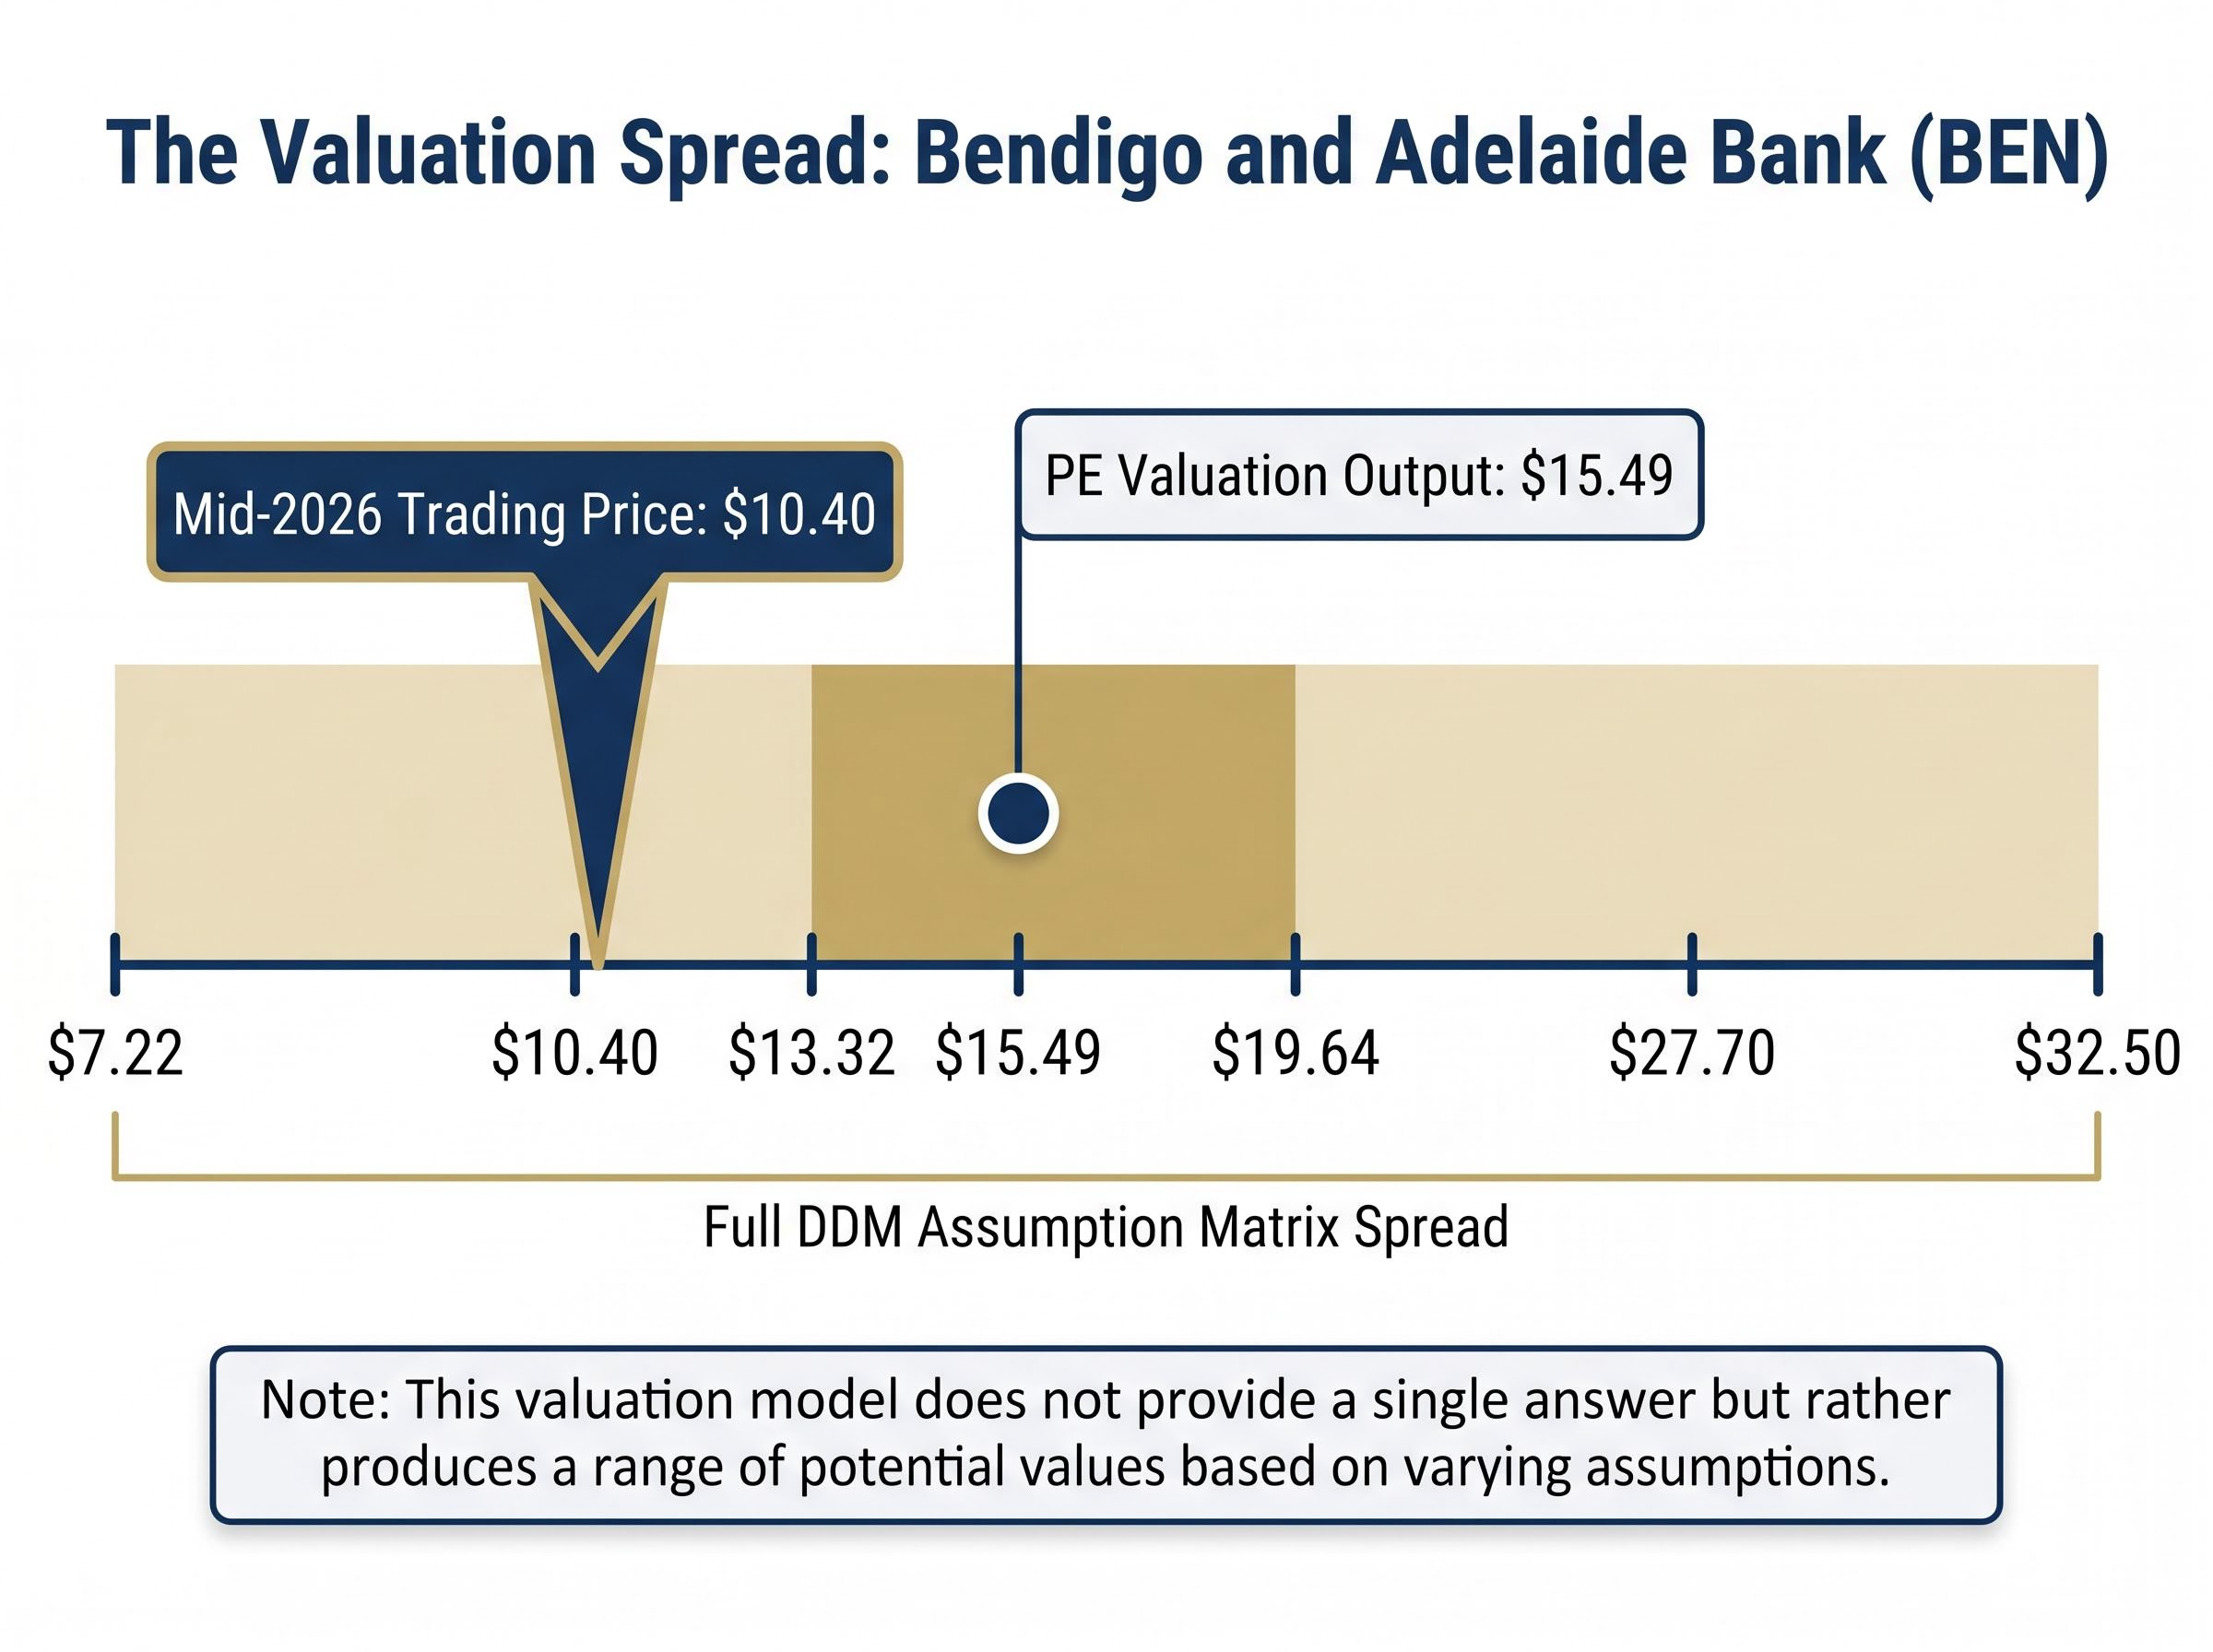
That spread is the point. The model does not produce an answer; it produces a range shaped entirely by the analyst’s input assumptions.
The model limitations for ASX bank shares become especially visible in a credit cycle turn: Big Four impaired loans climbed 15.4% to $9.6 billion in the first half of 2026 while combined cash profit fell approximately 2.1%, a divergence that standard DDM and PE inputs lagged by several reporting periods.
“Analysts typically conduct in excess of 100 hours of qualitative investigation before building a financial model.”
What DDM and PE ratios leave out
Neither the DDM nor a PE comparison captures the factors that determine whether a model’s assumptions are credible:
- Deposit mix and funding structure, which dictate how a bank’s margins actually respond to rate changes
- Regulatory overhang, including APRA capital add-ons and ASIC enforcement actions that constrain capital returns
- Management quality and risk culture, visible only through years of conference call commentary, provisioning decisions, and strategic execution
- Macro trajectory, including RBA forward guidance, housing turnover, and unemployment distribution across borrower cohorts
- Credit culture, including how aggressively a bank lends into stress and how early it intervenes when arrears rise
- ESG and climate risk exposure, which increasingly affects institutional capital allocation and relative multiples
The DDM sensitivity range of $7.22 to $32.50 illustrates a simple truth: assumptions drive the output more than the formula itself. The real analytical task is determining which assumptions are credible, and that requires qualitative judgment.
When big ASX news breaks, our subscribers know first
How the RBA rate cycle reshapes bank earnings in ways a model cannot capture
The assumption that higher rates automatically mean wider margins collapses on contact with competitive reality. The RBA’s cash rate stood at 3.60% as of May 2026, following three cuts in 2025. December 2025 board minutes then surprised markets with a renewed hiking bias, and approximately 50 basis points of hikes were priced for the remainder of 2026. Headline CPI was running at approximately 3.8%, with core CPI at approximately 3.3%, both above the RBA’s 2-3% target band.
Macquarie research suggests the shift in rate expectations could add 2-4 basis points to major bank net interest margins (NIMs, the difference between what a bank earns on loans and pays on deposits). After allowing for competitive pressures, a realistic sector improvement of 3-5 basis points is expected.
NIM trajectory and regulatory headwinds are compounding in 2026 in ways that a single-period PE comparison obscures entirely: the rate tailwind from the 2022-2023 hike cycle has largely dissipated, Hayne Royal Commission exits from wealth management continue to compress non-interest income, and RBA interchange fee caps are narrowing the fee revenue buffer that had partially offset margin pressure in prior cycles.
The variation across banks, however, is where the qualitative analysis matters.
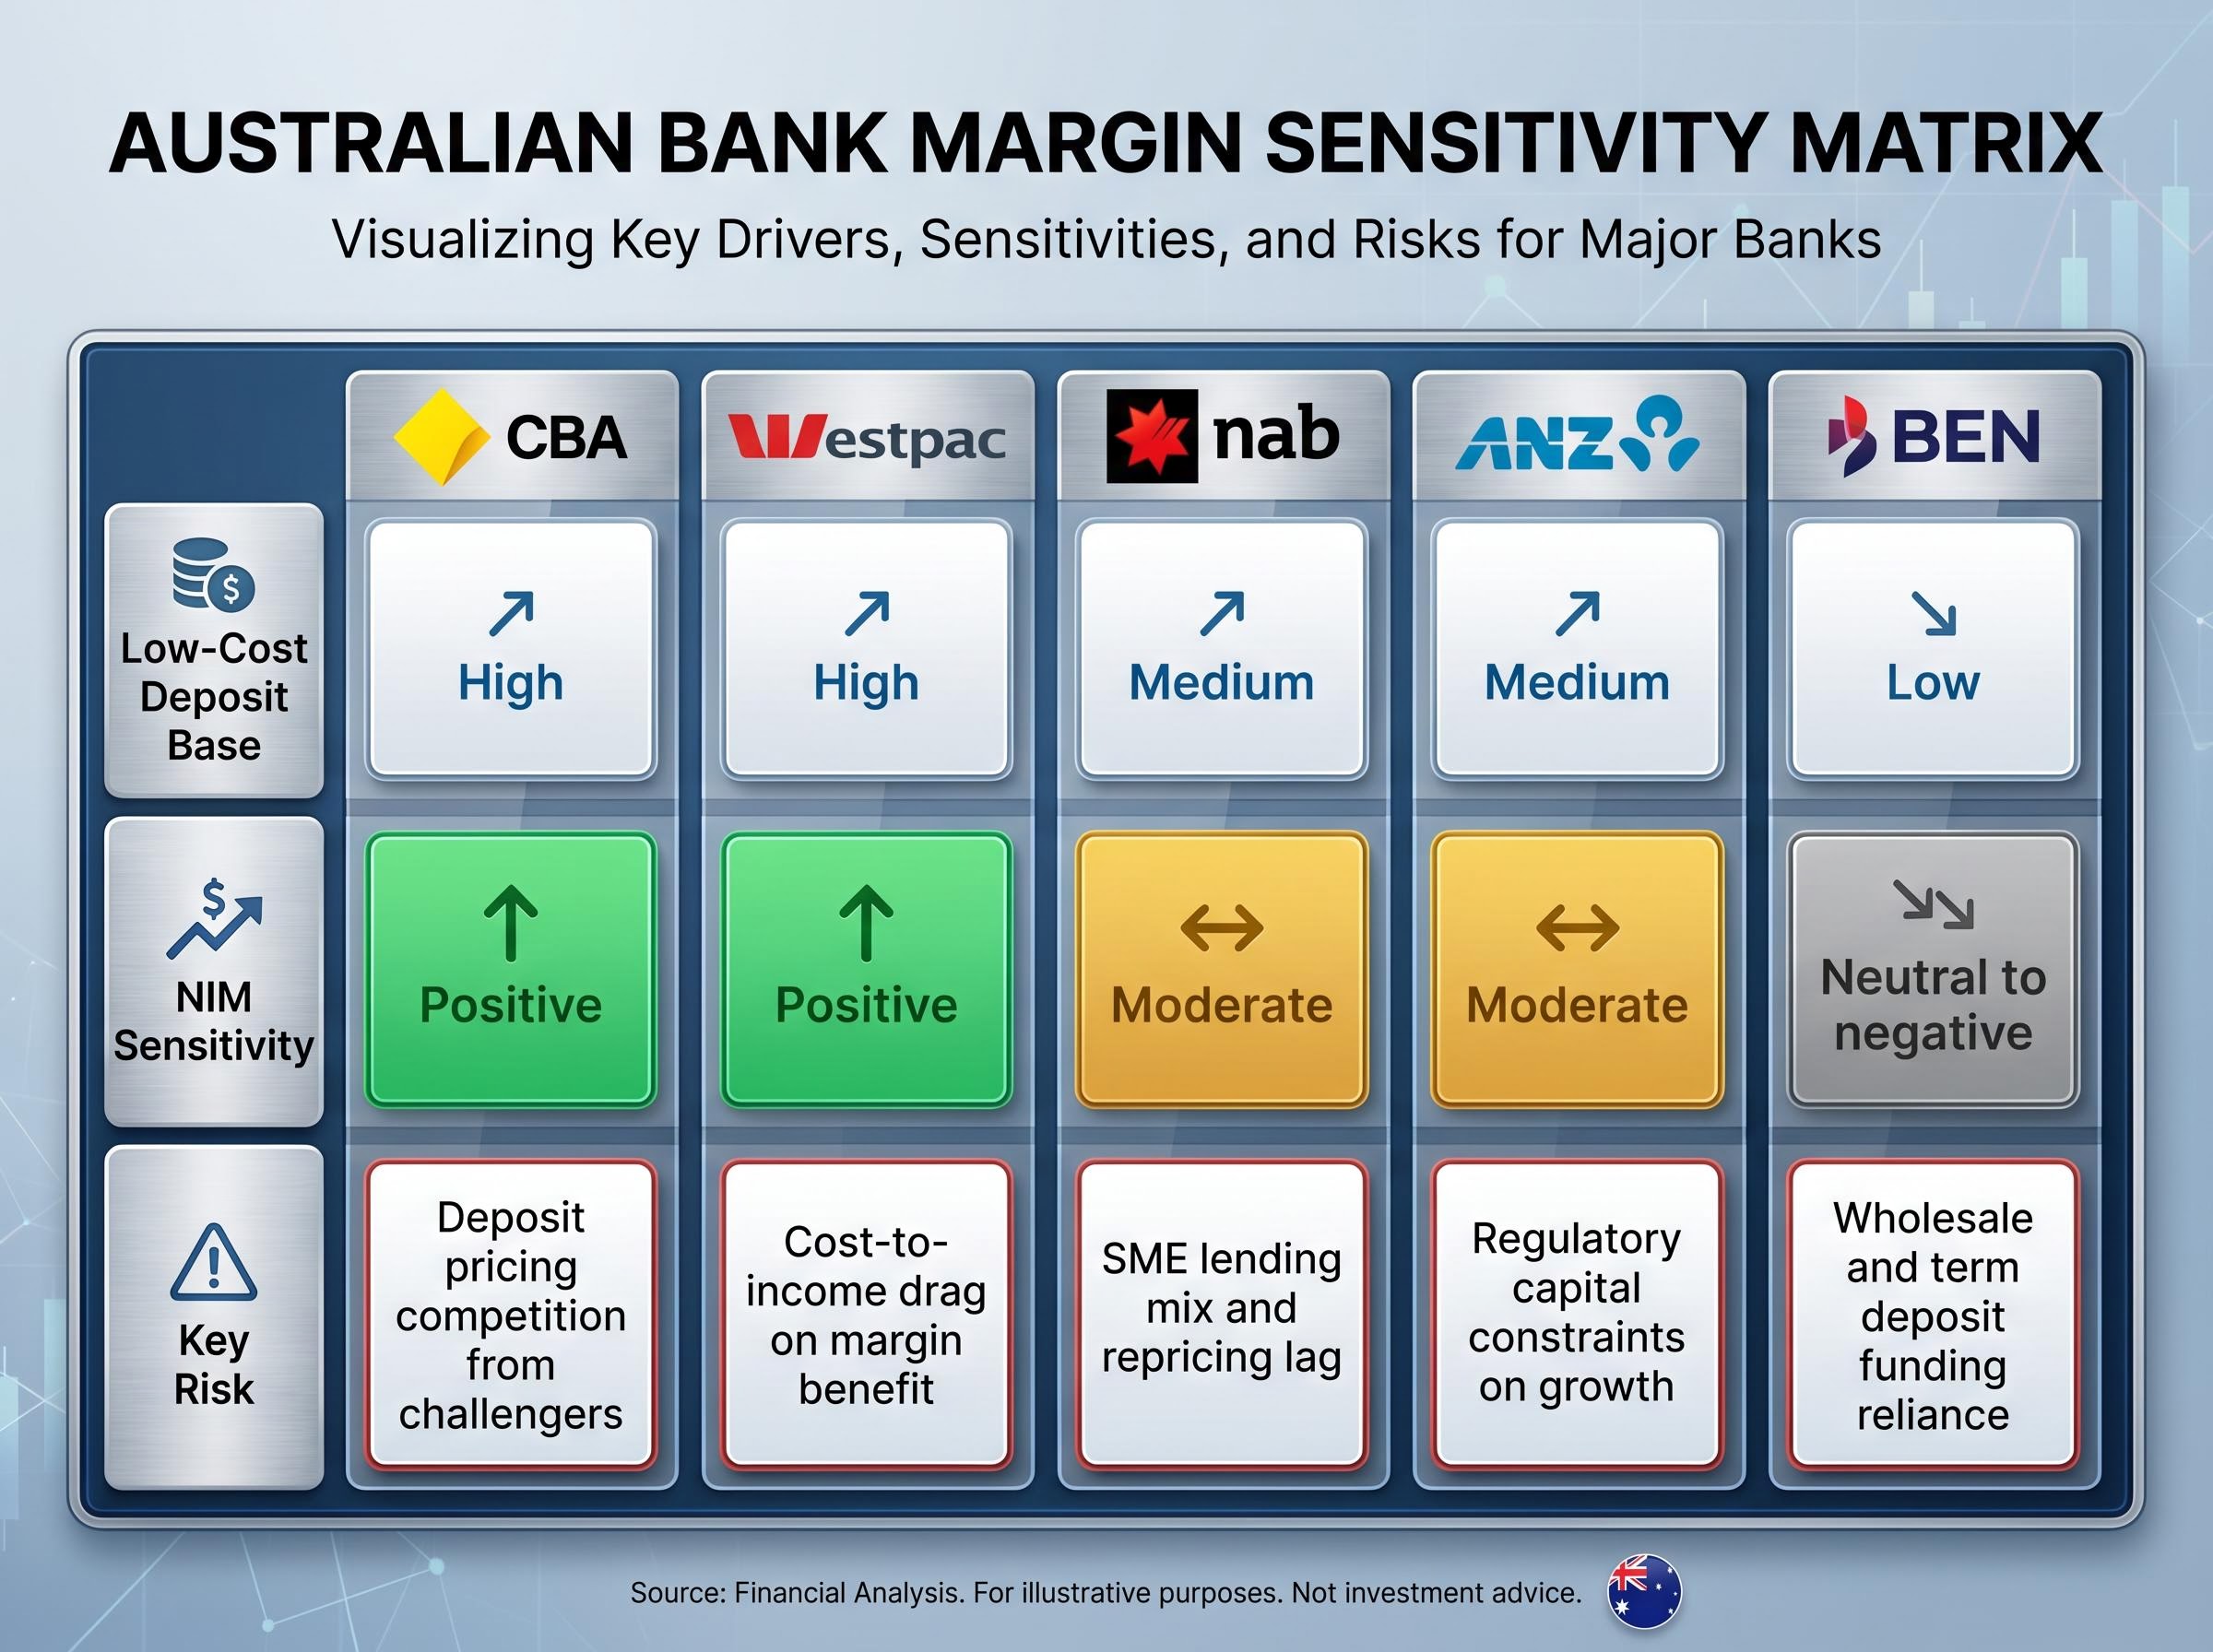
| Bank | Low-cost deposit base | NIM sensitivity | Key funding risk |
|---|---|---|---|
| CBA | High | Positive | Deposit pricing competition from challengers |
| Westpac | High | Positive | Cost-to-income drag on margin benefit |
| NAB | Medium | Moderate | SME lending mix and repricing lag |
| ANZ | Medium | Moderate | Regulatory capital constraints on growth |
| BEN | Low | Neutral to negative | Wholesale and term deposit funding reliance |
CBA and Westpac are structurally advantaged by large bases of low-cost transaction deposits, meaning rate rises flow more directly to margins. BEN, by contrast, relies more heavily on wholesale and term deposit funding, where competitive “deposit wars” can erode or eliminate the rate benefit entirely.
The qualitative NIM differentiators that separate winners from losers in any rate cycle include:
- Deposit mix: the proportion of zero- or low-interest transaction balances versus rate-sensitive term deposits
- Pricing competition intensity across mortgage and deposit products
- Loan book composition: the ability to reprice business lending versus retail mortgages
- RBA forward guidance interpretation: not just the current cash rate, but the term structure of rates and the spread between mortgage rates and wholesale funding costs
Two banks at identical PE multiples can have entirely different NIM sensitivities. That distinction is qualitative, not quantitative.
Reading the property market as a credit quality signal
A single CoreLogic headline, “house prices up 5%”, can mean opposite things for two different banks. For one concentrated in prime metropolitan owner-occupier mortgages, it reinforces asset quality. For another with heavy regional or SME property exposure, it may mask pockets of stress invisible in the aggregate number.
Capital city price growth showed mid-single-digit annual gains in Sydney and Melbourne through late 2025, while Brisbane, Adelaide, and Perth remained strong on tight supply and population growth. By early 2026, as the RBA shifted back to a hiking bias, analysts began noting slower housing turnover and price growth alongside greater refinancing pressure for leveraged borrowers.
APRA’s serviceability buffer rules, which require banks to assess whether borrowers can service loans at rates well above the current cash rate, have been supportive for asset quality in major bank books. Pre-payment buffers built during the 2020-2022 low-rate period continue to cushion major bank owner-occupier portfolios.
BEN presents a qualitatively different picture. Its regional concentration, including South Australian and regional Victorian property markets, exposes the bank to housing markets where liquidity and price depth differ materially from Sydney and Melbourne. Less access to cheap transactional deposit funding compounds this exposure.
Professional analysts use a specific set of data sources to form credit quality judgments:
- CoreLogic indices segmented by region and property type
- APRA housing data on LVRs, arrears, and interest-only versus principal-and-interest splits
- Auction clearance rates, which historically sit in the 60-70% range in up-cycles and ease when rates re-tighten
- Management overlays and commentary from results briefings
- Geographic and borrower segment segmentation within each bank’s loan book
Why management overlays matter as much as the raw arrears data
Under AASB 9, the accounting standard governing financial instruments, banks classify loans into three stages. Stage 1 loans are performing normally. Stage 2 loans have experienced a significant increase in credit risk since origination. Stage 3 loans are impaired. Movement from Stage 1 to Stage 2 is the early warning signal that professional analysts watch most closely, because it reveals management’s forward-looking assessment of credit deterioration before actual losses materialise.
Equally telling is whether management is adding or releasing overlays in expected credit loss (ECL) models. Overlays are discretionary provisions that sit above the model-generated output, reflecting management’s judgment about risks the model may not capture, such as cost-of-living pressures or the fixed-to-variable rate transition. Adding overlays signals conservatism and caution. Releasing them signals confidence, or sometimes a desire to smooth earnings. Professional analysts treat overlay movements as a qualitative signal of risk culture, not merely an accounting adjustment.
CBA’s Q3 2026 provision top-up of $200 million, announced alongside a 5.7% share price decline on 13 May 2026, is precisely the kind of management overlay signal this framework is designed to surface: arrears rose across every major consumer lending category in the same quarter, including a 30 basis point spike in personal loan arrears, while CBA’s CET1 ratio of 11.6% provided institutional resilience that individual borrower stress data did not.
What unemployment and consumer confidence tell you about future bad debts
Unemployment in late 2025 was approximately 4.1-4.3%, characterised by the RBA as slightly above the level consistent with full employment. Consumer confidence moderated through late 2025, then deteriorated materially in early 2026 following renewed RBA rate hikes combined with fuel price surges.
The aggregate unemployment rate, however, conceals very different risk profiles depending on which borrower cohorts a bank is exposed to.
“A 25 basis point rate hike adds approximately $90-100 per month to repayments on a $600,000 mortgage. Analysts explicitly warn that rising bad debts could quickly wipe out margin gains from higher rates.”
The borrower cohorts carrying the highest forward risk include:
- Outer-suburban and lower-income borrowers, where wage growth has lagged inflation and household buffers are thinnest
- High-LVR first-home buyers from the 2020-2022 cohort, who purchased near peak affordability stretch
- Borrowers transitioning from fixed to variable rates, facing repayment increases of 30-50% or more on expiry of low fixed-rate terms
NAB stands out among the Big Four. Its non-performing exposures reached 1.55% in late 2025, the highest of the group, driven primarily by SME stress. Whether rising bad debts erode the NIM benefit from higher rates depends on portfolio composition and management risk culture, both of which require qualitative judgment.
The language analysts listen for in CEO and CFO commentary during results briefings serves as a primary qualitative signal:
- Reassurance signals: “Arrears still low by historical standards, but trending up from trough levels”; “pre-payment buffers remain strong across the owner-occupier book.”
- Early warning signals: “We are seeing early signs of stress in lower-income segments”; “hardship arrangements and calls to collections have increased modestly.”
- Concern signals: “We’ve increased overlays for cost-of-living pressures and the transition from fixed to variable rates”; specific mention of geographic or cohort concentrations under stress.
A PE multiple on current earnings reveals nothing about whether a bank has built adequate overlays for a rising unemployment scenario. That judgment comes from reading the commentary, not the spreadsheet.
Morgans’ simultaneous sector-wide sell ratings on ASX bank shares in April 2026 illustrate how qualitative provisioning judgments translate into price targets: total Big Four provisions are forecast to rise from approximately $2.4 billion in FY25 to approximately $5.5 billion by FY27, a trajectory that no PE comparison on current earnings captures, and one that hinges entirely on the qualitative assessment of credit culture and borrower stress distribution that this framework describes.
Regulatory risk, governance, and ESG as valuation drivers
ANZ provides the clearest proof that qualitative factors move prices independently of earnings. APRA imposed a capital add-on of $1 billion due to risk management and governance concerns. ASIC levied a record penalty of $250 million. Together, these actions constrain ANZ’s capacity to return capital through dividends and buybacks and have driven a structural de-rating in the bank’s multiple.
No earnings model revision explains this discount. It is entirely a qualitative regulatory and governance judgment.
CBA, by contrast, trades at approximately 25x earnings versus a global bank peer average of approximately 10x. That premium reflects more than return on equity. It encodes investor trust in CBA’s technology leadership, deposit franchise strength, and years of consistent strategic execution and disciplined capital management.
| Bank | Key qualitative factor | Analyst stance (May 2026) | Primary driver |
|---|---|---|---|
| ANZ | APRA add-on, ASIC penalty | Avoid | Governance and regulatory overhang |
| CBA | Trust premium, execution quality | Hold | Stretched valuation, limited margin of safety |
| Westpac | UNITE programme execution | Buy | Cost-out potential under CEO Anthony Miller |
| NAB | SME credit quality | Neutral | Non-performing exposure trajectory |
APRA’s macroprudential debate adds a further layer. Possible debt-to-income caps and additional investor lending restrictions mean analysts assess each bank’s risk appetite and prior conduct to judge who would be most constrained if regulation tightens further.
APRA’s macroprudential policy framework sets out the conditions under which tools such as debt-to-income caps and serviceability buffers are deployed, giving analysts a basis for judging which banks would face the most binding constraints if tightening measures are reintroduced during the 2026 hiking cycle.
Institutional ESG screening is also shaping relative multiples. Banks are increasingly evaluated on fossil fuel lending exposure, TCFD disclosure quality, and alignment with Net Zero commitments. Banks with faster repositioning and more transparent climate disclosures attract a qualitative premium in some institutional allocation models, even when near-term earnings profiles differ little.
Technology execution as a qualitative swing factor
Westpac’s UNITE technology programme under CEO Anthony Miller (from December 2024) is the key qualitative swing factor for the bank’s re-rating case. If execution succeeds, driving cost-to-income ratio improvement and operational resilience, the valuation gap to CBA narrows. If it fails, the discount persists or widens.
Cybersecurity incidents and major outages factor into professional assessments even when not quantified in earnings. Reputational capital and potential remediation costs carry real weight in an environment where digital banking reliability is a competitive differentiator.
The next major ASX story will hit our subscribers first
The qualitative research has to come before the model, not after
Four real-world analyst decisions from 2025-2026 illustrate the pattern.
| Bank | Stance (May 2026) | Primary qualitative driver | Investment implication |
|---|---|---|---|
| Westpac | Buy | UNITE programme execution, CET1 ratio of 12.2%, cheaper multiple than CBA with similar rate exposure | Re-rating hinges on cost-out delivery, not an earnings model revision |
| CBA | Hold | ~25x earnings; priced for perfection with limited room for disappointment | Macro and valuation call, not a near-term EPS change |
| ANZ | Avoid | APRA capital add-on, ASIC penalty, governance concerns | Regulatory overhang and capital flexibility constraints drive the discount |
| NAB | Neutral | Non-performing exposures at 1.55%; SME stress in a rising rate environment | Wait for evidence NAB can navigate the 2026 hike cycle without a bad debt surge |
In each case, the analyst decision was driven by qualitative judgment, not by a specific revision to an earnings model. Westpac’s buy rating rests on management execution and capital strength. CBA’s hold reflects the qualitative risk of paying a premium multiple into macro uncertainty. ANZ’s avoid is entirely about regulatory and governance overhang. NAB’s neutral depends on portfolio credit quality in a tightening cycle.
The five categories of qualitative investigation that professional bank research memos address before the model section:
- Macro conditions and RBA trajectory: rate path, inflation, forward guidance, and the deposit and funding implications for each bank
- Housing and credit quality: property trends, arrears data, LVR distributions, Stage 2/3 migration, and management overlay movements
- Regulatory and governance: APRA and ASIC enforcement actions, macroprudential policy direction, board and management credibility
- ESG and climate: fossil fuel exposure, disclosure quality, Net Zero alignment, institutional screening criteria
- Technology, strategy, and management credibility: programme execution, cost-to-income trajectory, cybersecurity posture, strategic consistency
These categories are not a supplement to the model. They are the foundation on which credible model assumptions are built.
Qualitative analysis is not optional for ASX bank investors
The evidence from 2025-2026 is specific. ANZ’s regulatory de-rating did not appear in any DDM input. CBA’s 25x multiple encodes years of qualitative trust that no single-period ROE calculation can generate. NAB’s elevated non-performing exposures at 1.55% require judgment about SME stress distribution, not a formula. Westpac’s re-rating potential depends on whether Anthony Miller’s UNITE programme delivers, a call no spreadsheet can make.
Qualitative research does not replace valuation tools. It determines which assumptions deserve to go into them. A DDM range of $7.22 to $32.50 is not an answer; it is a question about which scenario is most credible. The analyst who has spent the hours reading management commentary, tracking APRA enforcement patterns, interpreting property data by region and segment, and evaluating deposit franchise strength is the one equipped to answer it.
Investors who build the habit of reading results briefing transcripts, APRA data releases, RBA guidance, and property trend reports will make better assumption choices when they sit down to run their models. The numbers matter. Knowing what to put into them matters more.
This article is for informational purposes only and should not be considered financial advice. Investors should conduct their own research and consult with financial professionals before making investment decisions.
Past performance does not guarantee future results. Financial projections are subject to market conditions and various risk factors.