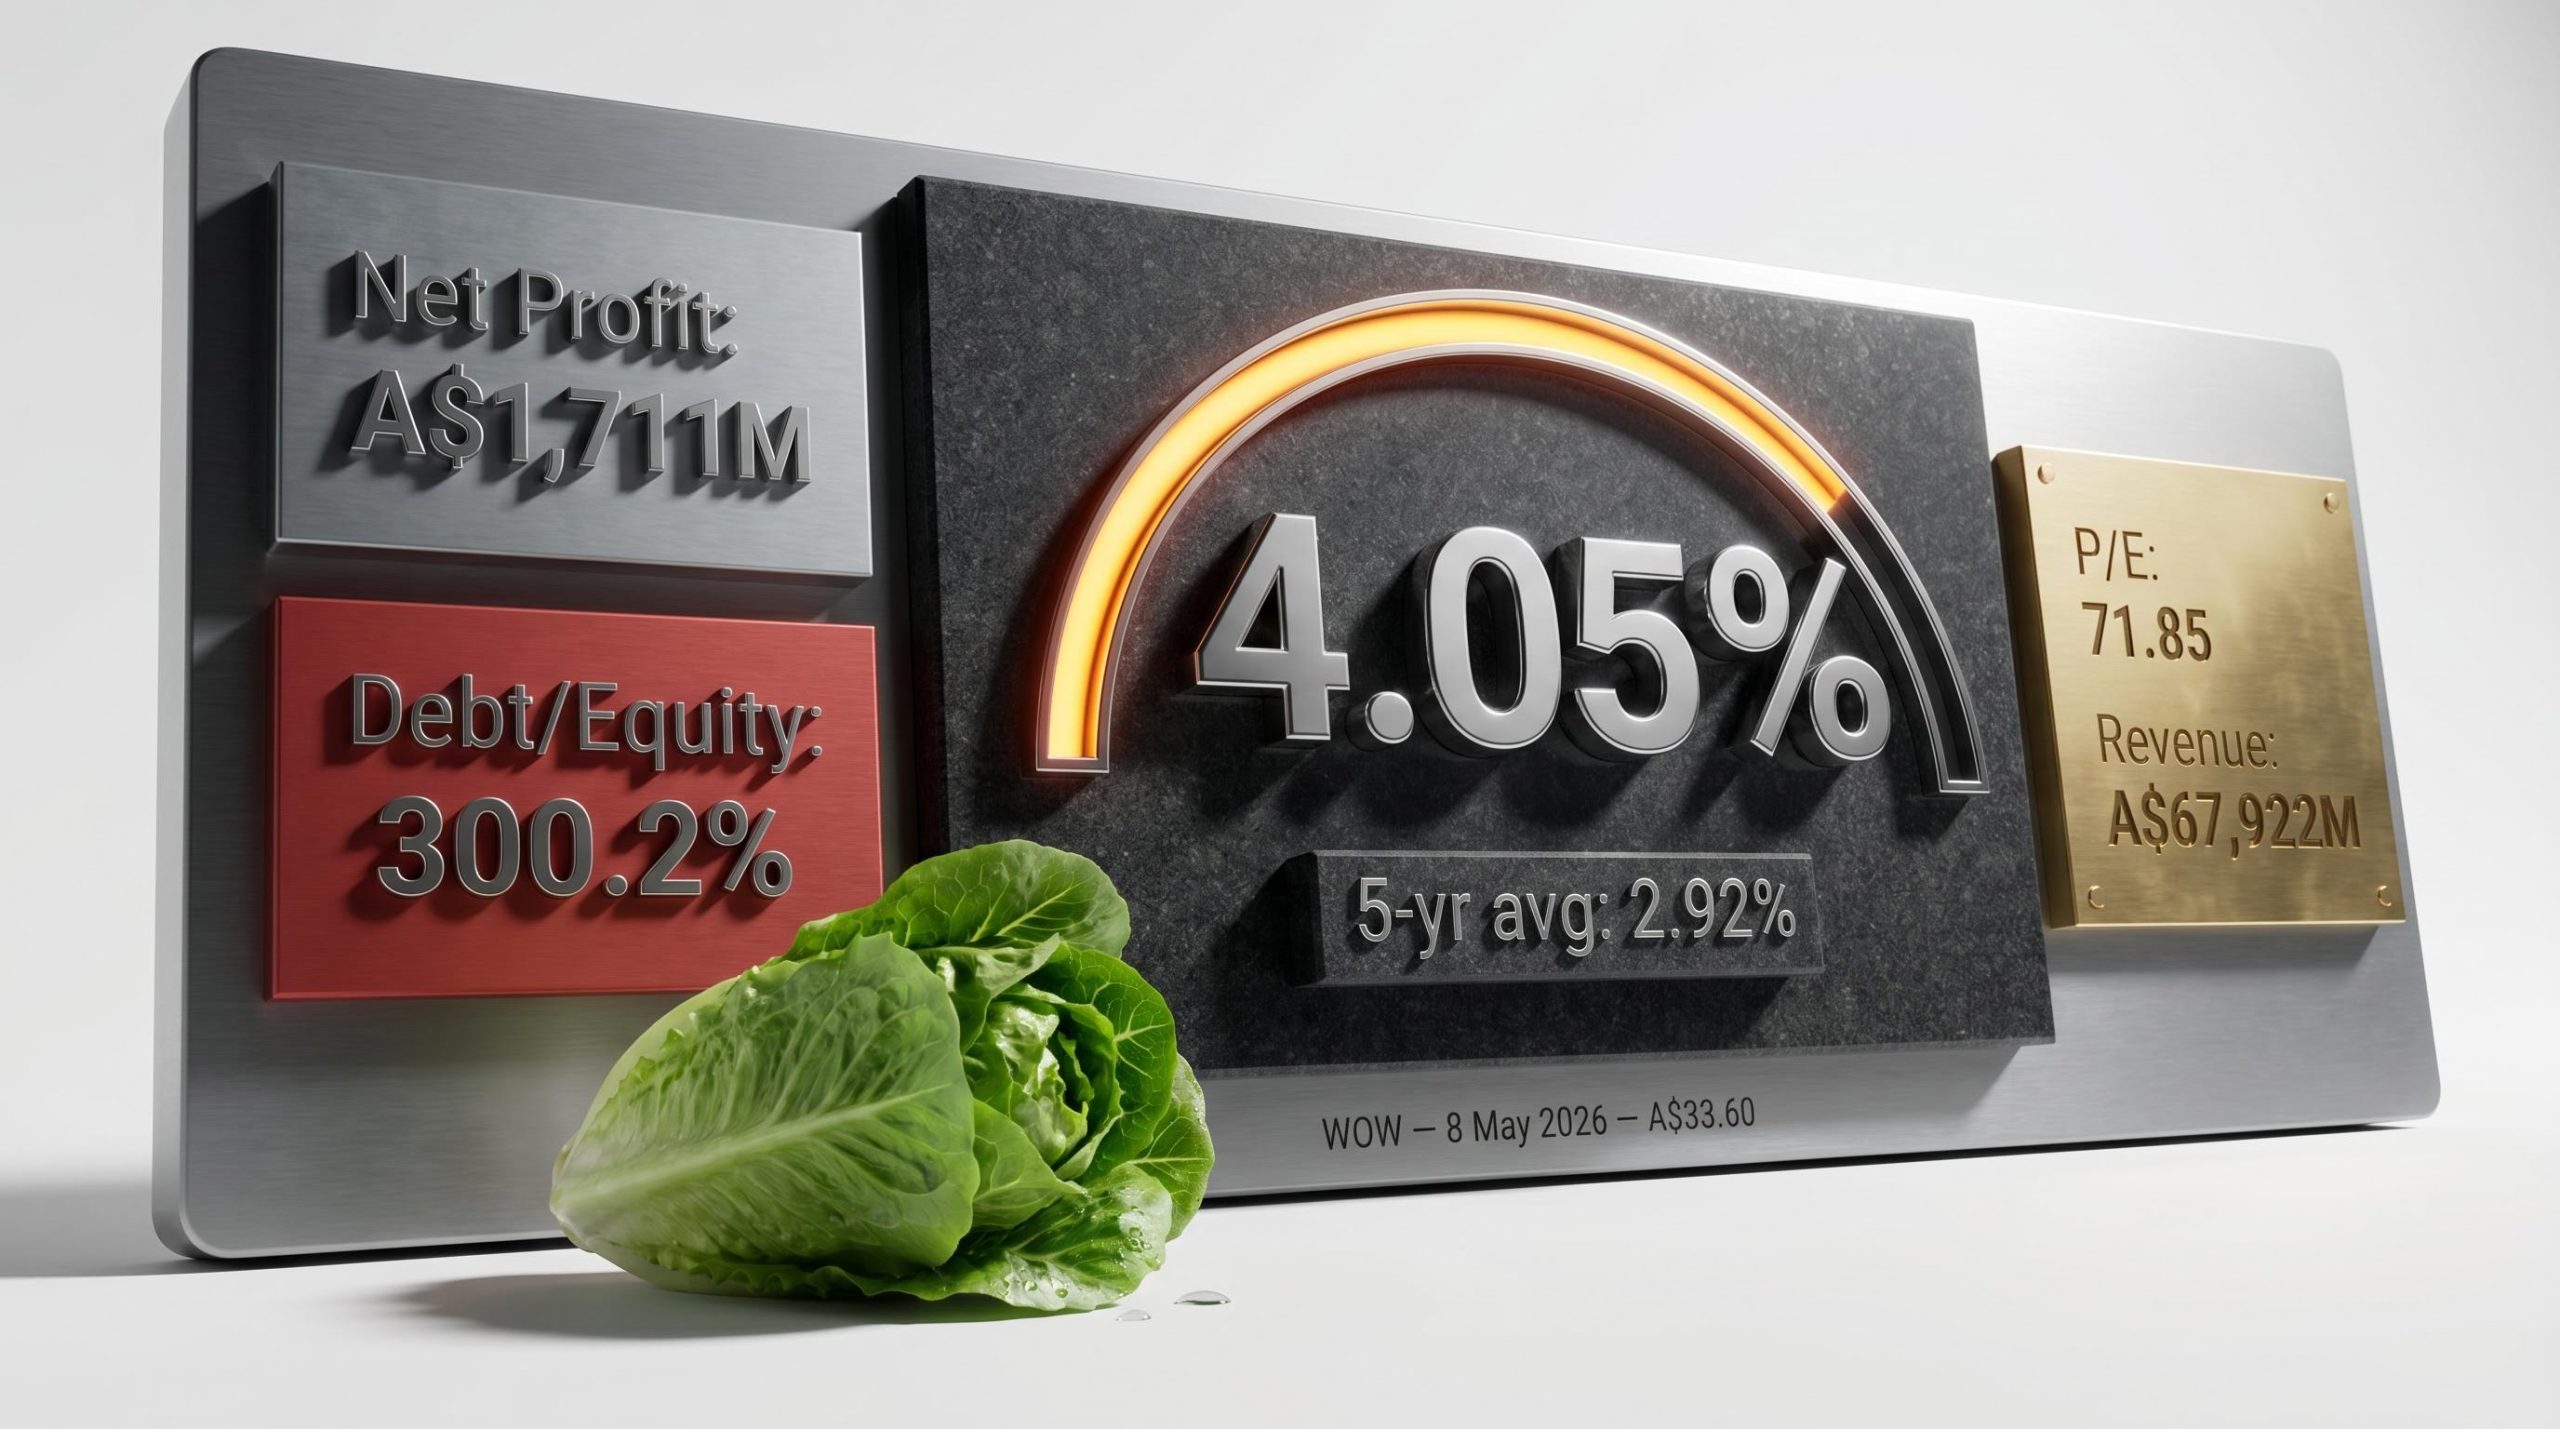
Woolworths pays a trailing dividend yield of approximately 4.05%, based on an implied annual dividend of A$1.36 per share at a share price of A$33.60 as of 8 May 2026. Against a five-year historical average yield of 2.92%, the gap looks like an income investor’s gift. It is not that simple. The elevated yield is partly the product of a share price weighed down by profit warnings, cost headwinds, and ongoing ACCC proceedings, not simply a more generous payout policy. For income-focused investors, that distinction determines whether the yield represents a genuine opportunity or a warning dressed as a reward. What follows is a framework for decoding what an elevated yield actually signals, using Woolworths as a live case study, so the analytical tools apply well beyond a single stock.
What the numbers actually show when WOW’s yield spikes above its five-year average
A casual scan of Woolworths’ yield might produce a straightforward conclusion: 4.05% on a defensive consumer staples stock, well above its 2.92% five-year average, looks attractive. The instinct to treat that gap as a buying signal is understandable. It is also incomplete.
Dividend yield is a ratio. It rises when either the annual dividend grows or the share price falls, or both happen simultaneously. Each scenario tells a different story about the company’s prospects.
Woolworths’ trailing yield: approximately 4.05% Five-year historical average: 2.92%
The most recent declared dividend of 45 cents per share (announced 25 February 2026) did exceed the three-year average dividend level, confirming genuine dividend growth. Yet the share price context matters just as much: WOW is up 12.06% year-to-date as of mid-May 2026, which means the stock is not in freefall. The yield expansion reflects a combination of both levers, not a single clean signal.
| Yield Driver | What It Signals |
|---|---|
| Dividend growth (payout rises) | Improving shareholder returns; potentially positive |
| Price decline (share price falls) | Market repricing risk; yield may be a warning |
| Both simultaneously | Ambiguous; requires earnings and balance sheet analysis to interpret |
The yield number itself is neutral. The analytical work begins with identifying which lever is doing most of the heavy lifting.
When big ASX news breaks, our subscribers know first
How dividend yield mechanics work and why a high number can be a warning, not a reward
The arithmetic is straightforward. Take Woolworths’ implied annual dividend of A$1.36, divide it by the A$33.60 share price, and the result is approximately 4.05%. That figure tells an investor what percentage of the current share price was returned as income over the trailing twelve months.
Where the arithmetic turns into a trap is when a rising yield reflects deteriorating business value rather than improved income prospects. If the share price falls because earnings are declining, the yield rises mechanically, but the total return (income plus capital) may still be negative. The investor captures the dividend while the portfolio value erodes beneath it. This dynamic, where an attractive yield masks weakening fundamentals, is the core risk income investors need to identify before committing capital.
The relationship between dividend yield and total return is where the income investing instinct most often goes wrong; research across more than 500 S&P 500 firms found that ex-dividend price drops average approximately 99.8% of the payout size, confirming that dividends transfer existing company value rather than create new wealth for shareholders.
Why fully franked dividends carry extra weight for Australian investors
Woolworths has a strong track record of paying fully franked dividends, which means the company has already paid corporate tax on the profits distributed. Eligible Australian investors can claim an imputation credit that offsets their personal tax liability, effectively boosting the after-tax return.
The grossing-up calculation works in three steps:
- Identify the franking credit: Divide the dividend by (1 minus the corporate tax rate), then subtract the dividend. For a A$1.36 fully franked dividend at a 30% corporate rate: A$1.36 / 0.70 = A$1.943, minus A$1.36 = A$0.583 franking credit.
- Calculate the grossed-up yield: Add the franking credit to the dividend (A$1.943 total), then divide by the share price. A$1.943 / A$33.60 = approximately 5.79%.
- Apply the investor’s marginal rate: The effective benefit varies. For self-managed super fund (SMSF) investors in pension phase, franking credits may be refunded in cash, making the effective yield higher than the stated rate.
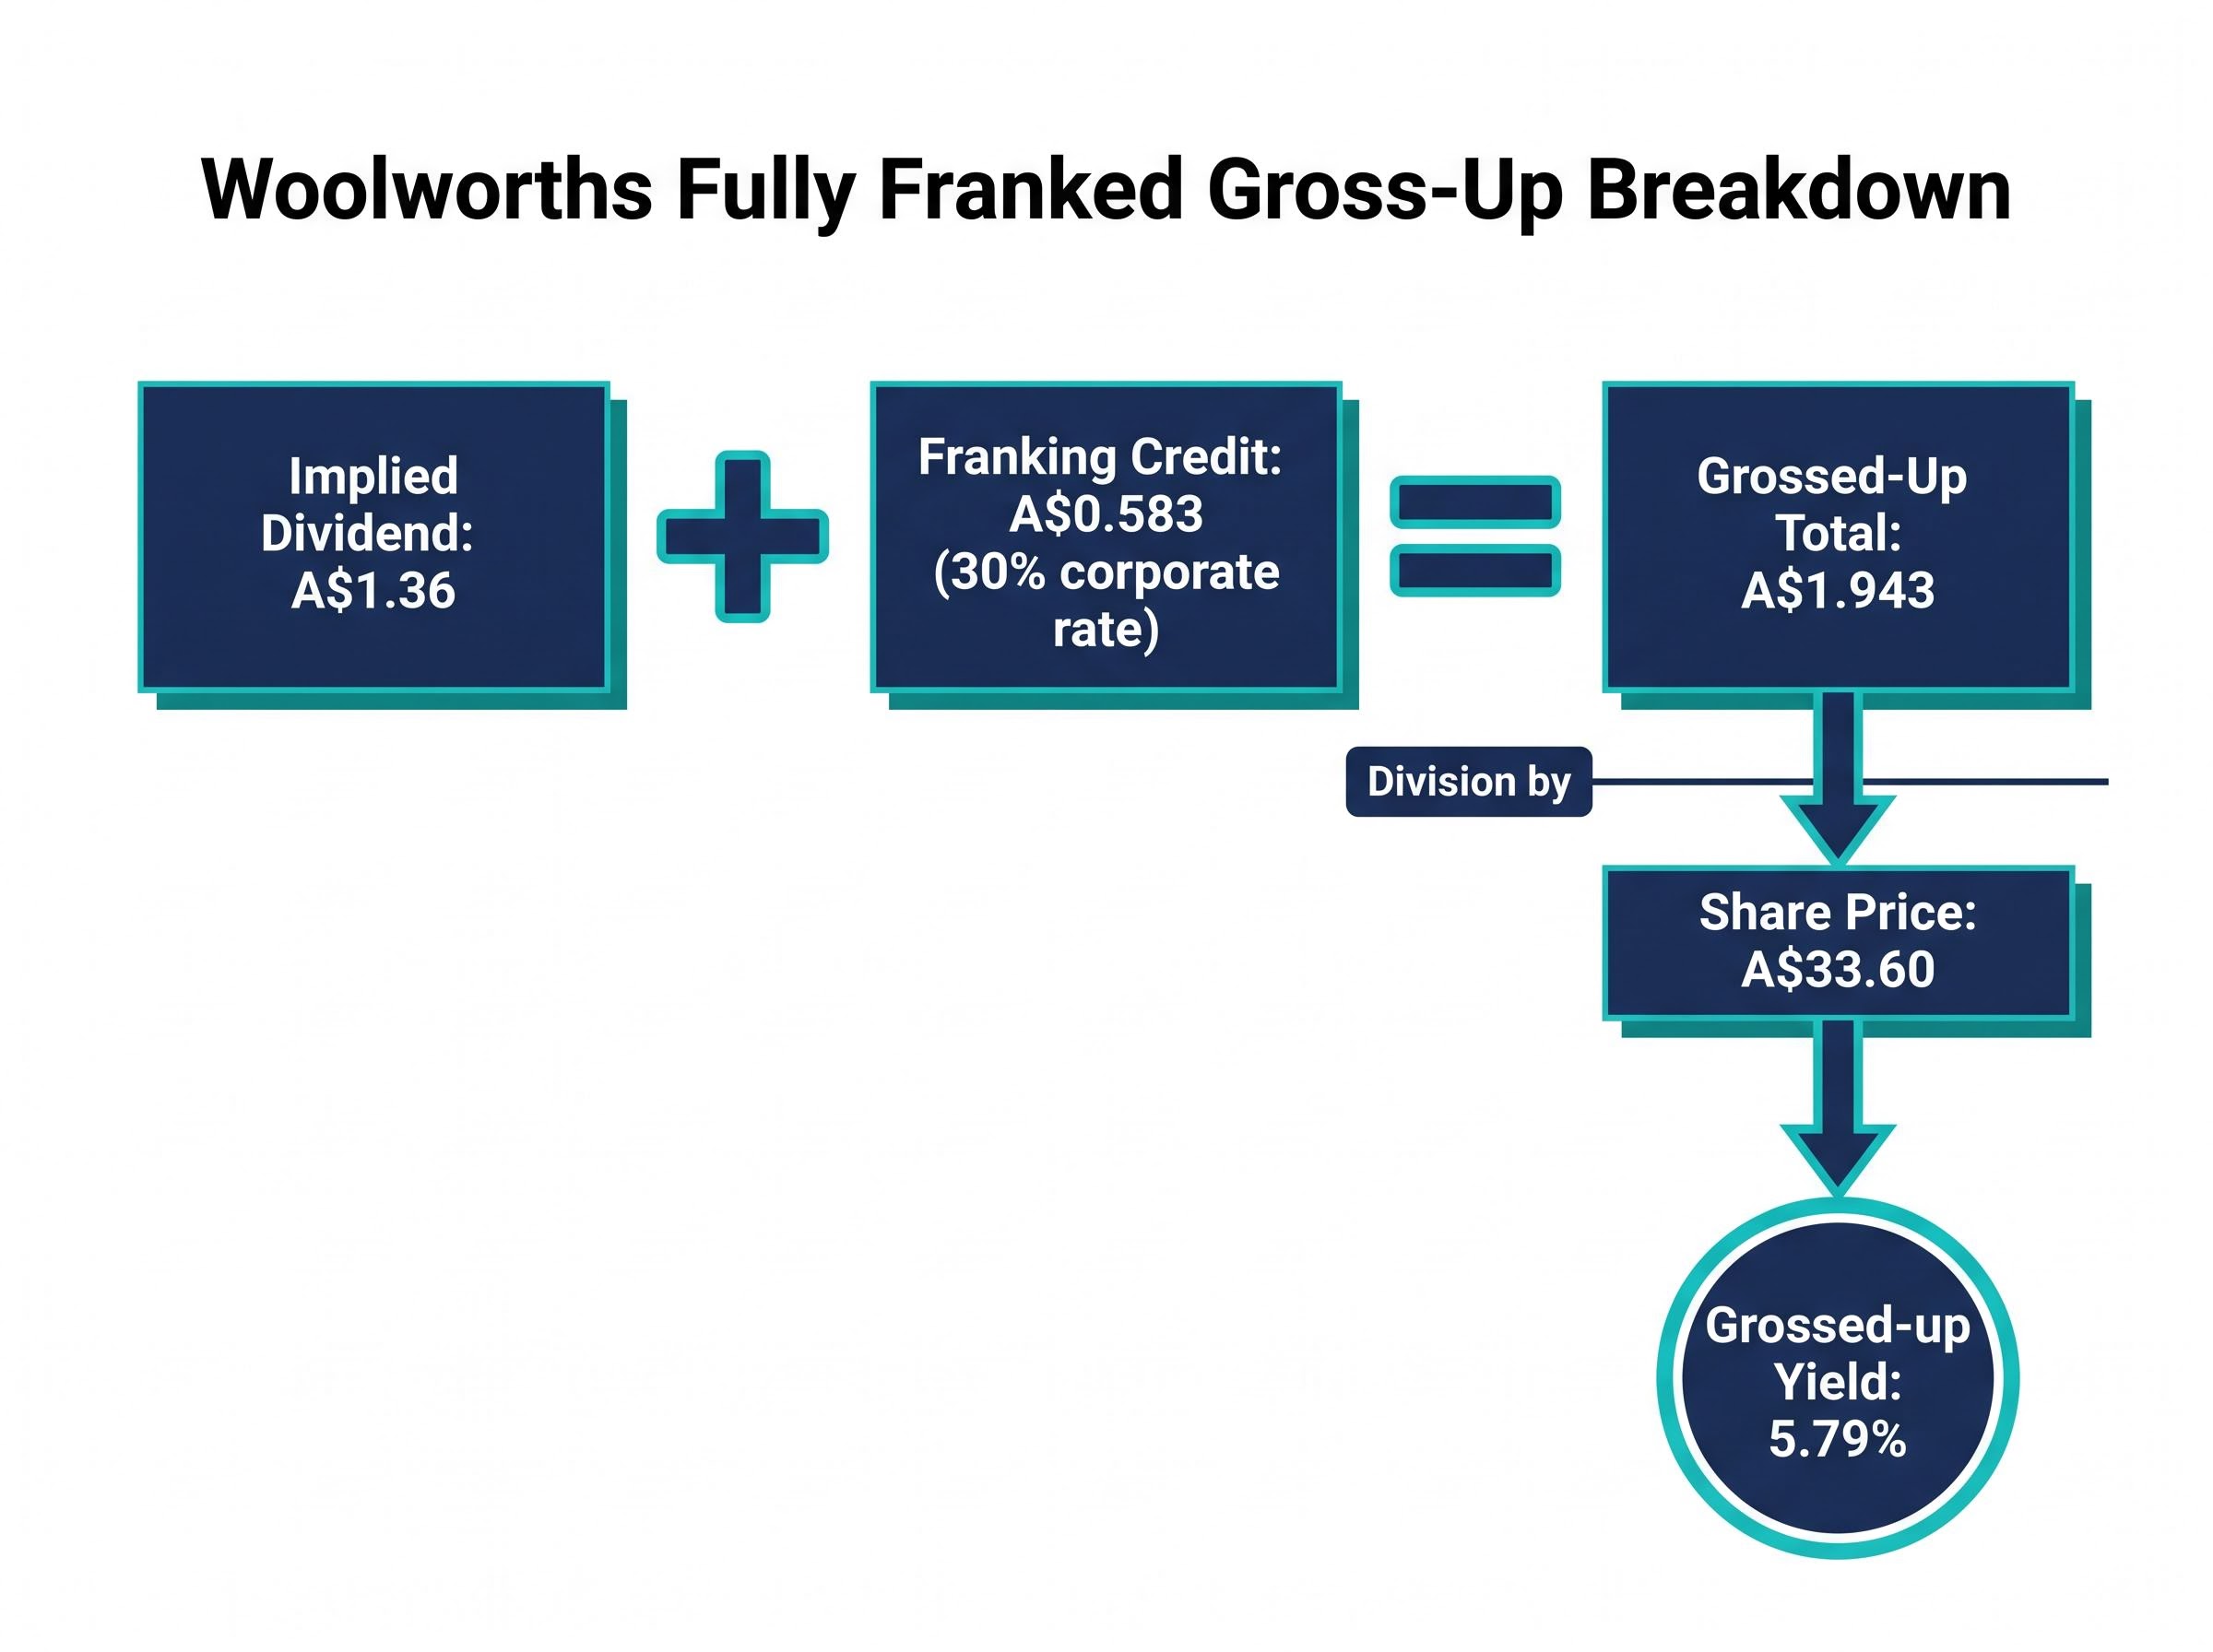
The 5.79% grossed-up figure applies specifically to investors in the 30% tax bracket. It is not universal, and treating it as a guaranteed return overstates the benefit for higher-rate taxpayers.
The case for the yield: why some investors see WOW’s income stream as genuinely attractive
Woolworths sells food. That single fact underpins much of the investment case for income investors. Grocery revenue is less cyclical than most ASX sectors; consumers cut discretionary spending before they cut food purchases, which provides a more stable earnings base for sustaining dividends through downturns.
The structural position reinforces this defensiveness:
- Market share: Over 35% of Australian grocery sales, giving Woolworths pricing influence and supplier leverage that smaller competitors cannot replicate.
- Network scale: More than 3,000 retail locations and over 100,000 employees create barriers to entry that protect long-run cash flows.
- Sector defensiveness: Consumer staples demand is non-discretionary, reducing revenue volatility relative to the broader ASX.
The income trajectory itself has been positive. The most recent annual dividend exceeded the three-year average payout, and revenue has compounded at 6.8% per annum over three years, reaching A$67,922 million in the most recently reported period. For investors focused on dividend growth rather than yield level alone, these figures represent a business that has been increasing its distributions while expanding its revenue base.
Dismissing the yield entirely would ignore these legitimate structural advantages. The question is whether the positives are sufficient to offset what the balance sheet and earnings trend reveal.
What the balance sheet and earnings trend reveal about dividend sustainability
Revenue has grown. Profit has not. That divergence is the single most important signal in Woolworths’ financials for income investors assessing dividend safety.
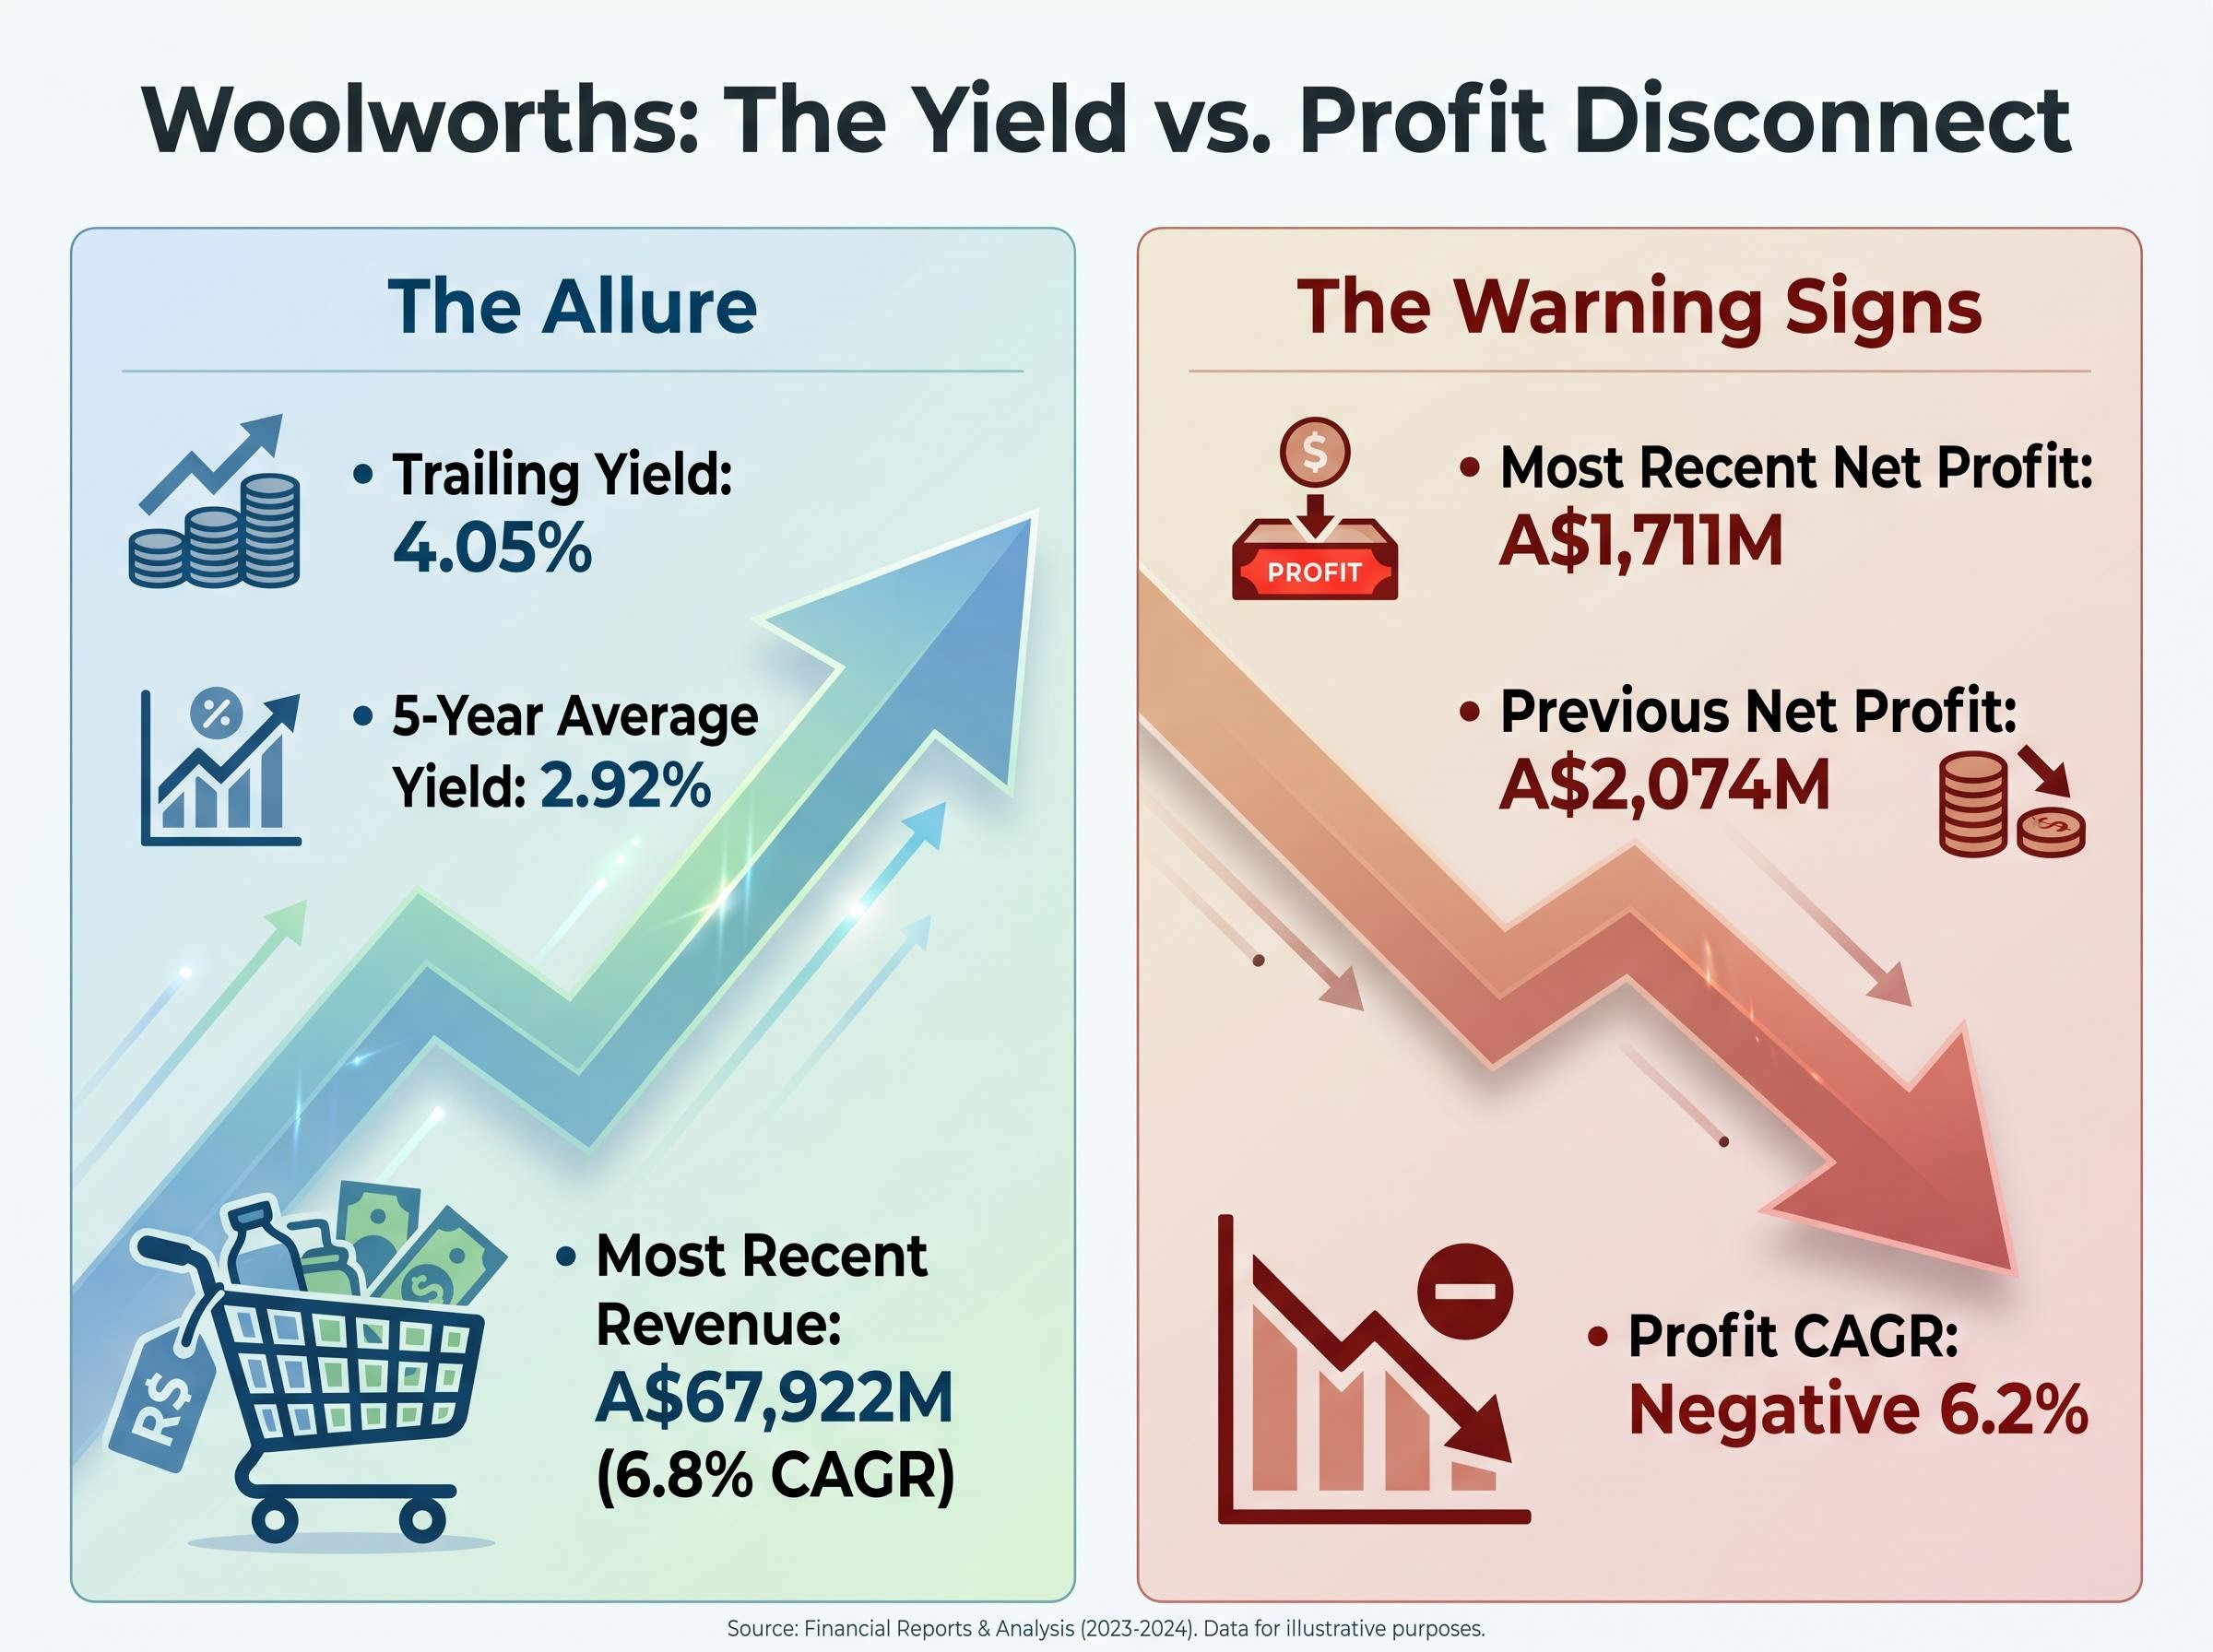
Profit CAGR over three years: negative 6.2%
Net profit fell from A$2,074 million three years prior to A$1,711 million in the most recent reporting period, even as revenue expanded. The gap between rising revenue and declining profit points to margin compression, the mechanism most likely to threaten future dividend payments if it persists.
ASX consumer staples underperformance over the prior five years, with the XSJ delivering -1.17% per annum against +4.21% for the broader ASX 200, provides the sector backdrop against which WOW’s individual profit decline needs to be read; the gap reflects persistent cost inflation, household trade-down behaviour, and regulatory pressure rather than a short-term earnings dip.
| Metric | Three Years Prior | Most Recent Year |
|---|---|---|
| Revenue | Lower base (pre-6.8% CAGR) | A$67,922M |
| Net Profit | A$2,074M | A$1,711M |
| Return on Equity | Higher (pre-decline) | 1.9% |
The balance sheet adds a second layer of concern. Net debt stands at A$15,424 million, producing a debt-to-equity ratio of 300.2%. Even for a business with stable cash flows, that level of leverage means rising interest costs consume a larger share of earnings, reducing the pool available for dividends.
A return on equity of 1.9% in FY24 reinforces the picture: the business is generating thin returns on the capital invested by shareholders. The price-to-earnings ratio of 71.85 (as of 29 April 2026) suggests the market is pricing Woolworths for an earnings recovery that has not yet materialised. If earnings per share continues to decline, the payout ratio expands even without a dividend cut, shrinking the margin of safety that income investors rely upon.
ACCC scrutiny and reputational risk as a compounding factor for income investors
The ACCC proceedings against Woolworths for alleged fake discounts and price hiking are not a separate headline risk. They are an amplifier of the margin and earnings pressures already visible in the financials.
Hearings concluded around 1-2 May 2026, with the outcome and any penalties still pending as of the date of publication. Potential fines would reduce earnings directly, but the deeper risk for income investors is sustained reputational damage in a market where consumer sentiment influences basket size, store traffic, and ultimately the revenue that funds dividends.
The ACCC supermarkets inquiry findings document the Commission’s basis for commencing Federal Court proceedings against Woolworths Group for allegedly misleading consumers through discount pricing claims, establishing the regulatory foundation that now sits as a contingent liability on the company’s income profile.
What the supplier “tsunami” comment signals about the cost and margin environment
During the Q3 FY2026 earnings call on 29 April 2026, management characterised the volume of supplier price rise requests as a “tsunami.” The phrasing is telling. It reveals the scale of wholesale cost pressures Woolworths is either absorbing or passing through to consumers.
If the company absorbs more of those costs to preserve consumer goodwill, particularly while under regulatory scrutiny for pricing practices, margins compress further. If it passes them through aggressively, it risks reinforcing the ACCC’s case and eroding customer loyalty. Either path puts additional pressure on the earnings base that funds the dividend. The regulatory and cost dynamics are not parallel risks; they interact, and that interaction narrows management’s room to protect both margins and the distribution simultaneously.
The next major ASX story will hit our subscribers first
Yield above 4% on an ASX defensive stock is a question, not an answer
The analytical framework that emerges from Woolworths’ situation applies to any elevated yield on the ASX. Before acting on a yield that sits materially above its historical average, income investors can apply four due-diligence questions:
The high-dividend safe haven narrative took a measurable hit in early 2026: the MSCI World High-Dividend Yield Index fell approximately 7.6% peak to trough while the broader index recovered to all-time highs, with high-yield holdings lagging the recovery and demonstrating that elevated yield screens are not a reliable substitute for earnings quality screens.
- Source identification: Is the yield elevated because the dividend grew, the share price fell, or both? In WOW’s case, both levers are at work, but the profit decline is the dominant concern.
- Earnings trajectory: Is the earnings trend supporting or eroding dividend coverage? A negative 6.2% profit CAGR over three years indicates declining coverage.
- Balance sheet capacity: Does the company have the financial flexibility to maintain dividends if earnings deteriorate further? A 300.2% debt-to-equity ratio limits that flexibility.
- Contingent risks: Are there pending regulatory, legal, or structural risks that could force management to redirect cash flow away from dividends? The ACCC case represents exactly this type of contingent liability.
Applied to Woolworths specifically: the dividend has grown, the franking benefits are genuine, and the defensive earnings profile is real. These are not trivial positives. Yet profit is declining, leverage is elevated, the P/E of 71.85 suggests the market is not pricing WOW as a distressed value opportunity, and the year-to-date share price gain of 12.06% has itself moderated the yield from what it might otherwise be.
For investors with long time horizons and high tolerance for the regulatory uncertainty, the fully franked income stream may remain appropriate. For those prioritising dividend safety and capital preservation, the risk profile warrants deeper valuation work using discounted cash flow or dividend discount models before committing capital.
Institutional investors including Morningstar Investment Management and Franklin Templeton have been building the contrarian case for beaten-down consumer staples since early 2026, treating the regulatory overhang and cost headwinds as cyclical rather than structural impairments and pointing to consumer staples price-to-earnings multiples near multi-year lows globally as a potential long-duration entry signal.
The framework matters more than the stock call
An elevated yield is a data point that begins analysis; it does not conclude it. Woolworths illustrates this principle in a tangible, current way: the 4.05% trailing yield against a 2.92% five-year average invites attention, but the earnings decline, balance sheet leverage, and regulatory proceedings complicate the income thesis meaningfully.
The fully franked dividends and the structural defensiveness of Australian grocery are legitimate attractions. They do not, on their own, resolve the question of whether the current payout level is sustainable.
The more durable takeaway is the framework itself. Applying the same yield-source, earnings-coverage, and balance-sheet analysis to other income holdings across an ASX portfolio may surface similar disconnects, or confirm that the yield signal is genuinely positive. The discipline of asking what produced the yield, rather than simply noting its level, is what separates informed income investing from chasing a number.
This article is for informational purposes only and should not be considered financial advice. Investors should conduct their own research and consult with financial professionals before making investment decisions. Past performance does not guarantee future results. Financial projections are subject to market conditions and various risk factors.