Why Buffett Only Needed 5 Great Opportunities in 60 Years
10 hrs ago

At a price-to-book ratio of roughly 2.8 times, Commonwealth Bank of Australia is priced as though nothing can go wrong. Whether that premium is justified depends on balance sheet signals most retail investors never examine.
ASX bank stocks sit at the centre of income portfolios across Australia, yet the metrics most commonly cited, share price, dividend yield, and price-to-earnings ratio, tell only part of the story. Behind those figures sits a balance sheet with its own language: loan impairment provisions, Common Equity Tier 1 (CET1) ratios, funding composition, and net interest margin (NIM) trends. In May 2026, with system-wide non-performing loans (NPLs) normalising upward and the post-Term Funding Facility (TFF) funding replacement still compressing margins, that language matters more than usual.
This guide equips retail investors with a practical analytical framework for reading ASX bank balance sheets, explains what each metric signals about risk and earnings quality, and applies that framework to CBA, ANZ, NAB, Westpac, and Macquarie with current figures.
A bank is not a manufacturer or a software company. Its core business is manufacturing risk: taking deposits, extending credit, and managing the spread between the two. That structural difference makes income statement metrics alone misleading.
Retail investors comfortable with ASX balance sheet fundamentals, including the assets-liabilities-equity equation, working capital ratios, and book value per share, will find those concepts translate directly into bank analysis, though banks require an additional layer of sector-specific metrics that general balance sheet guides do not cover.
Consider the PE ratio. It measures how much investors pay for each dollar of reported earnings. For a bank, reported earnings in any given year can be distorted by a single provision movement. If a bank releases $500 million in previously booked loan provisions because credit conditions improved, reported profit rises, the PE falls, and the stock looks cheap. Reverse the direction, a large forward-looking provision charge, and the PE spikes, making the stock look expensive. Neither snapshot tells an investor what the bank’s normalised earnings power actually is.
Here is what PE captures versus what it misses for bank stocks:
CBA trades at an implied PE of approximately 28.5 times FY24 earnings at its May 2026 share price, versus a sector average of approximately 18 times. A basic PE comparison implies a sector-adjusted estimated value of roughly $100 per share. The market pays $160.52. That gap is not irrational; it reflects the deposit franchise, the earnings stability, and the balance sheet quality that PE alone cannot measure.
A dividend discount model applied to CBA produces a sensitivity range of $52.89 to $238.00 depending on growth and discount rate assumptions, illustrating how model-dependent standard valuation outputs are for banks.
The P/B range across the Big 4 plus Macquarie currently spans 1.3 times to 2.8 times. Understanding why requires moving past the income statement and into the balance sheet itself.
Non-performing loans are loans where the borrower has either been classified as impaired or has fallen more than 90 days past due on scheduled repayments. The NPL ratio expresses these as a percentage of total gross loans and acceptances. It is the single most watched credit quality indicator in bank reporting.
The number itself, however, is almost meaningless without context. System-wide NPLs sat at approximately 0.9% in December 2024 and have since normalised upward to approximately 1.1-1.2% by early 2026. That rise sounds alarming in isolation. In practice, it represents a return toward mid-cycle norms from the unsustainably low levels that followed the COVID-era government support programmes. Historically, NPLs for Australian majors spike above 1% in stress periods; genuine crisis thresholds sit closer to 1.5-2% or higher. The current trajectory is normalisation, not deterioration.
The RBA Financial Stability Review published in April 2025 documented that mortgage arrears had risen modestly to levels consistent with pre-GFC norms, providing the institutional anchor for interpreting the current 1.1-1.2% system-wide NPL trajectory as normalisation rather than the early stage of a credit deterioration cycle.
What matters alongside the NPL ratio is how well the bank has provisioned against potential losses. Provisions come in two forms:
The provision coverage ratio, total provisions as a percentage of credit risk-weighted assets, signals how much buffer sits between a bank’s current loan quality and its earnings.
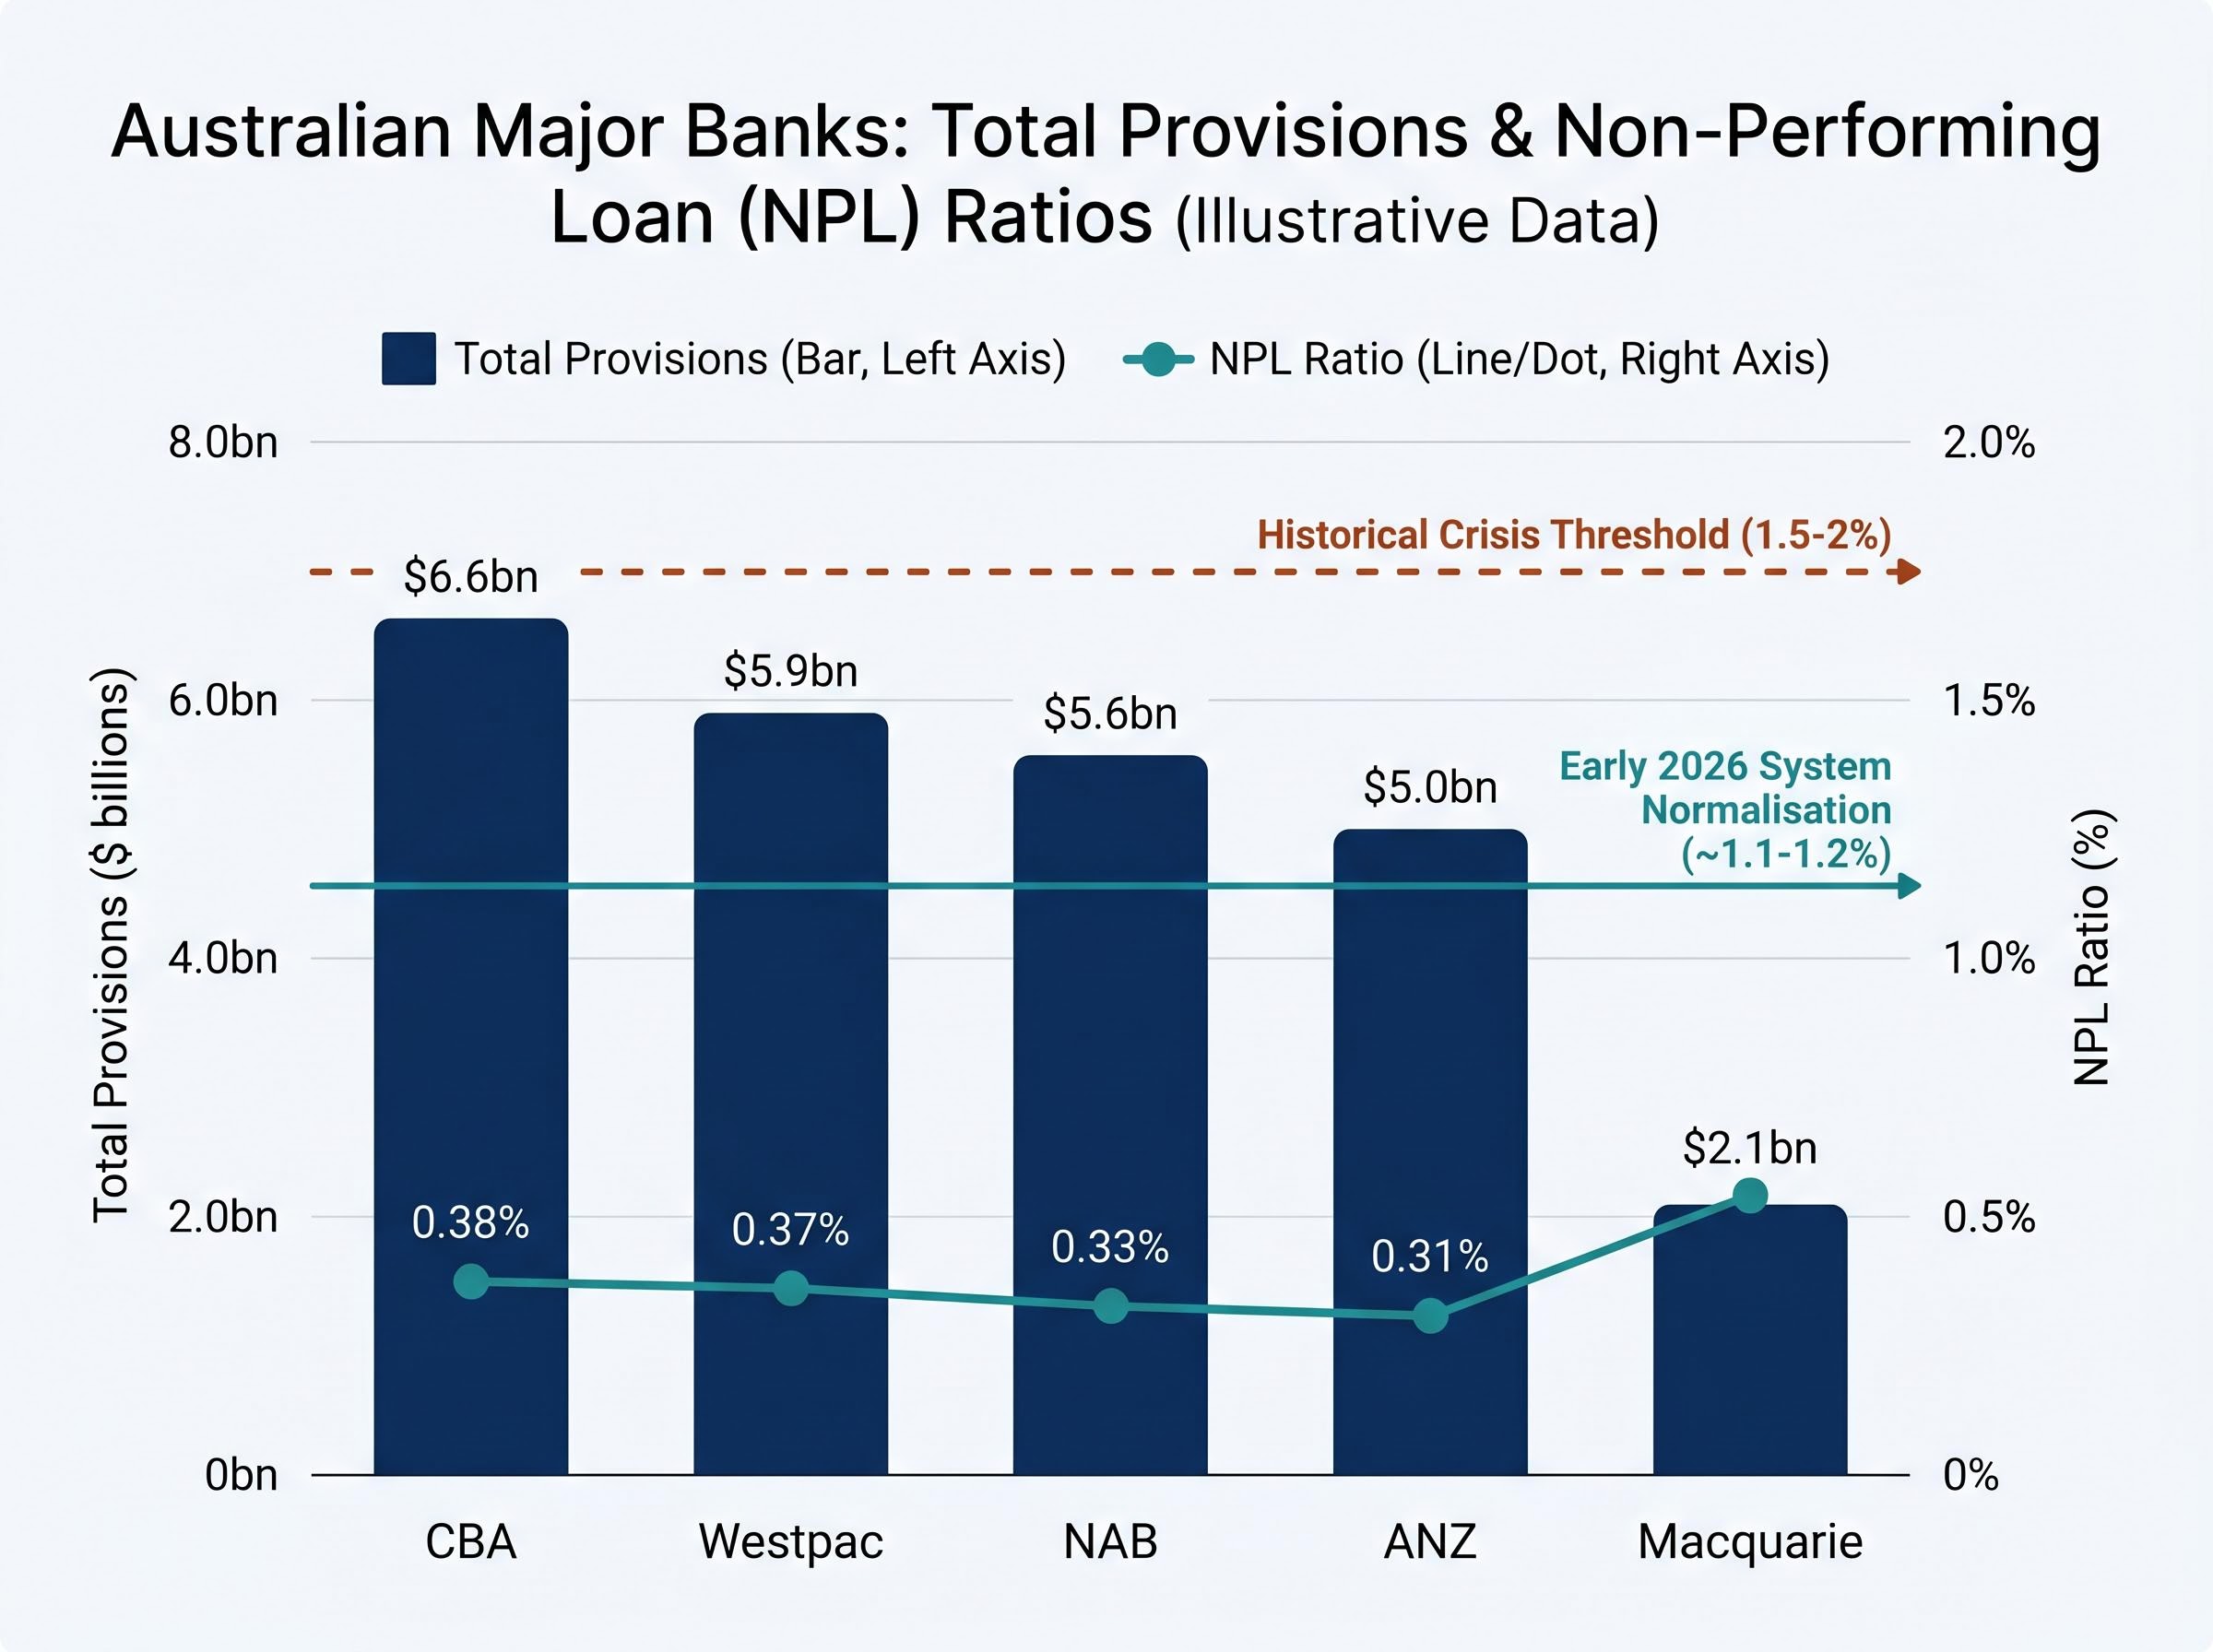
| Bank | NPL Ratio (approx.) | Total Provisions | Key Portfolio Exposure |
|---|---|---|---|
| CBA | ~0.38% | ~$6.5-6.7bn | Largest mortgage book; retail-oriented |
| ANZ | ~0.30-0.32% | ~$5.0bn | NZ mortgage concentration; Australian SME |
| NAB | ~0.30-0.35% | ~$5.5-5.7bn | SME and commercial property lending |
| Westpac | ~0.35-0.40% | ~$5.8-6.0bn | Large home-loan book; mortgage arrears focus |
| Macquarie | ~0.50-0.60% | ~$2.0-2.2bn | Structured credit; global corporate and commodity exposures |
Loan portfolio composition shapes where risk concentrates. CBA and Westpac carry larger mortgage books, making them more sensitive to household stress. NAB holds more SME and commercial property exposure. ANZ carries New Zealand mortgage concentration. Macquarie is exposed to structured credit and global corporate lending, meaning its NPL movements track global macro conditions rather than Australian housing.
A rising NPL ratio that sits at 0.38% is almost meaningless without that benchmark. The interpretive range, mid-cycle norms versus crisis thresholds, is what separates reading bank results from merely collecting them.
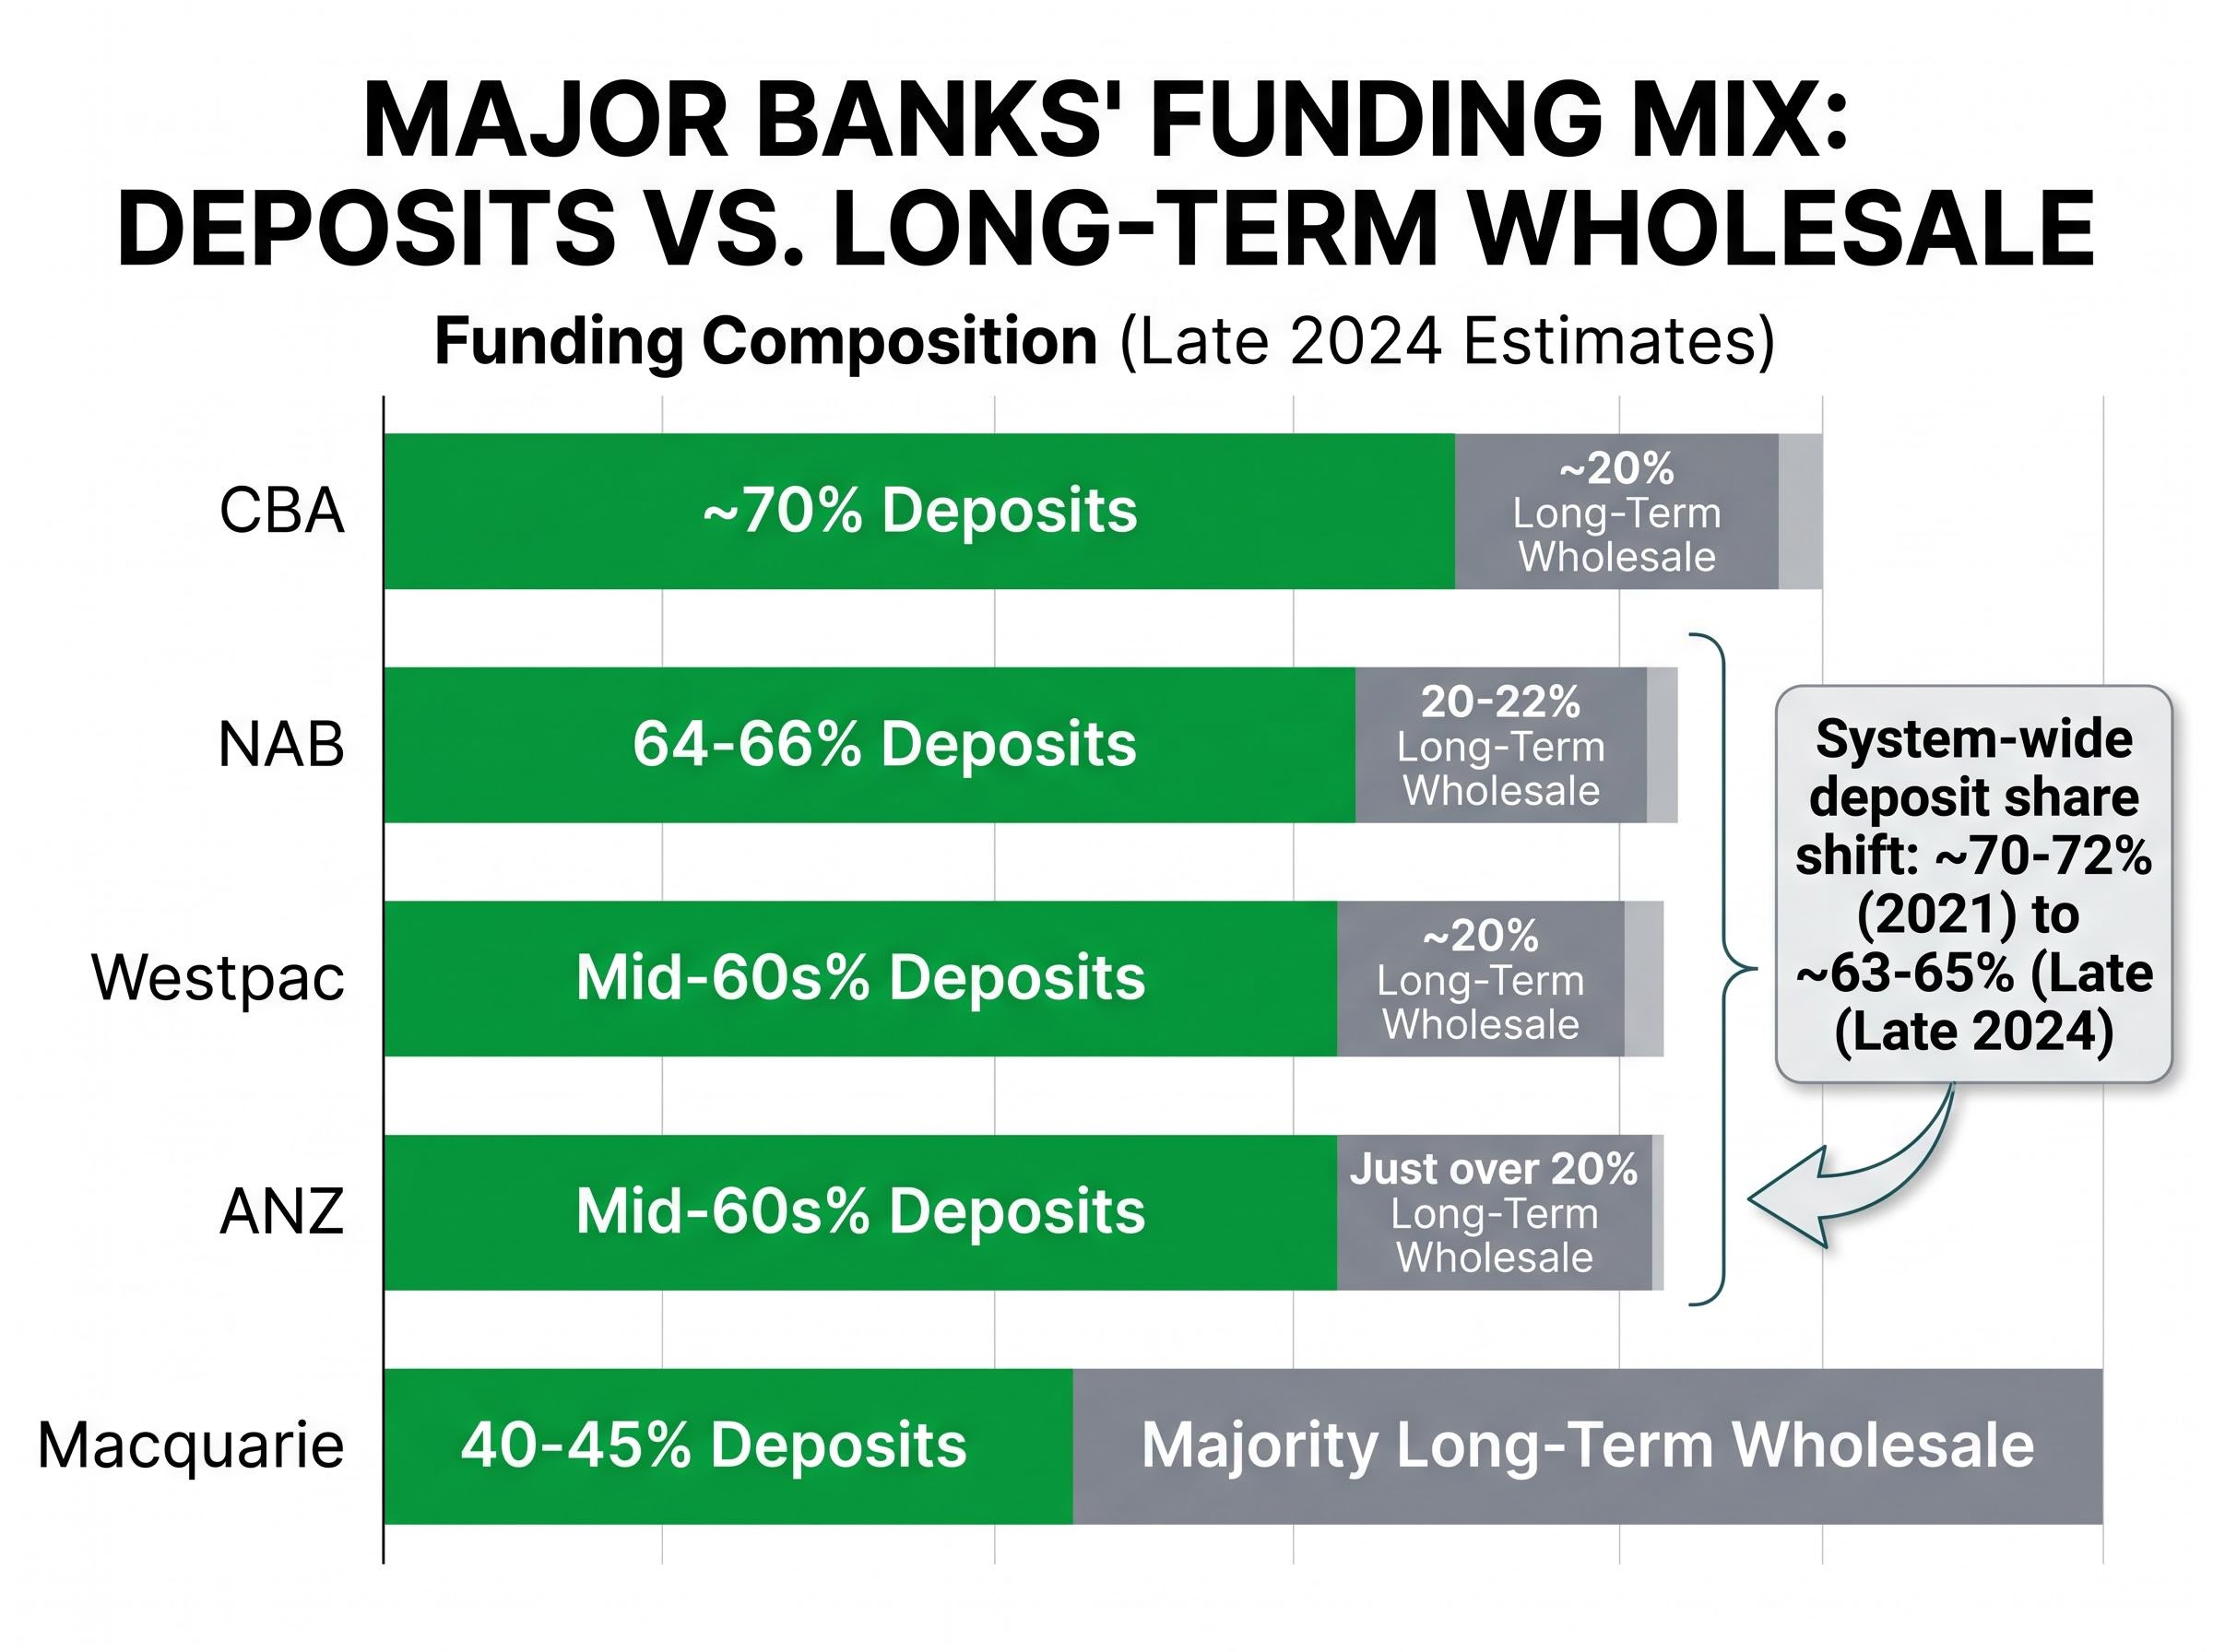
Every dollar a bank lends has to come from somewhere. The cheapest, most stable source is customer deposits: savings accounts, term deposits, and transaction balances. The alternative is wholesale debt, borrowed from institutional markets domestically or offshore, typically at higher cost and with greater sensitivity to shifts in market sentiment.
The difference matters because it feeds directly into margins. A bank funding 70% of its lending from customer deposits pays less for that capital, and pays it more predictably, than a bank funding 45% from deposits and the remainder from term wholesale debt, structured notes, and secured funding vehicles.
System-wide, deposit share peaked at approximately 70-72% across the majors in 2021 and eased to approximately 63-65% by late 2024, driven primarily by the rolloff of the RBA’s Term Funding Facility.
That decline illustrates the mechanism. During COVID, banks drew heavily on the RBA’s TFF, a programme providing cheap three-year central bank funding. As the TFF matured through 2023-2024, banks refinanced it with more expensive term wholesale debt. All major banks explicitly attributed part of their NIM compression in FY24 and FY25 results to this transition. The funding mix changed; earnings followed.
Offshore wholesale debt introduces three specific risk dimensions:
The 2023 Silicon Valley Bank and Credit Suisse episodes demonstrated this concretely. Wider wholesale funding spreads affected Macquarie and ANZ more than CBA or Westpac. APRA and the RBA publicly stressed Australian banks’ strong Net Stable Funding Ratio (NSFR) and Liquidity Coverage Ratio (LCR) positions, but the episode underscored the differential exposure embedded in funding composition. Cross-currency basis spread widening in late 2023 and mid-2024 appeared as specific headwinds in ANZ and Macquarie results commentary.
| Bank | Deposit Share | Long-Term Wholesale | Key Funding Risk | NIM (approx. current) |
|---|---|---|---|---|
| CBA | ~70% | ~20% | Lowest wholesale reliance; most retail-oriented | ~2.0% |
| ANZ | Mid-60s% | Just over 20% | More offshore wholesale; USD/EUR hedging costs | ~1.65% |
| NAB | 64-66% | 20-22% | Corporate/SME deposits less sticky than household | ~1.75% |
| Westpac | Mid-60s% | ~20% | NZ operations add some wholesale reliance | ~1.85% |
| Macquarie | 40-45% | Majority | Structurally high wholesale and capital markets reliance | ~2.1% |
Macquarie’s 40-45% deposit share versus CBA’s approximately 70% is a single figure that tells an investor more about earnings cyclicality risk than a year’s worth of price charts.
The Australian Prudential Regulation Authority (APRA) requires banks to hold capital and liquidity well above minimum thresholds. The system is well capitalised. The four majors’ CET1 ratios sit in the 11-12.5% range on an APRA basis, comfortably above the minimum of approximately 10.25-10.75% including Domestic Systemically Important Bank (D-SIB) buffers. NAB specifically reported 11.65% as of March 2026.
CET1 ratio measures a bank’s highest-quality capital, ordinary shares and retained earnings, expressed as a percentage of risk-weighted assets. APRA’s “unquestionably strong” benchmark means Australian majors hold capital buffers that place them among the best-capitalised banking systems globally.
Two liquidity metrics complement capital adequacy. The Liquidity Coverage Ratio (LCR) measures whether a bank holds enough high-quality liquid assets to survive a 30-day severe stress scenario. Major banks typically report LCRs in the 130-150% range, well above the 100% minimum. The Net Stable Funding Ratio (NSFR) measures whether longer-term assets are funded by appropriately stable sources. Majors typically report 115-125%, above the 100% minimum.
| Metric | Minimum Requirement | Major Bank Range (approx.) | What It Measures |
|---|---|---|---|
| CET1 | ~10.25-10.75% | 11-12.5% | Highest-quality capital as % of risk-weighted assets |
| LCR | 100% | 130-150% | Liquid asset buffer to survive 30-day stress |
| NSFR | 100% | 115-125% | Structural funding stability for longer-term assets |
One counterintuitive dynamic is worth noting: the shift toward more term wholesale debt since 2023 has actually improved NSFR ratios, because term debt counts as “stable” funding, even as it compressed NIM. Different metrics can point in opposite directions, which is precisely why reading them together matters.
Strong headline capital ratios are the baseline. What separates investors who read balance sheets from those who merely collect ratios is knowing what APRA is flagging in its supervision commentary. Four areas stand out in 2024-2026 guidance:
These are best understood as questions investors should be asking of each bank’s results commentary rather than as settled risks. Is this bank’s mortgage book stress-tested against the scenarios APRA is flagging? Has management updated its commercial property provisioning overlays? The questions matter more than today’s snapshot ratios.
Price-to-book ratio is the core bank valuation metric for a reason. Book value, for a bank, represents the net asset value of the balance sheet: total assets minus total liabilities. When a bank trades at a P/B consistently above 2.0 times, the market is pricing in an expectation that the bank will generate sustained above-average returns on equity (ROE), returns high enough to justify paying more than twice the accounting value of the institution’s net assets.
The conditions that justify a P/B above 2.0 times are specific:
CBA’s premium at approximately 2.8 times P/B reflects its deposit franchise strength and earnings stability. Westpac’s discount at approximately 1.3 times reflects its ongoing turnaround narrative and legacy risk-governance concerns, even as its provisioning stance has strengthened. Macquarie’s approximately 2.5 times is partly benchmarked against global investment bank peers rather than domestic retail banks, reflecting its capital-light asset management and higher-growth commodities businesses.
| Bank | P/E (approx.) | P/B (approx.) | Dividend Yield (approx.) | Payout Ratio (approx.) |
|---|---|---|---|---|
| CBA | ~20.5x | ~2.8x | ~3.5% | ~75% |
| ANZ | ~15.2x | ~1.4x | ~4.2% | ~65% |
| NAB | ~16.0x | ~1.6x | ~4.0% | ~70% |
| Westpac | ~14.8x | ~1.3x | ~4.5% | ~72% |
| Macquarie | ~18.5x | ~2.5x | ~3.0% | ~50% |
Approximate figures as of May 2026.
The sector-adjusted PE calculation sharpens the picture. CBA reported earnings per share of $5.63 in FY24. Applying the sector PE of approximately 18 times implies a value of roughly $100 per share, versus a market price of approximately $160.52. The premium is real and it embeds an assumption.
Dividend sustainability adds another dimension. A payout ratio above 75-80% leaves less buffer for dividend maintenance if credit charges rise. ANZ’s approximately 65% payout ratio represents a genuine financial flexibility advantage relative to CBA’s approximately 75%: more room to absorb higher credit charges without cutting the dividend.
A premium valuation embeds an assumption about credit conditions remaining benign and funding costs remaining manageable. If either deteriorates, the re-rating risk is asymmetric on the downside: there is more room for a premium to compress than for a discount to widen further.
A P/B of 1.3 times is not automatically cheap if the underlying balance sheet carries unresolved risk. A P/B of 2.8 times is not automatically expensive if the earnings quality and funding franchise justify it. The framework built across the preceding sections is what allows investors to interrogate these multiples rather than treating them as buy or sell signals in isolation.
For investors wanting to build a quantitative valuation model rather than read multiples comparatively, our full explainer on bank stock valuation using NIM, ROE and CET1 walks through a complete Dividend Discount Model with verified figures from Bank of Queensland’s FY2025 results, including a franking-adjusted fair value calculation that is fully portable to the major banks.
The analytical layers covered in this guide, loan quality, provision coverage, funding composition, capital buffers, and valuation assumptions, compress into six specific questions. Working through them before each results season provides a structured basis for comparing disclosures across banks and for identifying when a result is genuinely stronger or weaker than headline earnings suggest.
Credit impairment disclosures made before official results season, such as NAB’s April 2026 announcement of a $706 million charge linked to agriculture, transport, and manufacturing stress, are among the most information-rich signals investors can receive, provided they can distinguish a forward-looking risk provision from a one-off transaction cost.
Three source types provide the raw material for this checklist:
APRA’s Quarterly ADI Statistics publish aggregate and entity-level data on capital adequacy, asset quality, and liquidity for all authorised deposit-taking institutions, providing the system-wide benchmarks that make individual bank figures meaningful when assessing whether a given NPL ratio or CET1 level sits above or below the sector norm.
Share price and dividend yield are outcomes. The balance sheet signals covered in this guide, loan quality, provision coverage, funding composition, capital adequacy, and the assumptions embedded in valuation multiples, are the drivers.
No single metric is definitive. A bank can show an elevated NPL ratio alongside strong capital, adequate provisions, and a conservative funding model. That is a very different risk profile than elevated NPLs combined with thin provisions and high wholesale reliance. The value of this framework is in reading signals together.
With system-wide NPLs normalising and funding costs still elevated relative to the TFF era, 2026 is a year where balance sheet quality will differentiate results more than it did in the benign conditions of 2021-2022. The next major bank results announcement is an opportunity to apply this checklist, test the framework, and build the analytical habit that separates informed positioning from price-chart conviction.
For investors wanting to apply the P/B and mortgage book concentration framework to a specific policy scenario, our dedicated guide to negative gearing reform and bank valuations explains how the 2026 Federal Budget changes transmit through housing credit growth, bank earnings revisions, and the differential de-rating risk across CBA, NAB, Westpac, and ANZ.
This article is for informational purposes only and should not be considered financial advice. Investors should conduct their own research and consult with financial professionals before making investment decisions. Past performance does not guarantee future results. Financial projections are subject to market conditions and various risk factors.
The price-to-book (P/B) ratio compares a bank's market price to the net asset value of its balance sheet, and it is the core bank valuation metric because it reveals whether investors are paying a premium for superior earnings quality, deposit franchise strength, and return on equity relative to peers. A P/B consistently above 2.0 times signals the market expects sustained above-average returns on equity across credit cycles.
Focus on the non-performing loan (NPL) ratio, which expresses impaired or 90-plus-day-past-due loans as a percentage of total gross loans, and pair it with the provision coverage ratio to assess how much buffer the bank holds against potential losses. Context matters: Australian majors currently sit in the 0.30-0.60% NPL range, which represents normalisation rather than crisis, given that genuine stress thresholds historically sit closer to 1.5-2% or higher.
Deposit share measures what proportion of a bank's lending is funded by stable, low-cost customer deposits rather than more expensive and volatile wholesale debt markets. CBA's approximately 70% deposit share compared to Macquarie's 40-45% means CBA faces far less earnings cyclicality risk from wholesale funding cost spikes or global market stress events.
Common Equity Tier 1 (CET1) measures a bank's highest-quality capital, ordinary shares and retained earnings, as a percentage of risk-weighted assets, and APRA requires major banks to hold approximately 10.25-10.75% including D-SIB buffers. Australia's Big 4 currently sit in the 11-12.5% range, providing a meaningful buffer above minimums that supports both dividend capacity and stress resilience.
The three key sources are each bank's APS 330 Pillar 3 report published alongside results, APRA's Quarterly ADI Performance publication for system-wide benchmarks, and each bank's results presentation investor supplement for management commentary and portfolio breakdowns. These are all publicly available and provide the granular credit quality, capital, and funding composition data needed to apply a full bank balance sheet framework.