
What Loss Aversion Is Costing Your Portfolio Every Year
1 hr ago

At a share price of roughly $6.25, Bank of Queensland’s (ASX: BOQ) fully franked dividend of 34 cents per share looks modest on paper. Factor in the franking credits attached to that payout, however, and the grossed-up yield jumps to nearly 7%. The question is whether that yield justifies the price, and that is precisely what the Dividend Discount Model is built to answer.
Australian bank shares are among the most widely held equities in the country, yet most retail investors evaluate them using only the headline dividend yield. The DDM goes further, translating a dividend stream and a growth assumption into an explicit estimate of what a share is theoretically worth today. For fully franked bank stocks, the model carries a particular advantage: franking credits alter the effective yield in ways that can shift the implied valuation meaningfully.
What follows is a step-by-step DDM walkthrough using BOQ as a live case study. It covers how to incorporate franking credits into the calculation, builds a sensitivity table across a range of assumptions, and explains why averaging across scenarios produces a more defensible estimate than relying on any single output.
The DDM values a stock by discounting its future dividend payments back to the present. That means it works best when dividends are stable, predictable, and large relative to earnings. Australian banks tick all three boxes.
The dividend discount model has roots stretching back to 1938, when economist John Burr Williams formalised the idea that a stock’s true worth is simply the sum of its future income payments discounted to the present, a principle that remains embedded in the CFA Institute curriculum and institutional equity research today.
A stock is well suited to the DDM when it has:
BOQ, Bendigo and Adelaide Bank (ASX: BEN), and the four major banks all fit this profile. Their dividends are frequently 100% fully franked, and their payout ratios tend to sit well above those of growth-oriented sectors.
Bendigo and Adelaide Bank offers a useful comparison point: applying the same DDM framework to BEN’s FY2026 fully franked dividend shifts the implied value from approximately $9.27 on a cash basis to $13.24 once franking credits are incorporated, a proportionally similar adjustment to what the BOQ analysis produces.
None of this makes the DDM a precision instrument. It is one of several valuation tools and works best alongside price-to-earnings multiples and price-to-book comparisons rather than in isolation. Analysts typically layer more than 100 hours of qualitative work on top of any financial model before forming a view. The DDM gives that work a quantitative starting point, not a final answer.
Every DDM calculation rests on three inputs, and every output is only as trustworthy as the assumptions behind them.
The relationship between the growth rate and the discount rate is where the model becomes sensitive. Narrow the gap between the two, and the implied valuation climbs sharply. Widen it, and the valuation compresses just as fast. A single percentage point shift in either input can move the fair value estimate by dollars, not cents.
The RBA cash rate target serves as the standard risk-free rate proxy when constructing a discount rate for Australian equity valuations, meaning any shift in the cash rate feeds directly into the denominator of the DDM formula and alters every cell in the sensitivity table.
DDM outputs are a function of assumptions, not facts. The model is a structured way to make your assumptions explicit, not a device for eliminating uncertainty.
That sensitivity is the central reason the worked example later in this article uses a range of scenarios rather than a single estimate.
For Australian resident investors, the DDM has an extra layer. When a company pays a fully franked dividend, it has already paid 30% corporate tax on the profits funding that payout. Eligible investors receive a franking credit for that tax, effectively grossing up the dividend they receive.
The formula is straightforward:
Grossed-up yield = Cash yield ÷ (1 − 0.30)
Applied to BOQ’s 34-cent fully franked dividend, the gross dividend comes to approximately 48-49 cents per share (34 ÷ 0.70). That is roughly 44% more income flowing into the model.
The effect on valuation is substantial. Using the DDM with averaged assumptions across the 6-11% discount rate and 2-4% growth rate ranges, the cash-dividend-based estimate comes to approximately $7.19. Substituting the grossed-up dividend lifts the estimate to approximately $10.57.
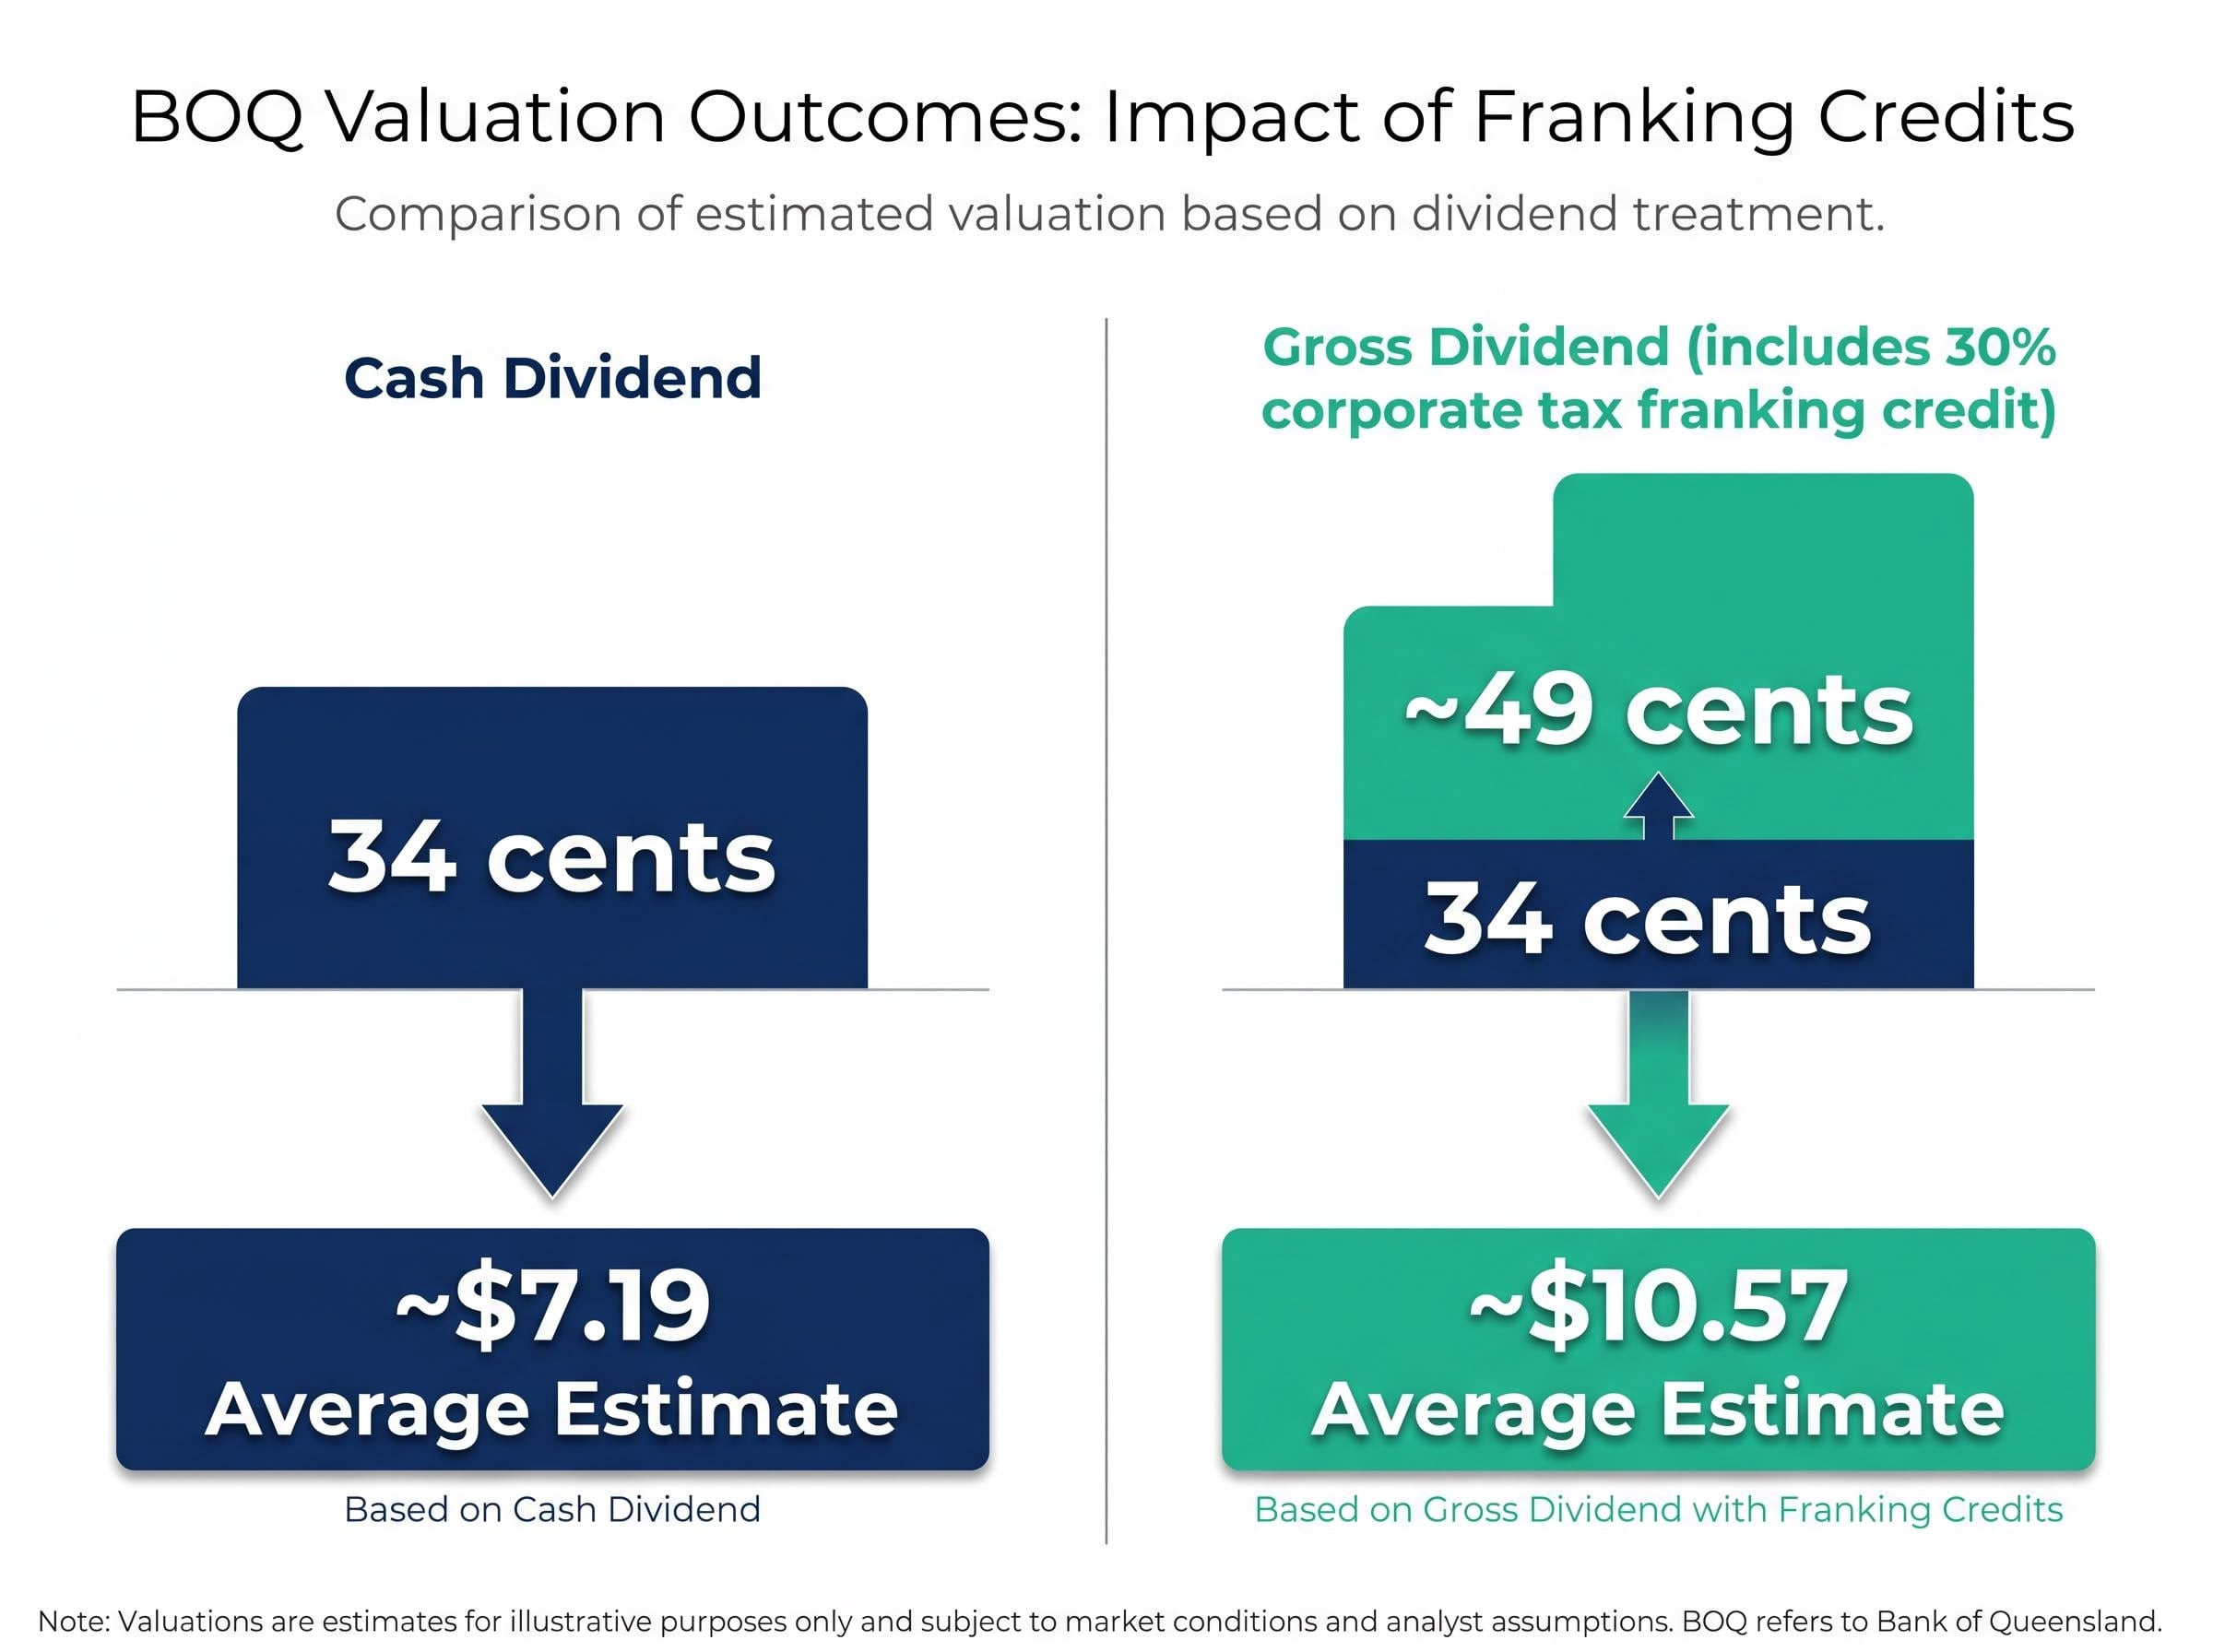
| Dividend Input | DDM Output (Illustrative) |
|---|---|
| Cash dividend (34 cents) | ~$7.19 |
| Gross dividend (~49 cents) | ~$10.57 |
One caveat applies. The full value of franking credits is only realisable by investors who can utilise them: generally Australian resident individuals and complying superannuation funds. Tax-exempt entities and foreign investors cannot claim the credit, which means the cash-dividend DDM is the more appropriate input for those holders.
The grossed-up dividend yield is not a rounding adjustment; for an SMSF in pension phase, the entire franking credit amount can be claimed as a cash refund from the ATO, meaning the after-tax income received can materially exceed what the headline cash yield implies.
The ATO franking credit eligibility rules stipulate that investors must satisfy a 45-day holding period requirement around the ex-dividend date to claim imputation credits, a condition that affects how the grossed-up dividend figure should be applied in any DDM calculation.
For eligible investors, however, franking credits are not a bonus. They are a material component of total return, and ignoring them understates the effective yield.
The standard DDM formula is:
Fair Value = Annual Dividend ÷ (Discount Rate − Dividend Growth Rate)
Building the estimate for BOQ follows five steps:
At a 3% growth rate and an 8.5% discount rate, the formula produces: 0.34 ÷ (0.085 − 0.03) = $6.18. At a 6% discount rate and 4% growth, the output jumps to $17.00. At 11% and 2%, it falls to $3.78.
The range between those extremes, from under $4 to over $17, illustrates why a single-point estimate is misleading for a model this sensitive.
The sensitivity table below shows how the DDM output shifts across combinations of discount rate and growth rate, using the 34-cent base dividend.
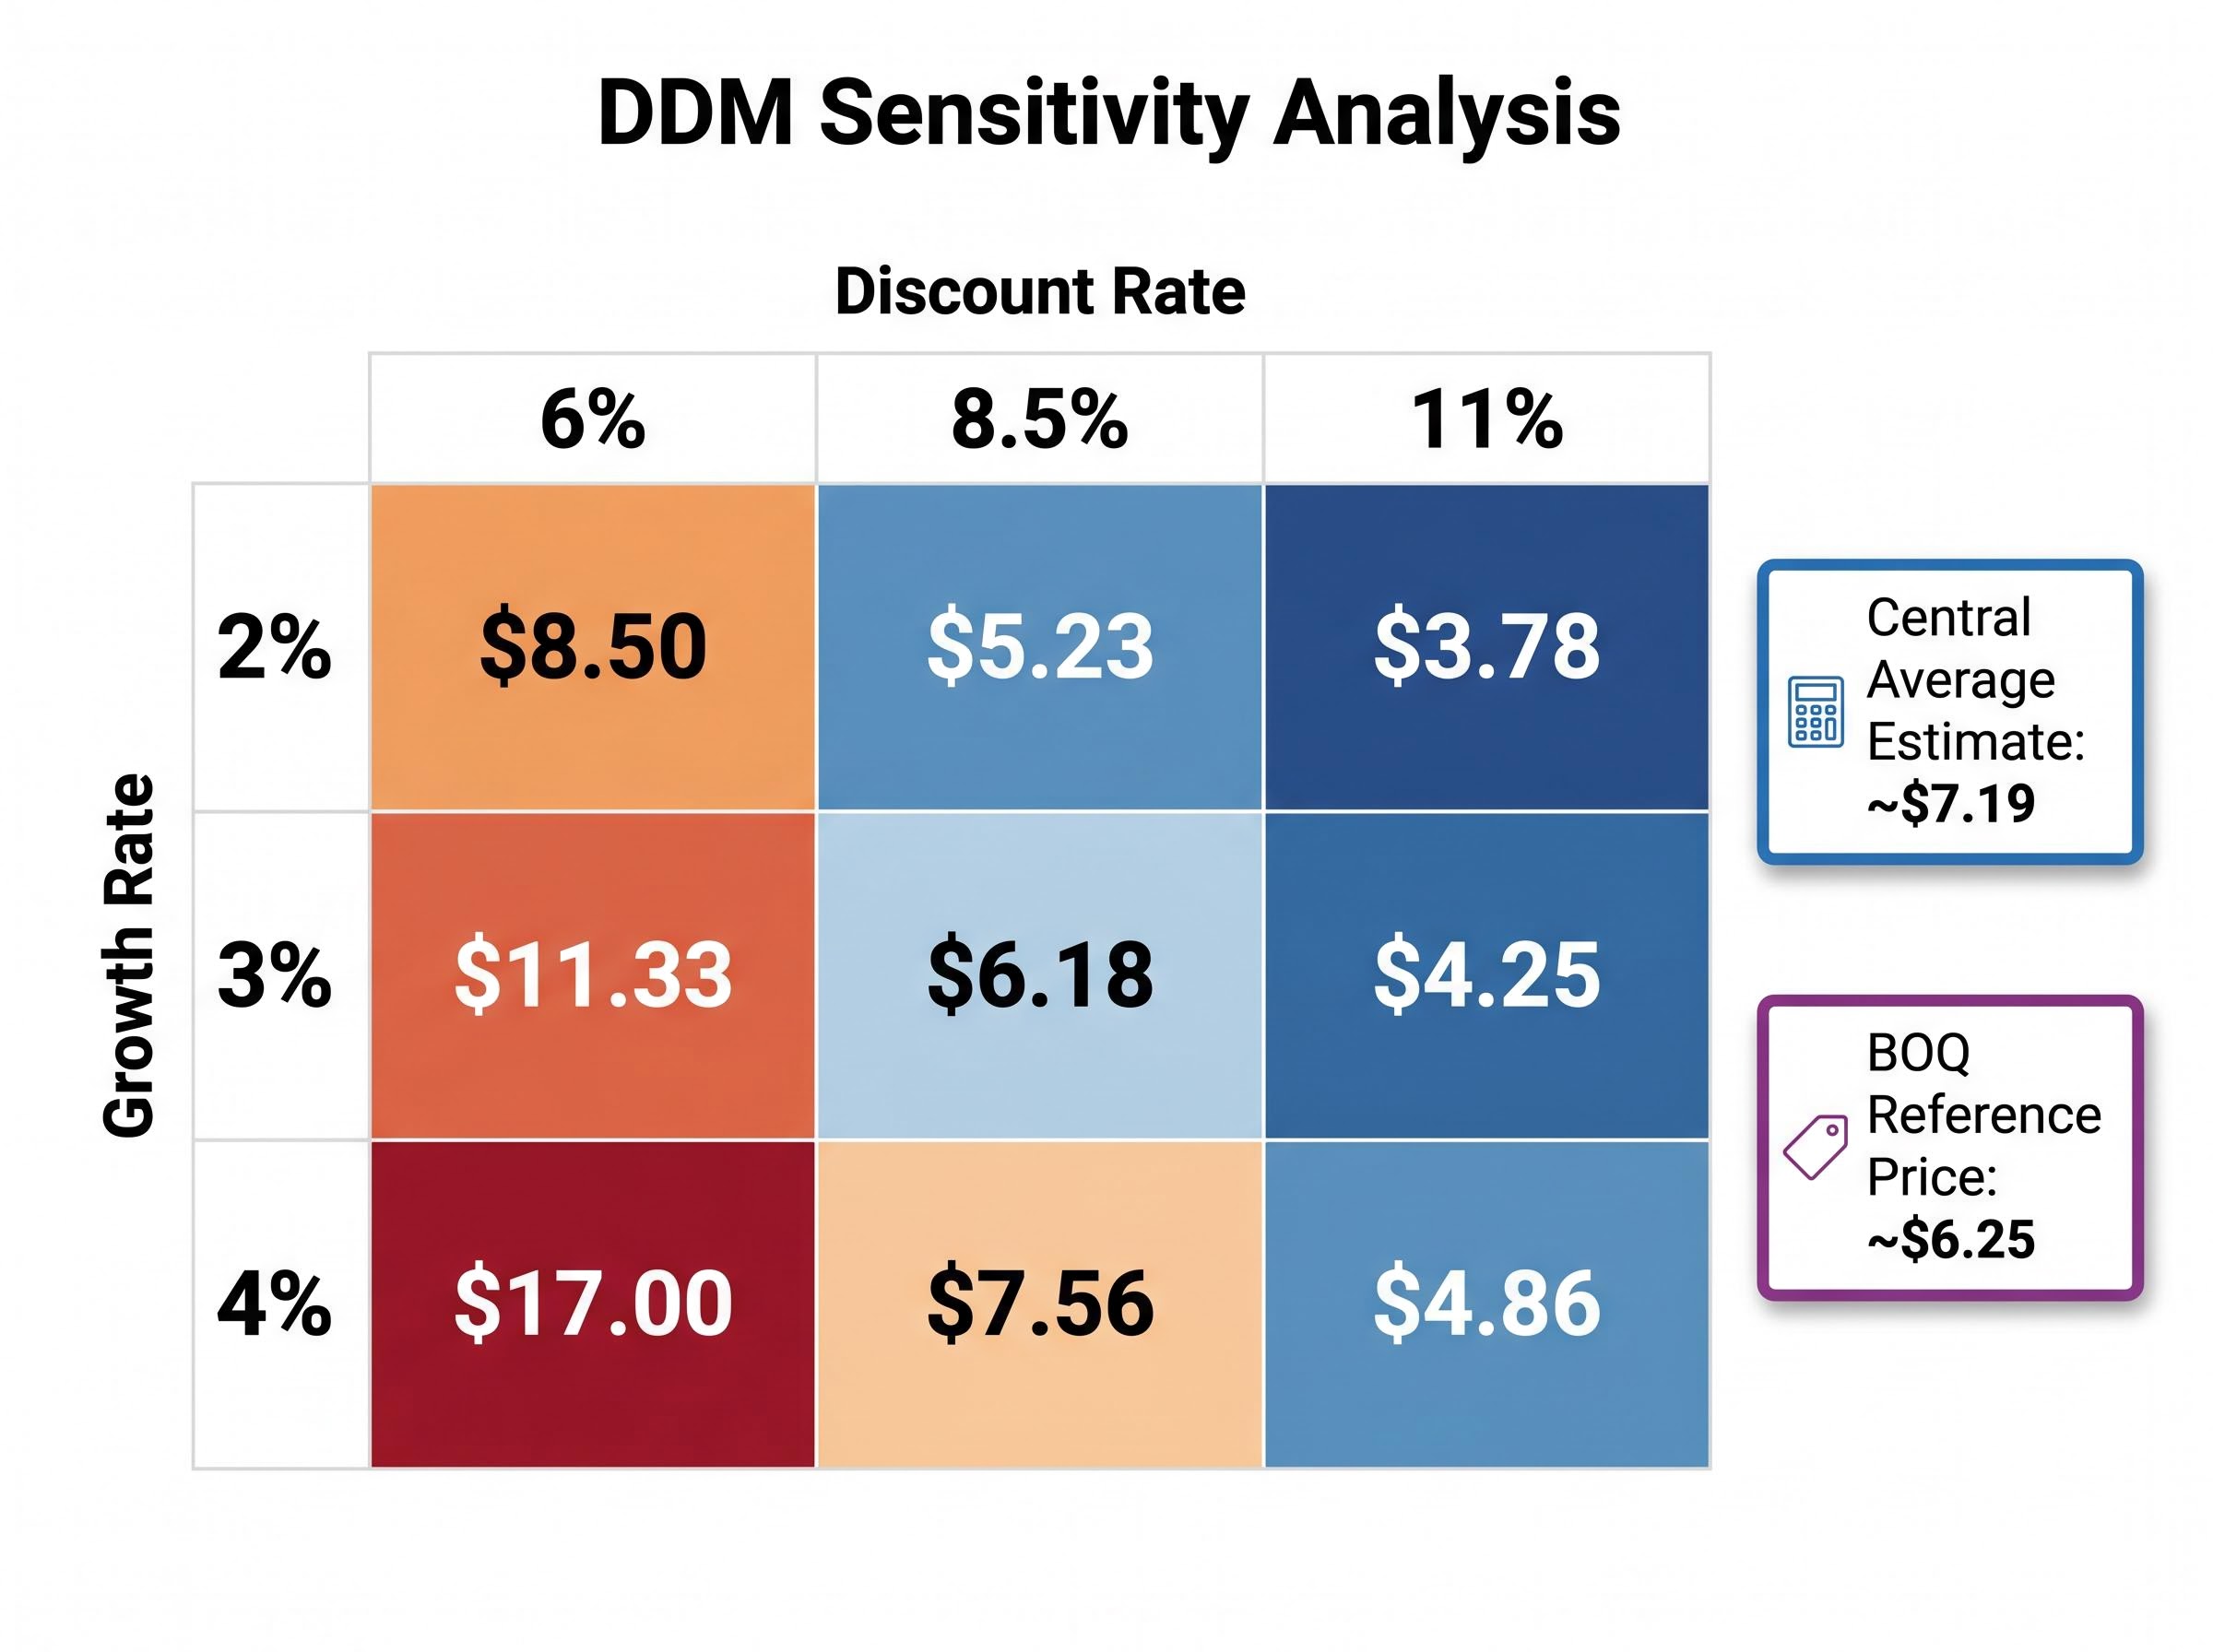
| Growth Rate | Discount Rate: 6% | Discount Rate: 8.5% | Discount Rate: 11% |
|---|---|---|---|
| 2% | $8.50 | $5.23 | $3.78 |
| 3% | $11.33 | $6.18 | $4.25 |
| 4% | $17.00 | $7.56 | $4.86 |
Averaging across these nine scenarios produces a central estimate of approximately $7.19, which sits above BOQ’s reference price of roughly $6.25. Using an adjusted forecast dividend of 35 cents (consistent with analyst expectations for a modest increase), the averaged estimate edges up to approximately $7.40.
No single cell in this table is the answer. The average across a deliberately wide range of assumptions is the discipline that makes the DDM useful rather than dangerously precise.
The DDM assumes a stable, perpetually growing dividend. That assumption can break in several ways, and knowing where it breaks is what separates useful application from false confidence.
Key limitations for bank stocks include:
Cross-checking DDM outputs against other methods helps. BOQ trades at a PE of approximately 15.2x at $6.25, compared with a sector average around 18x. That discount corroborates the DDM’s suggestion of modest undervaluation, but it also raises the question of whether the market is pricing in risks the model does not capture.
The PE ratio method for ASX banks uses cash earnings per share rather than statutory net profit as its input, a distinction that matters because provisioning decisions and one-off restructuring costs can move the statutory figure significantly without reflecting the underlying earnings power the DDM’s growth assumption depends on.
The DDM’s apparent weakness, a wide output range, is its actual strength. It does not pretend to produce a precise price target. Instead, it offers a structured framework for making assumptions explicit and testing whether a stock is broadly cheap or expensive across a range of plausible futures.
The three BOQ estimates developed in this article illustrate the point:
Cash dividend average: ~$7.19 Forecast dividend average: ~$7.40 Gross dividend (franking included): ~$10.57
All three sit above the $6.25 reference price.
The appropriate weight given to the grossed-up estimate depends entirely on the investor’s tax position and ability to utilise franking credits. For a superannuation fund in accumulation phase, the $10.57 figure is relevant. For a foreign investor, it is not.
Averaging across scenarios is the practical discipline that reduces overconfidence. As new dividend data, earnings results, or RBA rate decisions arrive, the inputs should be updated and the model re-run. The DDM is a living framework, not a one-time calculation.
Qualitative work, including assessment of management execution, the macro environment, and competitive dynamics, must accompany the quantitative output before any investment decision.
Across cash-dividend DDM scenarios, BOQ at approximately $6.25 appears modestly below the averaged fair value estimate of $7.19. When franking credits are incorporated for eligible investors, the implied upside widens further toward the $10.57 gross dividend estimate.
That margin of safety is only meaningful if the dividend is sustained. Forward earnings visibility is the variable that matters most from here.
Practical next steps for readers considering a DDM-informed view on BOQ:
The DDM does not tell investors what to buy. It tells them what they are assuming when they buy, and whether the price they pay leaves room for those assumptions to be wrong.
This article is for informational purposes only and should not be considered financial advice. Investors should conduct their own research and consult with financial professionals before making investment decisions. Past performance does not guarantee future results. Financial projections are subject to market conditions and various risk factors.
The Dividend Discount Model values a stock by discounting its expected future dividend payments back to the present day. It works particularly well for Australian bank shares because they tend to offer stable, fully franked dividends and high payout ratios, making their income streams relatively predictable.
Franking credits gross up the effective dividend by approximately 44%, lifting BOQ's 34-cent cash dividend to around 48-49 cents per share. This shifts the averaged DDM fair value estimate from roughly $7.19 (cash dividend basis) to approximately $10.57 when franking credits are fully incorporated, though only investors who can utilise those credits should apply the grossed-up figure.
You need three inputs: the base annual dividend per share, an assumed dividend growth rate (typically 2%-4% for mature Australian banks), and a discount rate reflecting your required return (often constructed from the RBA cash rate plus an equity risk premium). The gap between the growth rate and discount rate is the key driver of the model's output.
The model is highly sensitive to small changes in the discount rate and growth rate assumptions; for BOQ, outputs across a plausible range of inputs span from under $4 to over $17 per share. Averaging across multiple scenarios rather than relying on a single estimate is the recommended approach to reduce overconfidence in any one output.
The DDM assumes a stable, perpetually growing dividend, but bank earnings can be disrupted by credit cycles, margin compression, or elevated payout ratios that leave little room for dividend growth. It also excludes qualitative factors such as property market conditions, unemployment trends, and management execution, so analysts recommend cross-checking DDM outputs against PE ratios and price-to-book multiples.