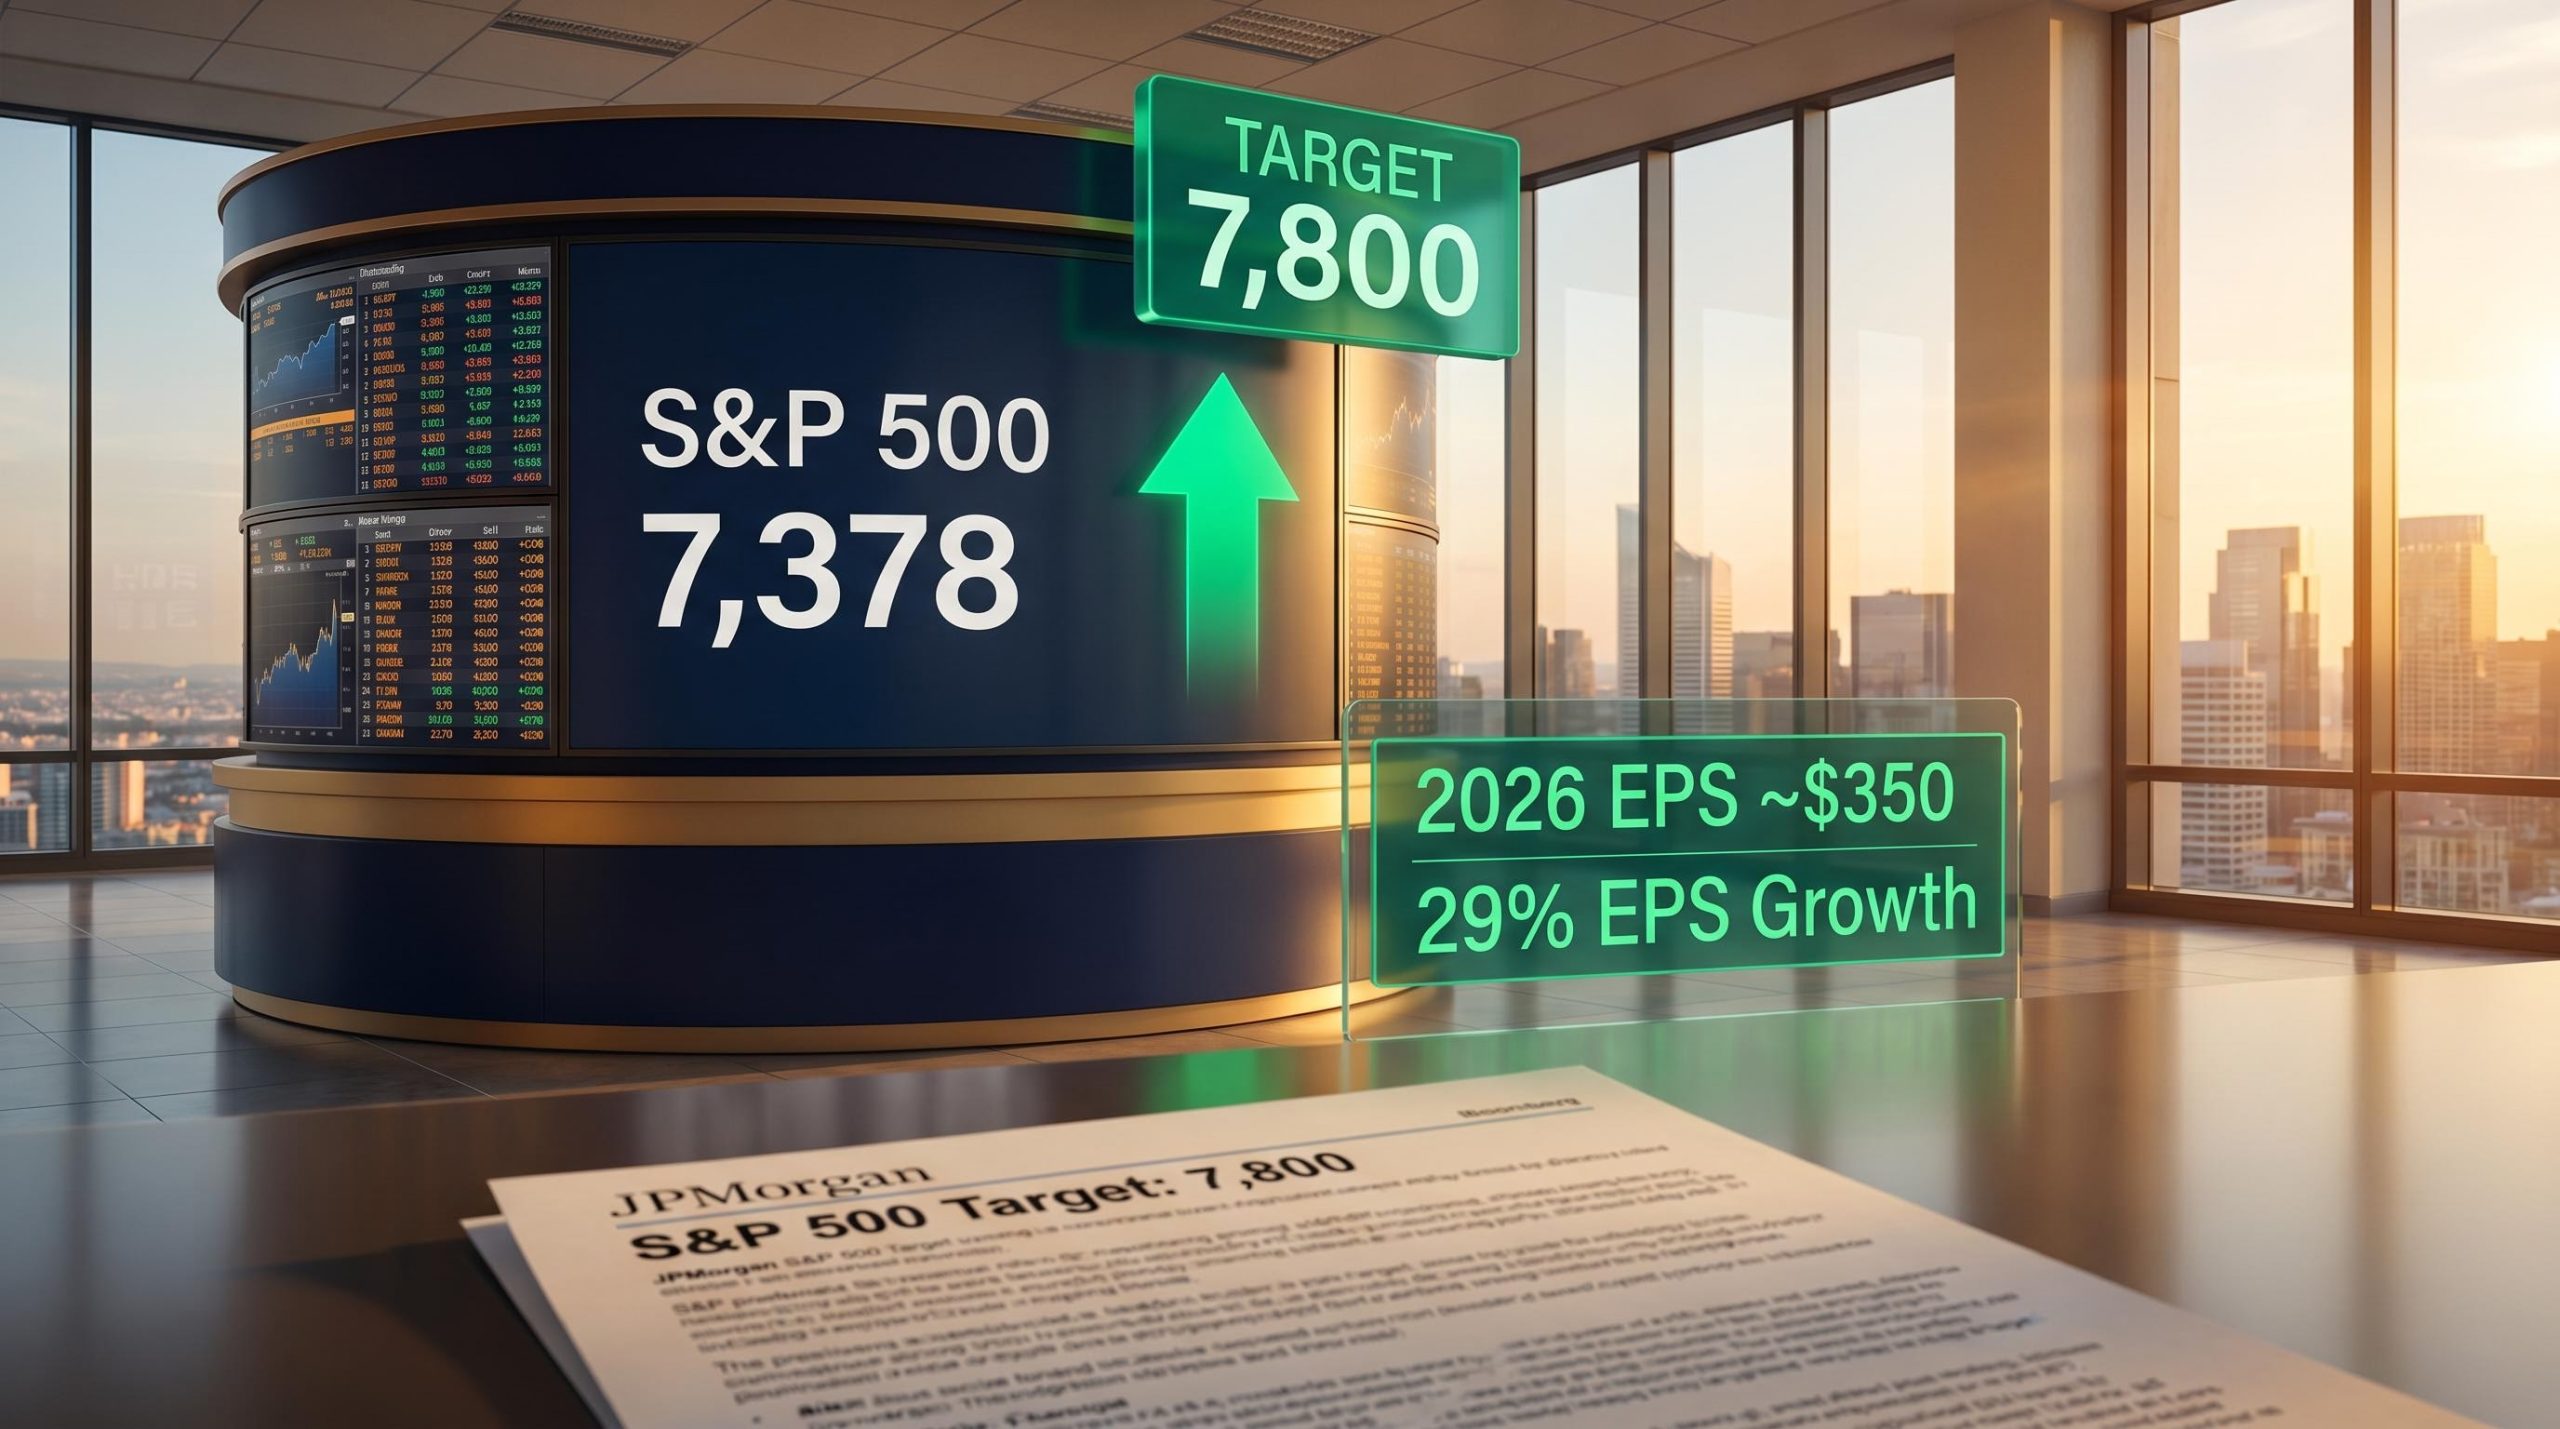
JPMorgan Raises S&P 500 Forecast to 7,800, Citing AI Earnings Boom
2 hrs ago

Consumer confidence just hit its lowest reading ever recorded, and the S&P 500 closed above 7,200 on the same day. The University of Michigan’s final April 2026 Index of Consumer Sentiment (ICS) landed at 49.8, a 6.6% decline from March and the weakest level in the survey’s history. Inflation fears and geopolitical anxiety are the named culprits. Yet equity markets are trading near all-time highs, and institutional analysts at JPMorgan are openly questioning whether this divergence represents over-optimism in markets or a contrarian buy signal hiding in plain sight.
This analysis unpacks why historically depressed consumer sentiment has tended to precede market recovery rather than predict continued declines, what separates the current setup from prior episodes, and how finance-literate investors can convert the April 2026 reading into a reusable analytical framework rather than a reason for panic.
The 49.8 reading is severe. It represents a three-month slide, with pessimistic readings running consecutively from February through April 2026, and it arrived against a backdrop of inflation concern and geopolitical fear linked to the Iran conflict.
The University of Michigan Surveys of Consumers publishes the ICS using a nationally representative sample of households, with the index constructed from five sub-questions covering personal finances, business conditions, and buying conditions, a methodology that gives the 49.8 April 2026 reading its statistical weight as a genuine record low rather than a sampling artifact.
The University of Michigan’s final April 2026 Index of Consumer Sentiment fell to 49.8, the weakest level ever recorded in the survey’s history.
The key data points frame the picture:
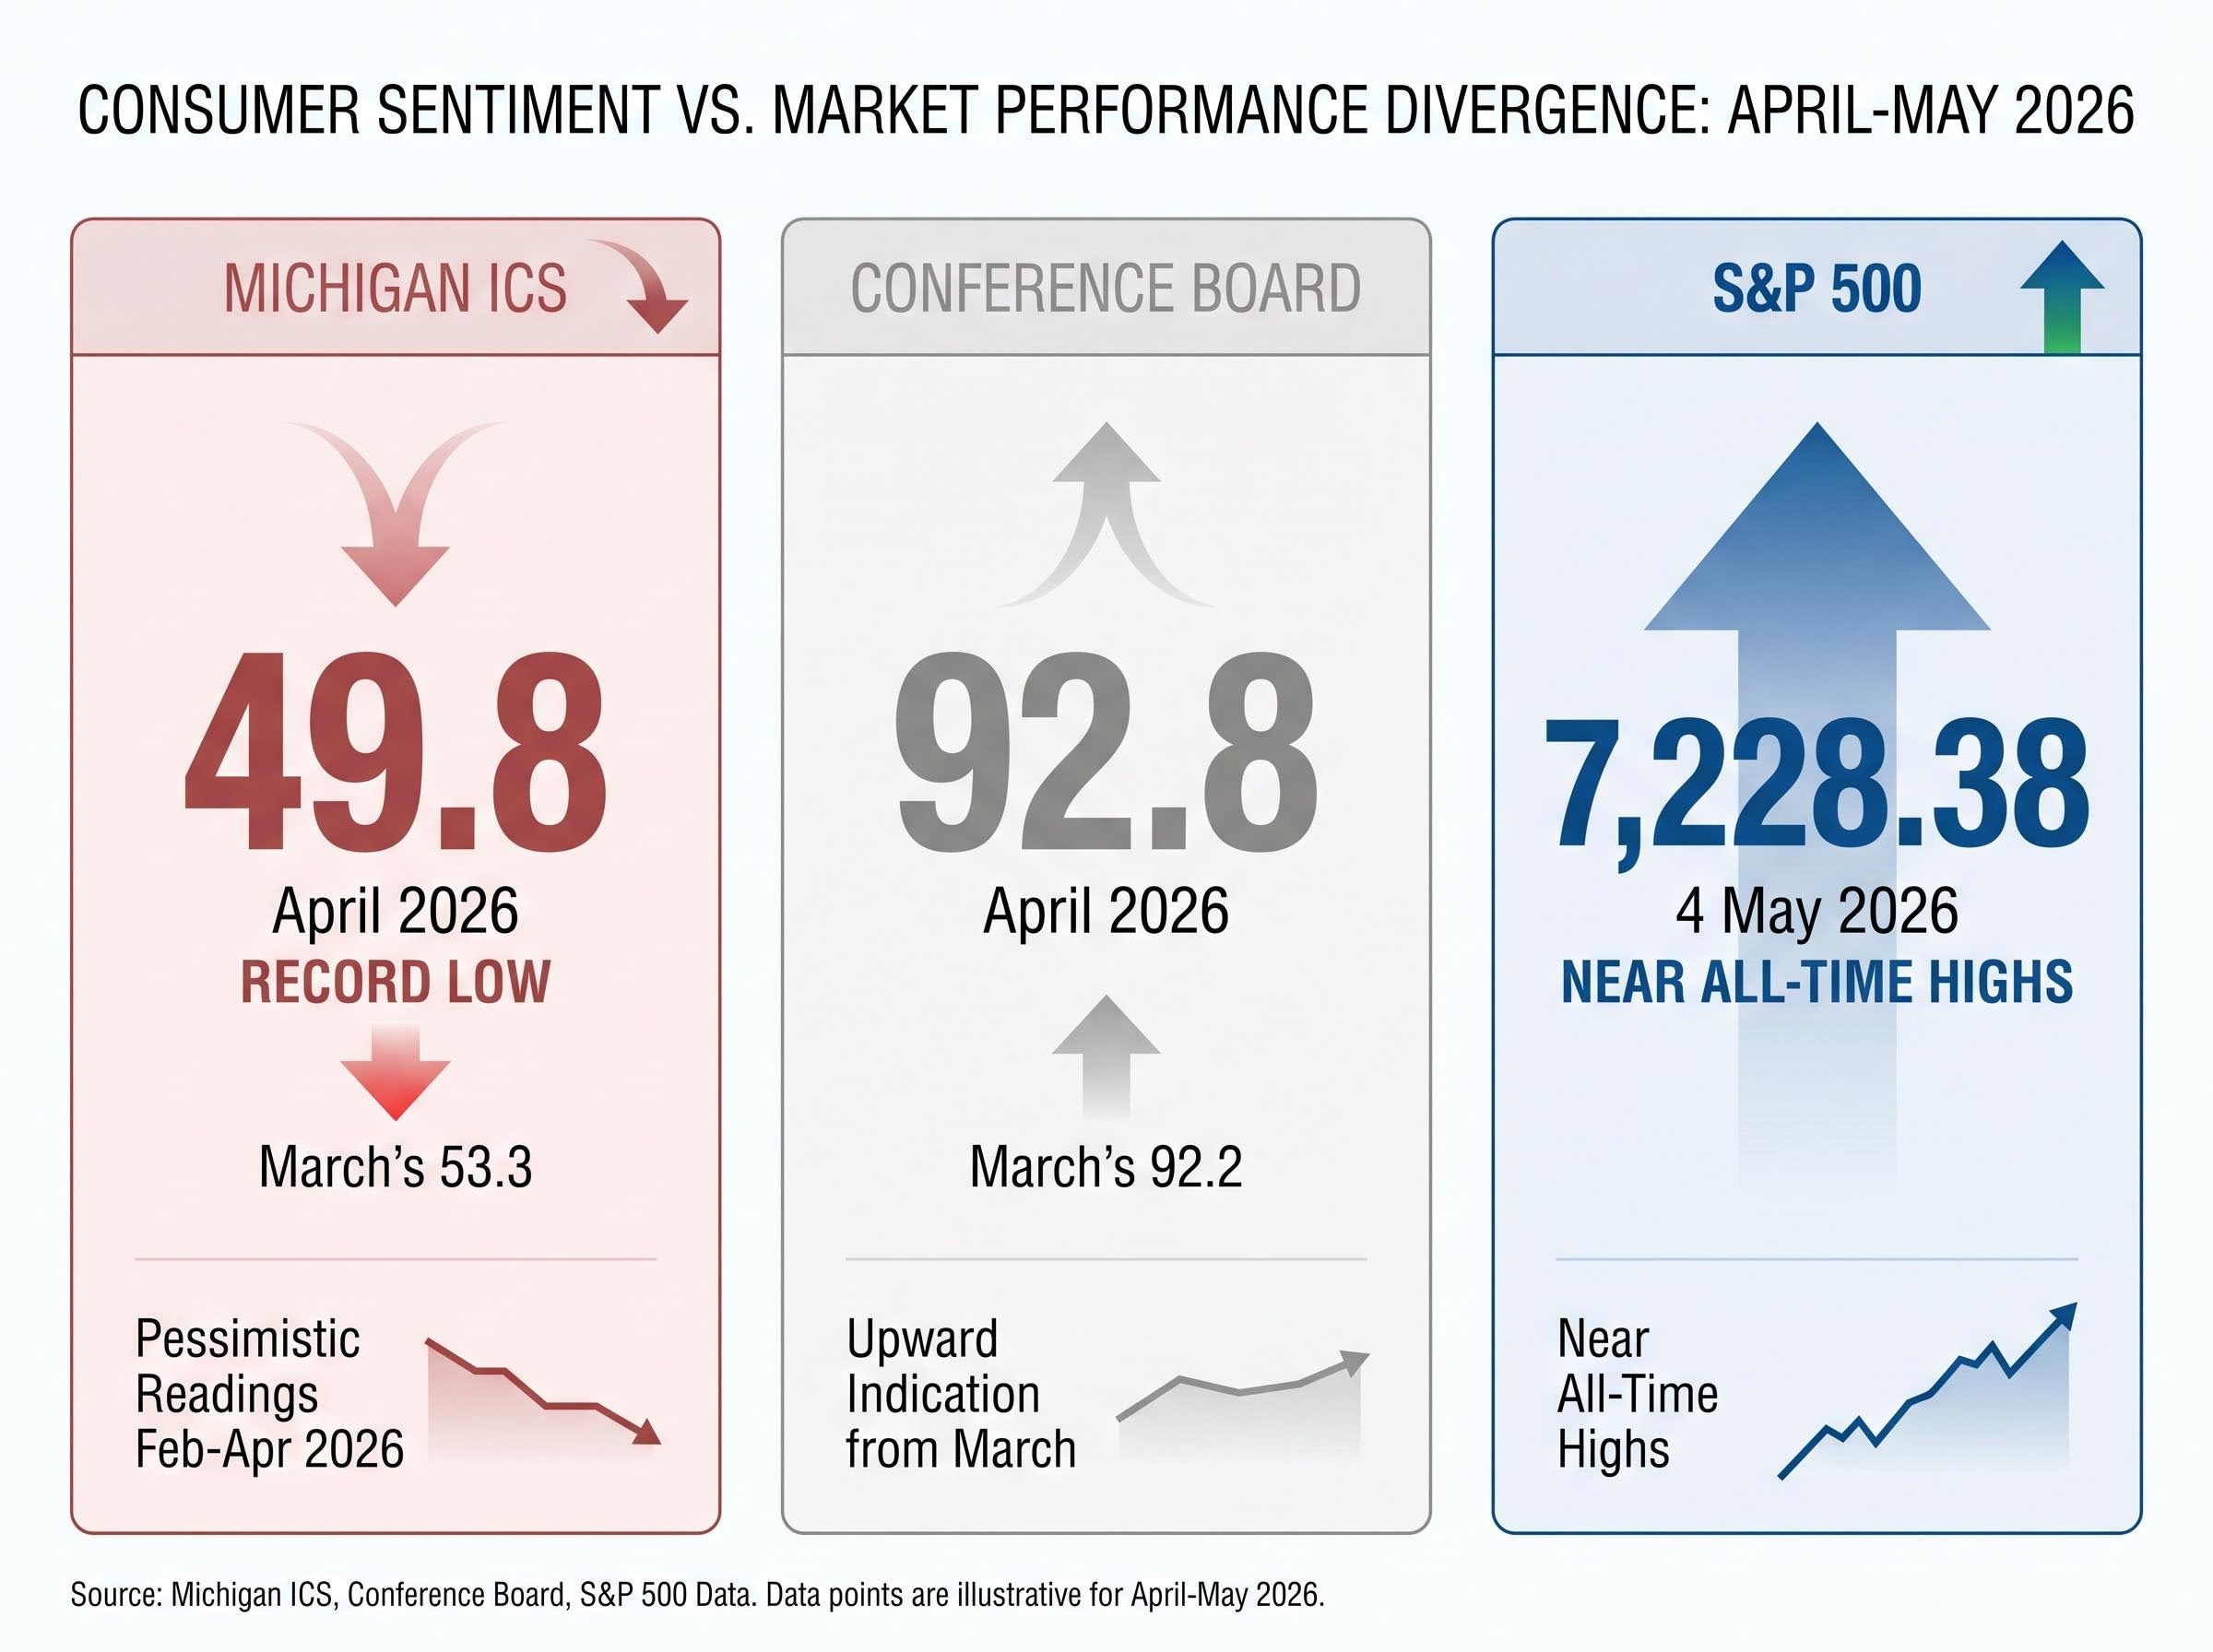
That Conference Board figure matters. The two surveys measure overlapping but distinct aspects of consumer psychology, and they are not in agreement. The Michigan index captures how households feel about current conditions and their personal financial outlook. It does not measure spending behaviour, corporate earnings, or economic fundamentals. The divergence between the two surveys is itself a signal that sentiment gauges are capturing mood, not a unified economic verdict.
Consumer sentiment surveys capture emotional responses to recent lived experience: prices paid at the register, headlines consumed, and anxieties accumulated over weeks and months. Equity prices reflect something different entirely. They encode forward-looking expectations about earnings, interest rates, and growth over quarters and years.
This temporal gap is not incidental. It is structural.
Fisher Investments has framed equities themselves as among the most reliable leading economic indicators, a position that reframes the S&P 500’s current level not as a contradiction to the sentiment data but as a competing signal with a different time horizon.
The S&P 500 closed at 7,228.38 on 4 May 2026. Global equities recently reached new all-time highs despite ongoing Middle East conflict. JPMorgan’s market insights characterised the current environment as one of “dismal confidence and euphoric markets,” an explicit acknowledgement that the two signals are pulling in opposite directions.
The resolution is not that one side is wrong. Consumer pessimism reflects real lived experience; market optimism reflects a different information set processed by different actors on a different timeline. Once this distinction is clear, the divergence stops being alarming and starts becoming analytically useful.
Equity sentiment indicators tracked by Goldman Sachs reached the 73rd historical percentile in early May 2026, a level the firm’s data since 2009 associates with below-average S&P 500 returns over the following two to eight weeks, adding a second institutional data point to the divergence JPMorgan has flagged between market optimism and economic fundamentals.
The 2022 bear market offers the most instructive recent parallel. Consumers expressed deep recession fears and inflation anxiety throughout that period. The sentiment readings that felt most alarming at the time coincided with the market’s lowest levels, and in hindsight, those troughs marked the period closest to recovery, not the beginning of sustained decline.
The post-2022 trajectory confirmed the pattern. Global equities subsequently climbed to all-time highs, rewarding investors who stayed positioned through the pessimism rather than those who acted on it.
| Variable | 2022 Sentiment Trough | April 2026 |
|---|---|---|
| Sentiment reading | Near record lows | 49.8 (record low) |
| Named drivers | Inflation, recession fears | Inflation, geopolitical risk |
| Equity market at trough | S&P 500 bear market lows | S&P 500 near all-time highs |
| Subsequent direction | Recovery to new highs | To be determined |
The contrarian mechanism at work is straightforward: markets tend to benefit most when actual outcomes exceed depressed expectations. Record-low sentiment sets the lowest possible bar for reality to clear. As Fisher Investments has noted, the conditions for positive surprise are strongest when collective expectations are at their weakest. The pessimistic trend beginning in February 2026 shares enough structural similarity with prior trough periods to warrant careful attention from investors weighing where expectations are anchored relative to probable outcomes.
A contrarian thesis is only as strong as the headwinds it survives. Three categories of genuine concern deserve direct acknowledgement:
These are not trivial concerns. They are the factual basis for consumer pessimism.
The aggregate economic picture, however, tells a less alarming story:
Services account for more than three-quarters of US economic output, limiting housing’s capacity to drag the broader economy.
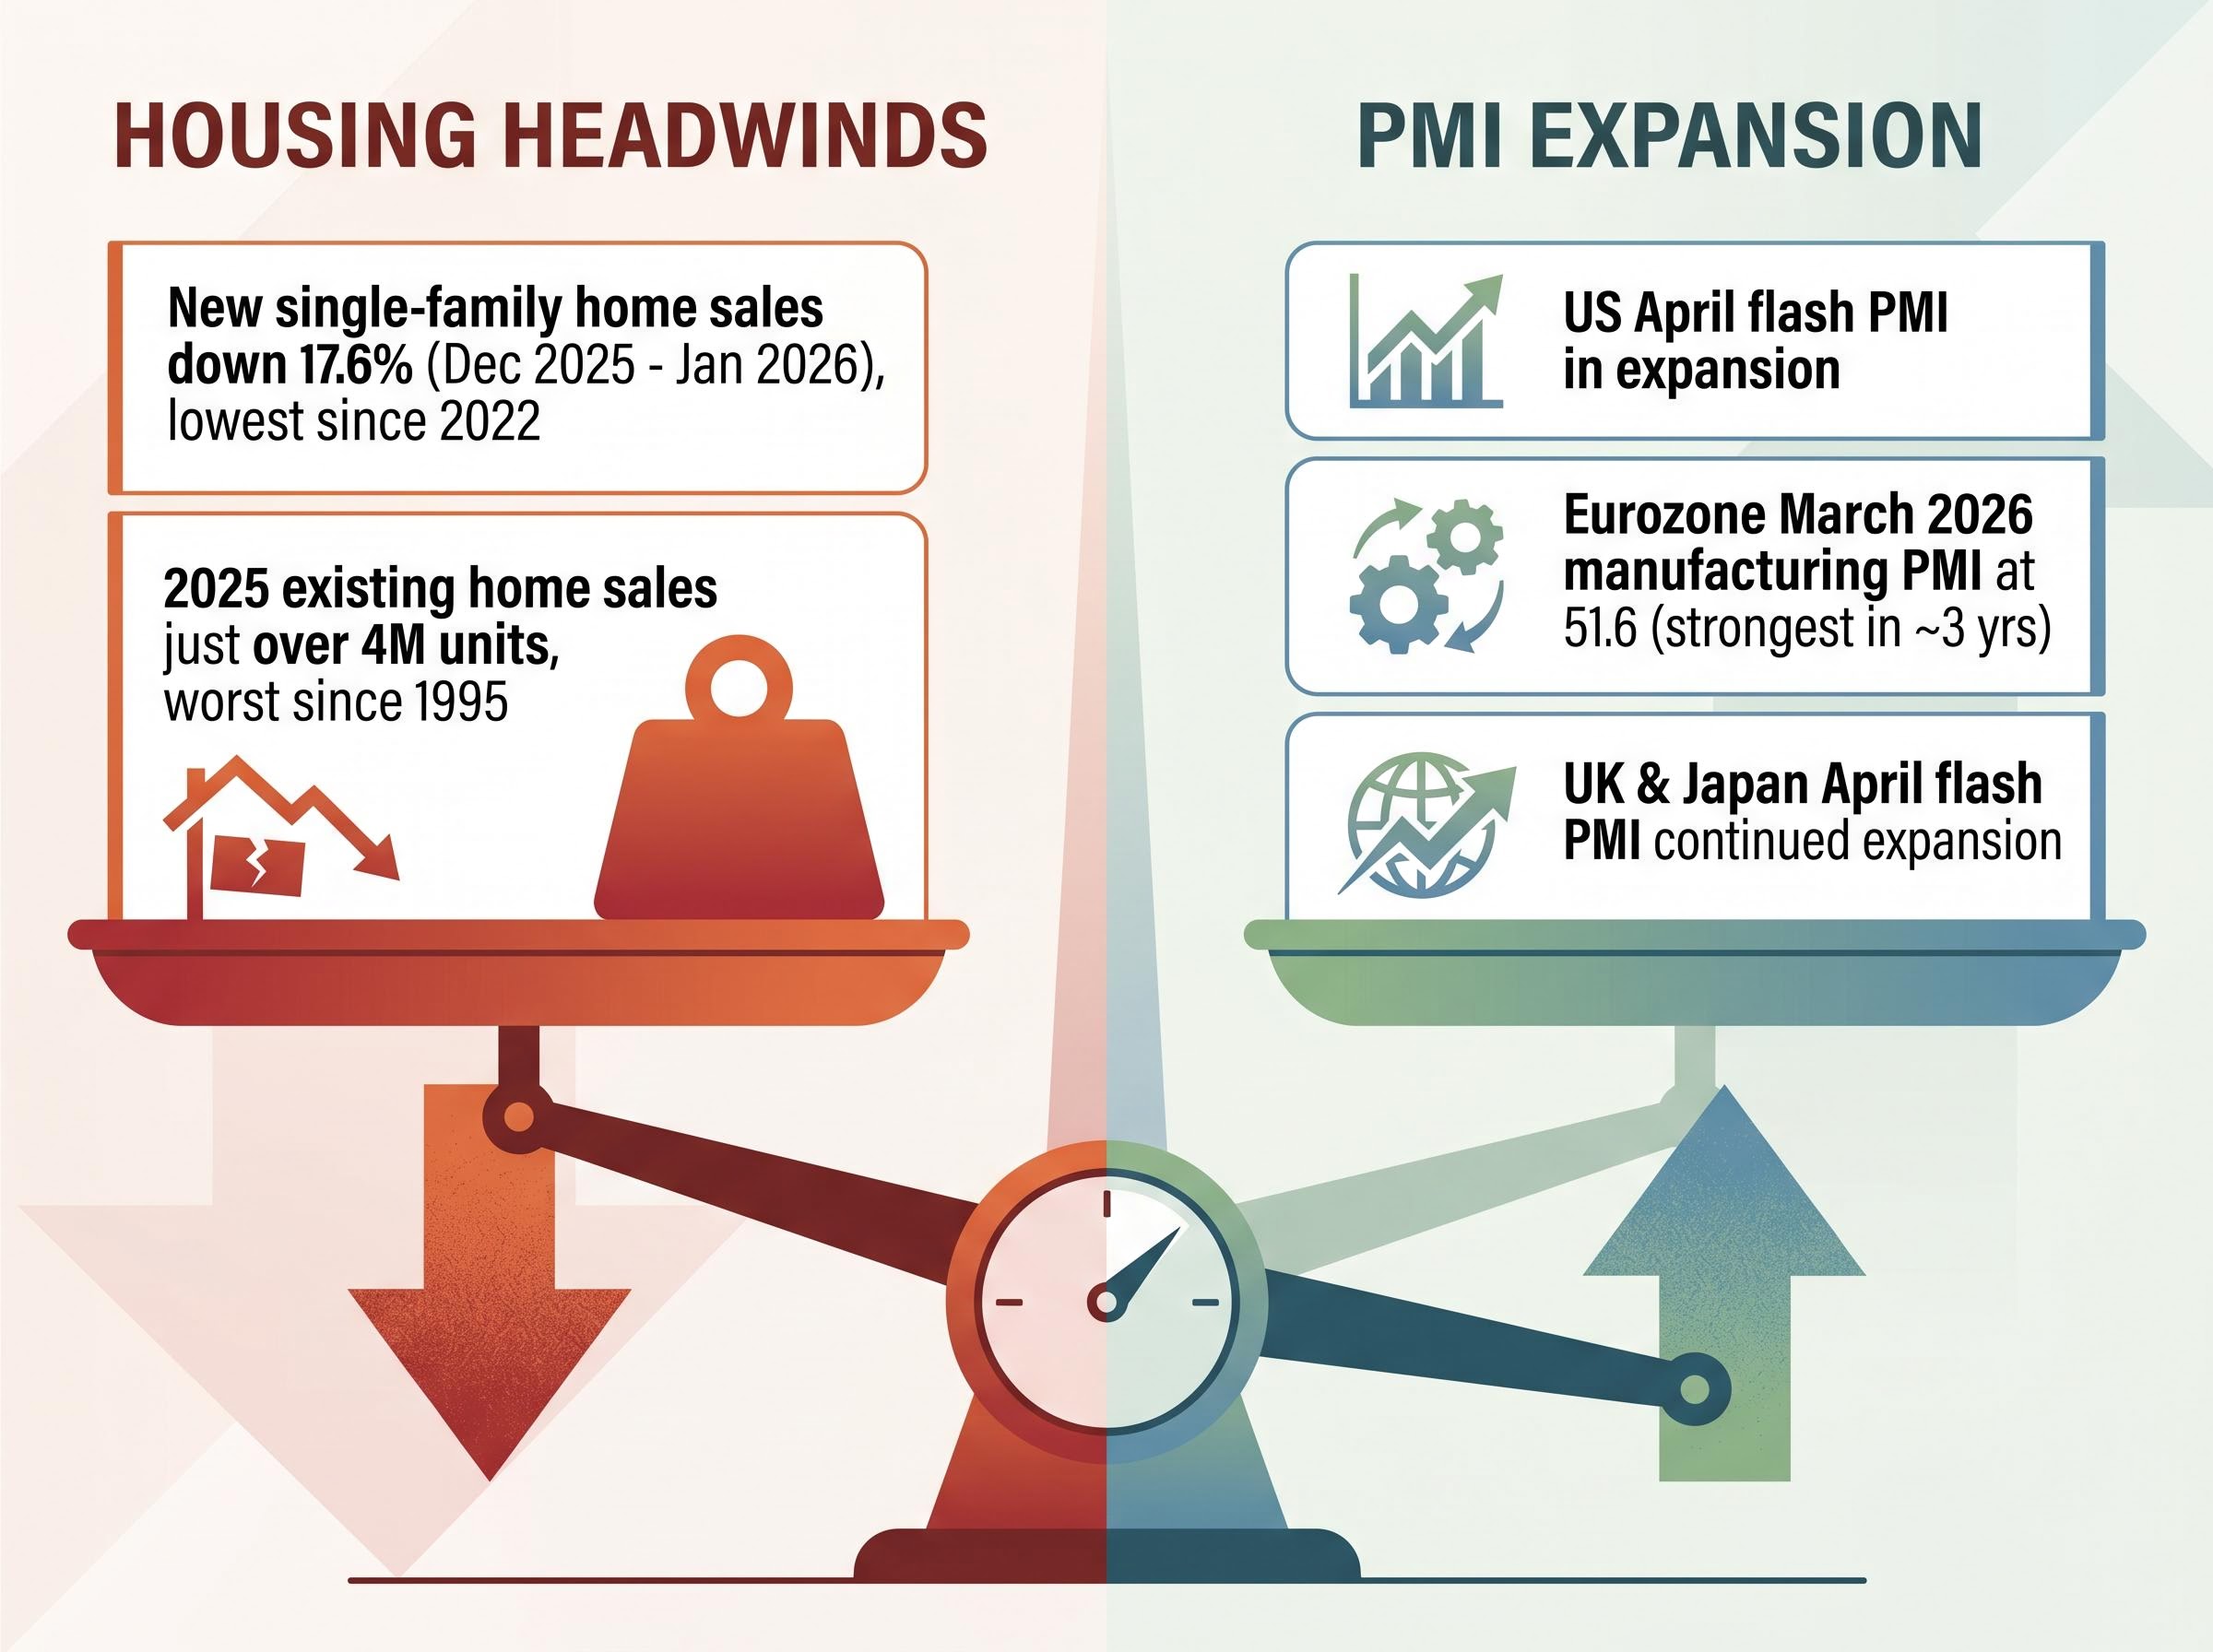
Fisher Investments has made this point explicitly: while housing weakness is real, the sector represents a small share of total economic activity relative to the services economy. The PMI data across multiple geographies suggests the underlying expansion remains intact despite the headwinds consumers are feeling most acutely.
Q1 2026 GDP composition shows why the PMI expansion data cited above is not simply a lagging artefact: private domestic demand grew at 2.5% annualised while business fixed investment surged at 10.4%, driven by AI infrastructure spending, providing the structural foundation that institutional capital is pricing forward even as household sentiment collapses.
The analytical value of sentiment data for investors does not lie in following it directionally. It lies in using extreme readings as calibration points for where collective expectations are anchored.
Three conditions distinguish a depressed sentiment reading that functions as a constructive contrarian signal from one that genuinely foreshadows trouble:
K-shaped recovery dynamics complicate the contrarian read on sentiment data: if aggregate spending is being sustained almost entirely by affluent households drawing down wealth while mass-market consumers reduce discretionary purchases, the gap between headline economic data and household experience is structural rather than a temporary emotional overshoot, which is precisely the kind of divergence that warrants scrutiny before treating depressed sentiment as a pure buying signal.
The preliminary May 2026 Michigan reading, scheduled for 8 May 2026, provides the first real-time data point on whether April marked a trough or the beginning of more sustained deterioration. JPMorgan’s framing of the current divergence as a question rather than an answer underscores that the opportunity is conditional: the contrarian thesis strengthens if the next reading stabilises, and weakens if the decline accelerates.
Investors who wait for the data rather than reacting to the headline are positioned to act on evidence rather than emotion.
The S&P 500 at 7,228.38 against a Michigan ICS reading of 49.8 is the starkest sentiment-market divergence on record. Global equities sit near all-time highs. American consumers report the bleakest outlook ever measured.
The S&P 500 above 7,200 and the weakest consumer sentiment ever recorded: a divergence this wide is not a contradiction. It is the mechanism by which contrarian opportunities exist at all.
The gap between how Americans feel and what markets are doing is not a flaw in the data. It reflects two different systems processing two different information sets on two different timelines. History suggests, but does not guarantee, that the resolution has tended to favour markets when sentiment has overshot to the downside. The 8 May 2026 preliminary Michigan reading, the trajectory of inflation, and the evolution of geopolitical risk remain open variables that could shift the picture in either direction.
The right analytical response to record-low sentiment is neither to act on it nor to dismiss it. It is to understand what kind of signal extreme readings have historically represented, and to calibrate expectations accordingly.
For investors who accept the contrarian framing and want a systematic approach to deploying capital when collective pessimism peaks, our dedicated guide to dollar-cost averaging at sentiment troughs examines the historical outperformance data, the behavioural case for staged deployment over lump-sum entry, and the hybrid strategies used when near-term direction remains genuinely uncertain.
This article is for informational purposes only and should not be considered financial advice. Investors should conduct their own research and consult with financial professionals before making investment decisions. Past performance does not guarantee future results, and forward-looking observations in this analysis are subject to market conditions and various risk factors.
The University of Michigan Consumer Sentiment Index (ICS) is a monthly survey measuring how US households feel about their personal finances, business conditions, and buying conditions. Investors track it because extreme readings, particularly record lows, have historically coincided with market troughs rather than the start of sustained declines.
Consumer sentiment surveys capture how households feel about conditions they have already experienced, such as prices and recent headlines, while equity prices reflect forward-looking expectations about earnings and growth discounted by institutional capital. This structural time-horizon difference explains why the two measures can diverge sharply, as they did in April 2026 when the Michigan ICS hit 49.8 and the S&P 500 closed above 7,200.
Historically, record-low consumer sentiment has tended to precede market recovery rather than sustained declines. The 2022 sentiment trough, driven by inflation and recession fears, coincided with bear market lows, and global equities subsequently recovered to all-time highs, rewarding investors who remained positioned through the pessimism.
The preliminary May 2026 Michigan Consumer Sentiment reading, scheduled for 8 May 2026, is the key near-term data point. The contrarian thesis strengthens if the reading stabilises or recovers, and weakens if the decline accelerates, making it a critical test of whether April marked a trough.
Not necessarily. While housing weakness and inflation concerns are real, the broader macro picture shows US April flash PMI remaining in expansion territory, Eurozone manufacturing PMI at a near three-year high of 51.6 in March 2026, and Q1 2026 private domestic demand growing at 2.5% annualised with business fixed investment surging at 10.4%, suggesting the underlying expansion remains intact despite depressed household sentiment.