Picture the investor who wants to stay in the stock market but simply cannot afford to watch a third of their savings disappear in a bad year. They are five years from retirement, or they are sitting on cash they need to grow but dare not gamble. Everywhere they look, a product promises “protection,” and none of them explains what that word actually buys.
That investor is increasingly common, and the industry has noticed. Defined-outcome ETFs, the umbrella that covers buffered and principal protected ETFs, have grown from roughly $5 billion at the end of 2020 to around $85 billion by early 2026, according to industry data. That kind of scale tells you a genuine need exists. It does not tell you that every buyer understands what they hold.
This guide gives you the plain-language framework the product marketing skips. After reading it, you will be able to judge any buffered or principal protected ETF on its real trade-offs rather than its headline: what the cap and buffer mean in practice, how the tax treatment stacks up against the alternatives, and when these products actually help your portfolio versus quietly working against it.
What these ETFs actually do, and why the options structure matters
Here is the version you see as an investor. You choose a fund, you get a stated level of downside protection, and in exchange your upside is limited to a stated maximum over a fixed period, usually one year. Clean, defined, easy to explain. That simplicity is the whole selling point.
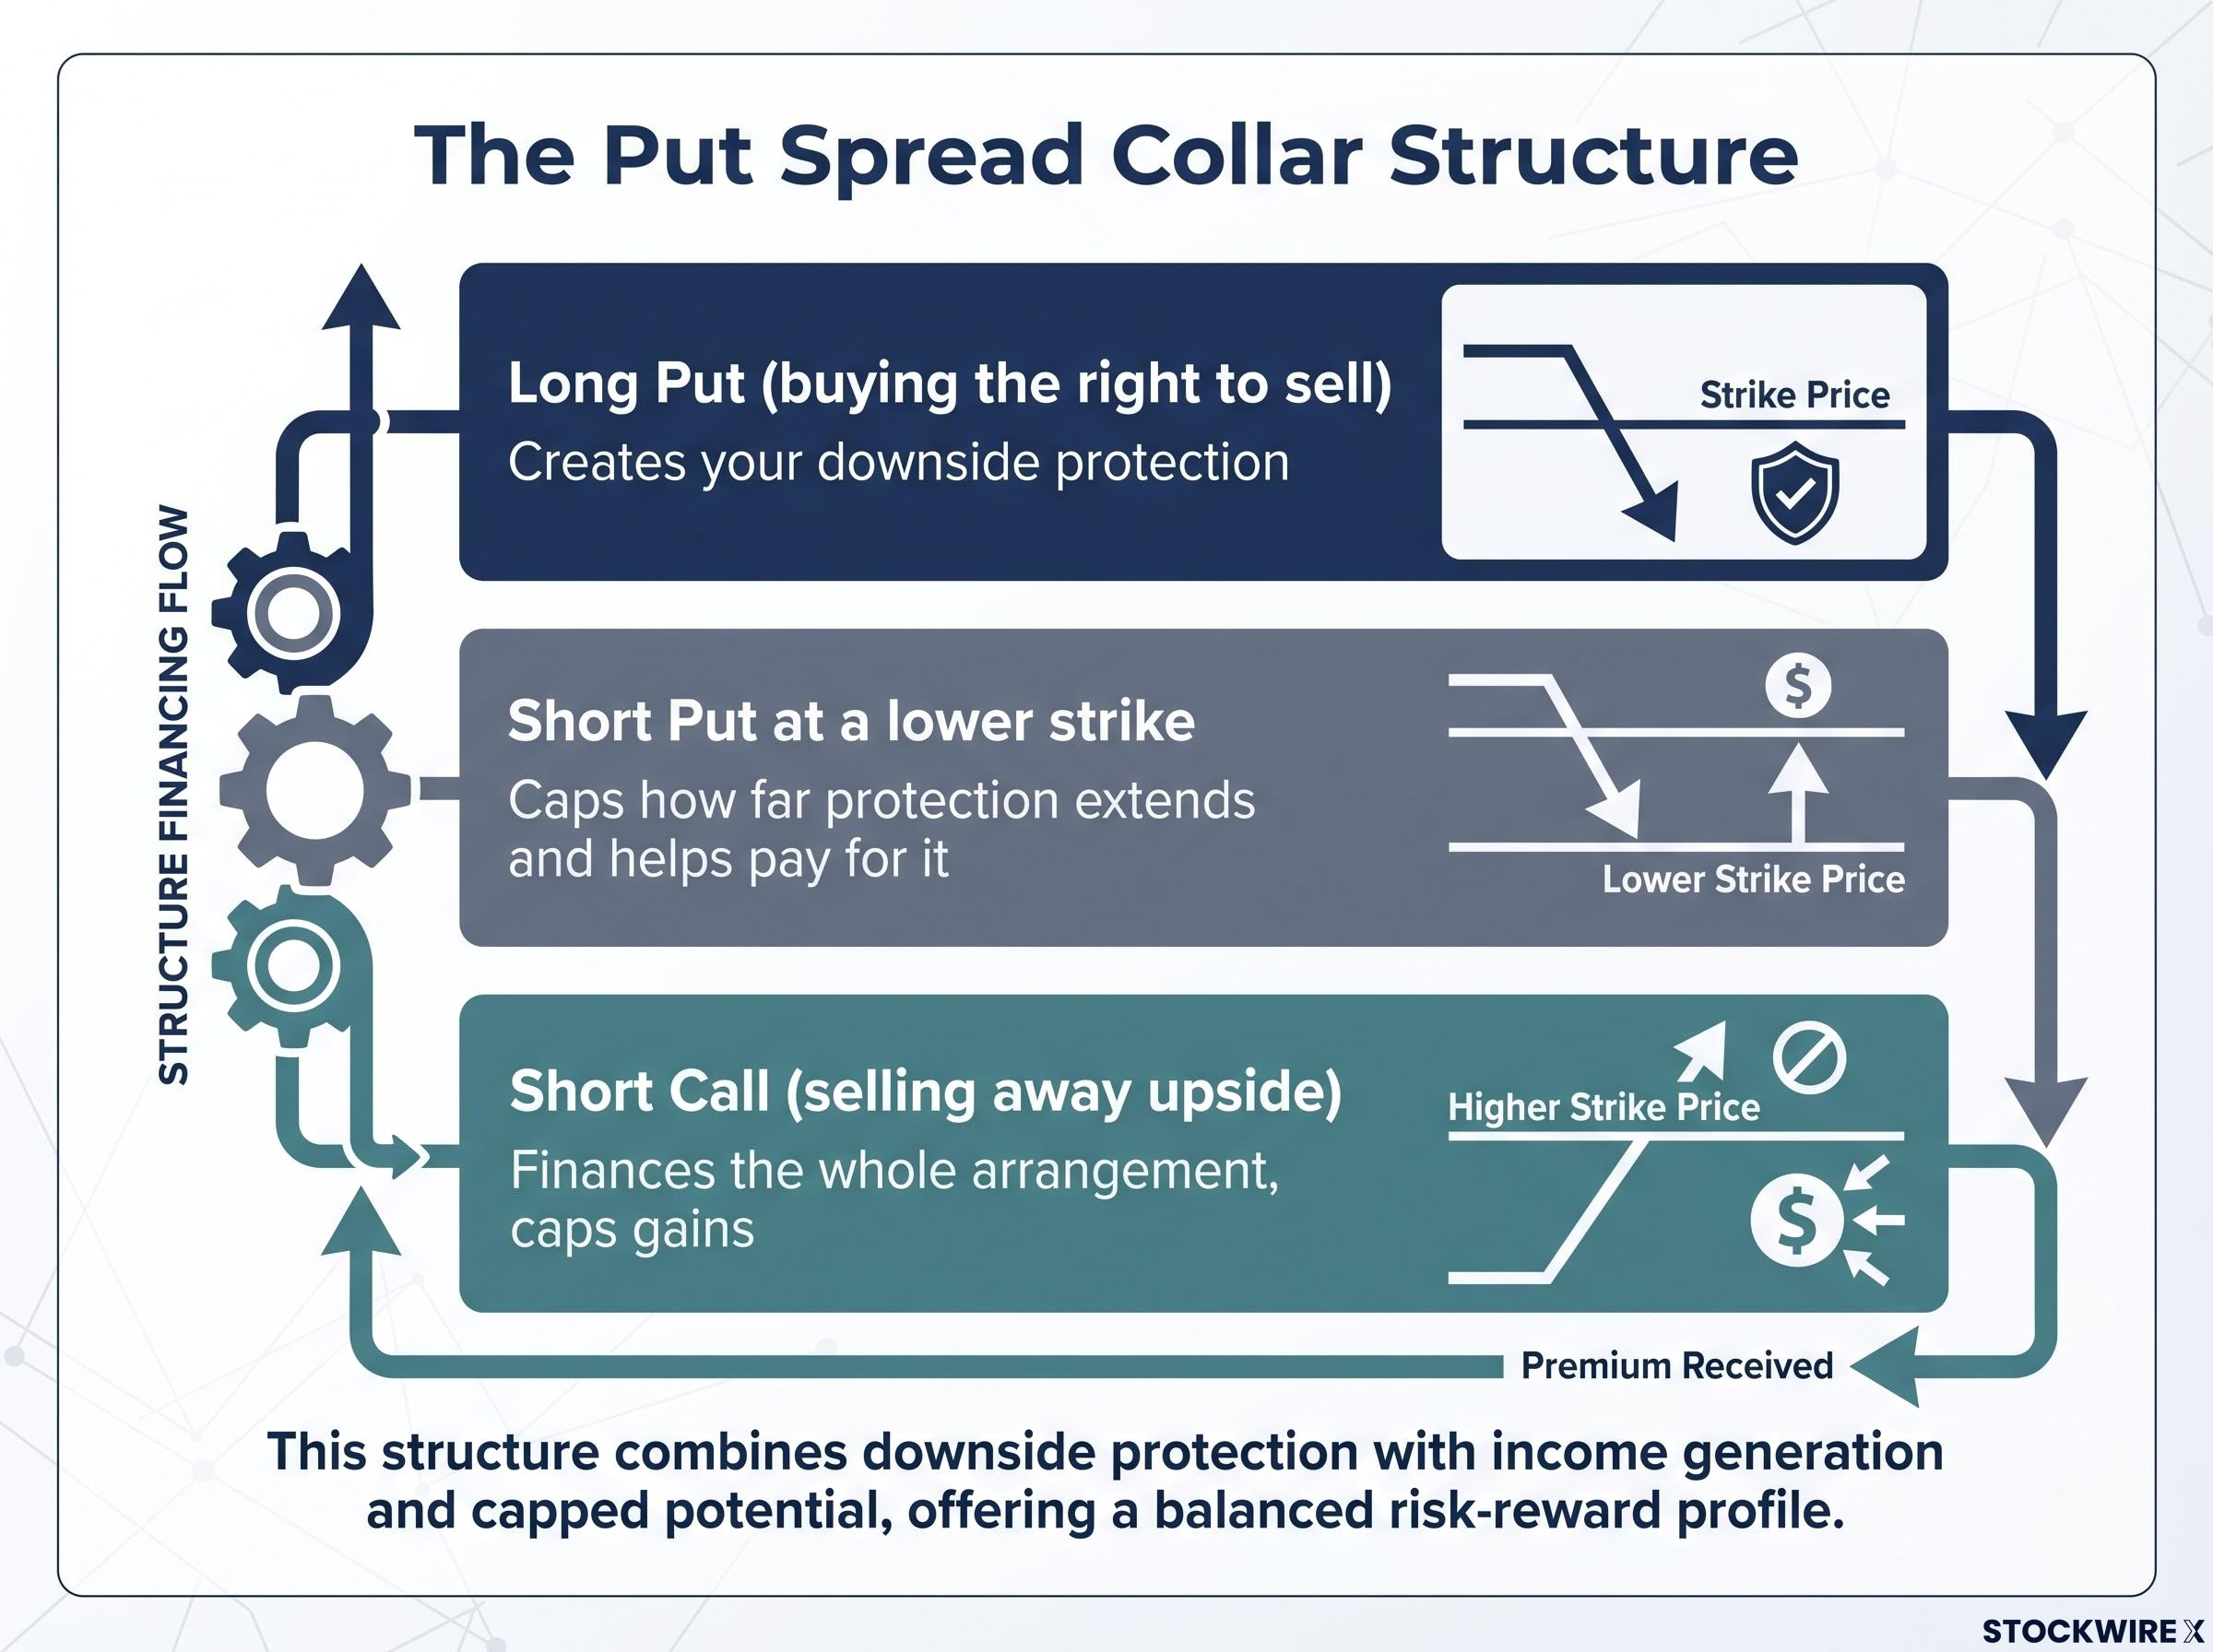
Underneath, it is anything but simple. These funds are built on a put spread collar, an options structure that trades away some of your potential gains to pay for explicit downside protection over a set outcome period. The “protection” is not a promise written in a contract. It is the mathematical output of an options market at the moment the period begins.
Put spread mechanics sit at the heart of how buffered ETFs are priced: the same time-decay dynamics and probability trade-offs that govern standalone credit spreads determine whether the options structure inside a defined-outcome fund can deliver its stated buffer at any given market price.
The structure combines three moves:
- A long put (buying the right to sell): this is what creates your downside protection.
- A short put at a lower strike (selling a put further down): this caps how far the protection extends and helps pay for it.
- A short call (selling away upside): this finances the whole arrangement, and it is why your gains are capped.
That last piece is the trade. You give up unlimited upside so the fund can afford to buy you a floor.
This distinction matters more than any single number on the factsheet.
“100% protection in these ETFs reflects options pricing at the start of the outcome period, not an FDIC-style guarantee.”
A 100% protection ETF is not FDIC-insured and carries no legal guarantee of the kind a bank product gives you. The protection depends entirely on you buying at the start of the outcome period and holding all the way through. Treat it as a risk-free allocation and you have misread the product before you have even bought it.
Across every fund you look at, two variables will define your experience: the cap rate (your maximum upside) and the buffer (how much decline the fund absorbs before your money is at risk).
How caps and buffers trade off against each other
These two numbers move in opposite directions, always. More protection costs you upside, and more upside costs you protection.
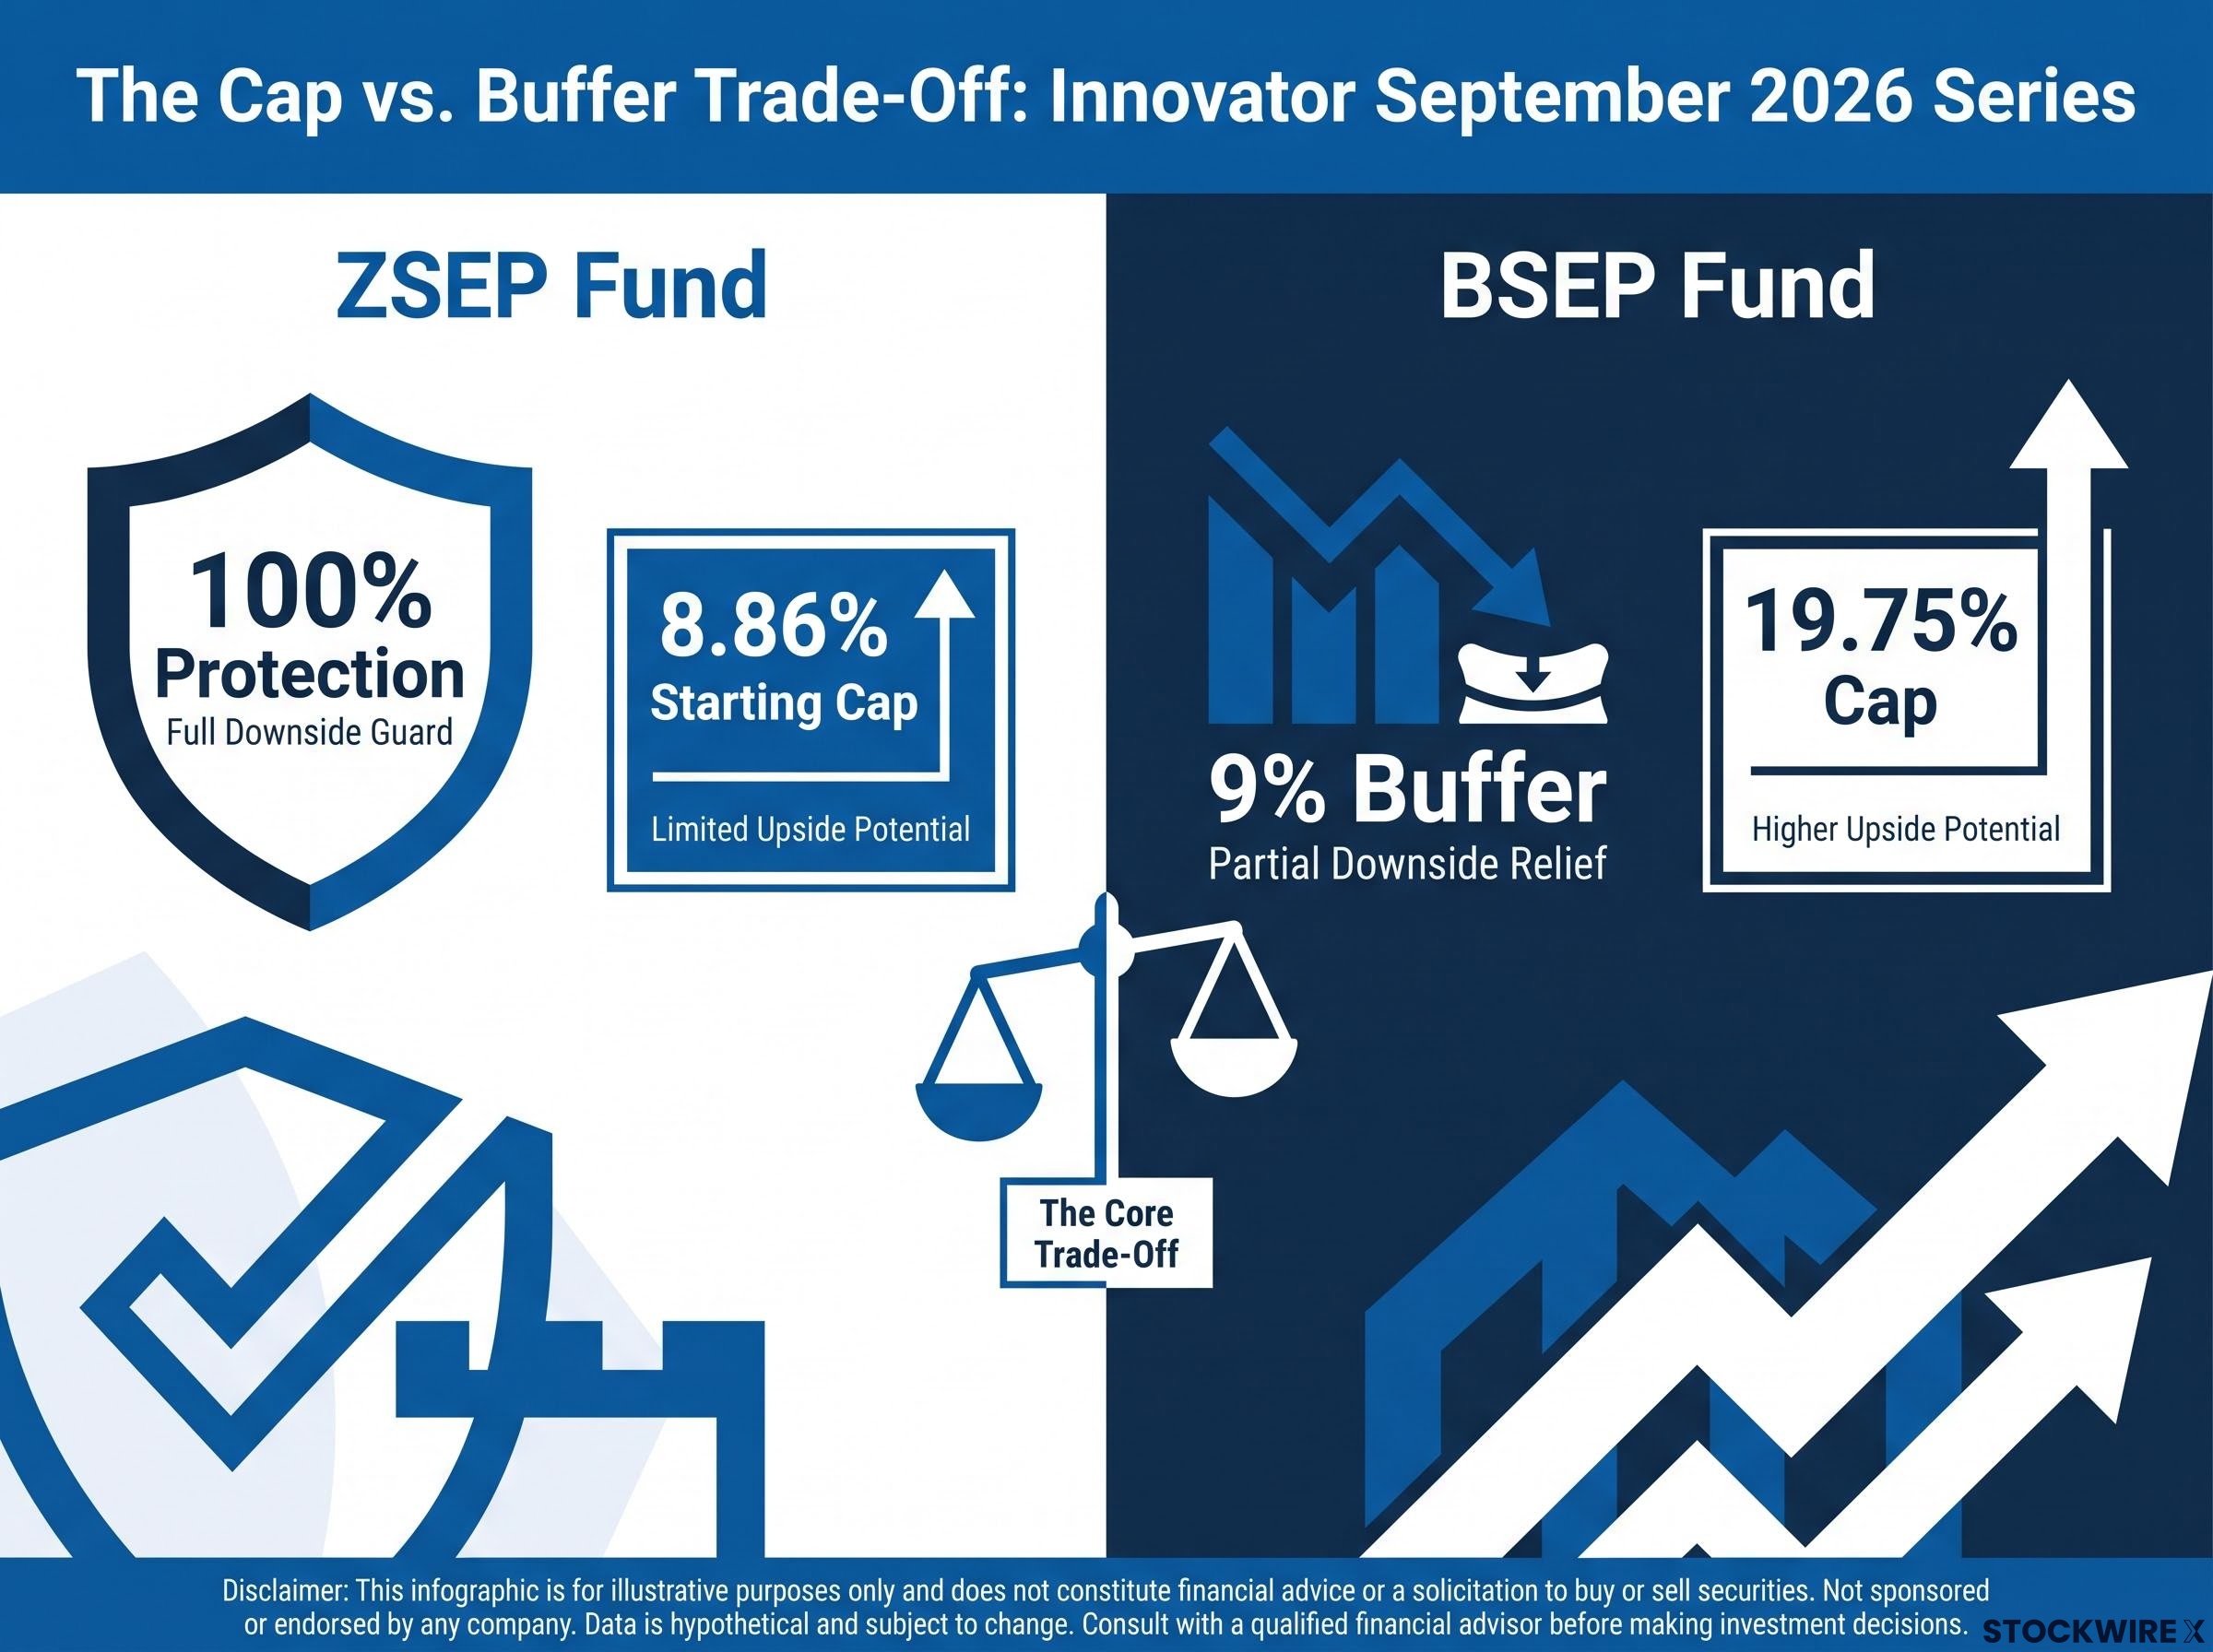
Innovator’s September 2026 series makes it concrete. The ZSEP fund offers 100% protection with a starting cap of just 8.86%. The BSEP fund in the same series offers a far shallower 9% buffer but lifts the cap to 19.75%. Same provider, same underlying index, same start date. The only thing that changed is how much floor you asked for, and the cap paid the price.
When big ASX news breaks, our subscribers know first
How cap rates are set, and why they change every cycle
The cap on your factsheet is not a decision the fund company made about how generous to be. It is a price, set by the options market at the moment your outcome period begins, and it reflects conditions on that specific day.
Three live inputs determine it: the prevailing risk-free interest rate, the implied volatility of the underlying index (how much the market expects it to swing), and the expected dividends on that index. When rates and volatility are high, caps are generous. When both are subdued, caps compress.
Here is how each driver pushes the cap:
| Driver | When it rises | When it falls |
|---|---|---|
| Risk-free interest rate | Supports a higher cap | Compresses the cap toward Treasury yields |
| Implied volatility | Raises option premiums, funding a higher cap | Lowers premiums, reducing the cap |
| Expected dividends | Higher dividends reduce financing available for the cap | Lower dividends free up room for a higher cap |
The mechanics behind that cap follow a set sequence:
- The fund takes investor proceeds and buys the long put that creates your protection.
- It sells a put at a lower strike to offset part of that cost.
- It sells a call, and the premium that call fetches in the current market is what funds the structure.
- The clearing price of those options, given that day’s rates and volatility, determines exactly where your cap lands.
The rate environment has been working in your favour lately. According to the research, rising interest rates have let 100% protection ETFs potentially deliver roughly twice the prevailing risk-free rate. Calamos, for example, launched an October 2026 series with an initial cap of about 8.47% on its 100% protection tier.
But that dynamic cuts both ways. If rates fall meaningfully, caps on full-protection products can sink close to CD or Treasury yields, at which point the product’s whole case weakens: why cap your equity upside for a return you could get from a certificate of deposit?
If you are evaluating one of these funds today, understand that the cap you see is a product of September 2026 conditions. A different rate or volatility environment a year from now will produce a different number, and that variability is built into the product. To smooth out entry timing, some issuers stagger their launches; Calamos runs 12 monthly-resetting series at once so investors always have a fresh starting point available.
The tax advantage that separates these ETFs from their alternatives
Now for the part that surprises most people. If you are comparing a buffered ETF against the products that promise something similar, a market-linked CD from your bank or an insurance annuity, the tax code quietly tilts the field.
Start with the alternatives, because they are where the disadvantage sits. Structured notes, market-linked CDs, and insurance-wrapped protection products such as annuities generally hand you gains taxed at ordinary income rates. For a higher earner, that is the least favourable rate the tax code offers.
Market-linked CDs are one of the most common alternatives investors weigh against buffered ETFs, but their ordinary income tax treatment and limited liquidity before maturity change the after-tax comparison more than most product comparisons reveal.
Gains inside a buffered ETF work differently. When you sell, they can qualify for long-term capital gains treatment, a materially better outcome if you sit in one of the upper brackets.
There is a further wrinkle that works in your favour. Broad-based index options, such as SPX options, count as Section 1256 contracts under the Internal Revenue Code. That designation carries an automatic 60/40 split: 60% of the gain is treated as long-term and 40% as short-term, regardless of how long the fund actually held the position. You report it on IRS Form 6781.
Look for the Section 1256 60/40 treatment when you read your ETF’s prospectus. It is the mechanism that gives the wrapper its tax edge, and it applies automatically to qualifying broad-based index options.
Consider what that means in dollars. An investor in the 32% ordinary income bracket who takes a gain through an annuity or market-linked CD pays that full rate. The same gain routed through capital gains treatment could be taxed at 15% for the long-term portion. That gap can outweigh a lower headline cap.
| Product type | Tax treatment on gains | Liquidity | Guarantee status |
|---|---|---|---|
| Buffered ETF | Potential long-term capital gains; Section 1256 60/40 on qualifying options | Daily, exchange-traded | Options-based target, not guaranteed |
| Market-linked CD | Generally ordinary income | Typically locked until maturity | FDIC-insured |
| Annuity | Generally ordinary income | Limited, often with surrender charges | Insurer guarantee |
One caveat keeps this honest. Not every option position inside every ETF qualifies under Section 1256. Certain customised or over-the-counter FLEX options can trip complex straddle rules instead, which changes the treatment. So if a buffered ETF is going in a taxable account, comparing after-tax outcomes against a CD or annuity, rather than pre-tax cap rates, is the comparison that actually decides the question. Verify the treatment in the specific prospectus before you assume it applies.
When timing and entry point make or break the outcome
This is the section the marketing does not put on the front page. The whole promise of these funds carries a condition attached, and if you miss it, the payoff you signed up for is not the payoff you get.
The rule is unforgiving. The cap and buffer apply only if you buy at the start of the outcome period and hold to the end. Any other entry or exit produces a different result, and often a worse one.
Walk through the three ways you can enter:
- Buying at the period start (the intended use): you get the full cap and the full buffer exactly as advertised.
- Buying mid-period after a decline (the dangerous one): if the index has already fallen through part or all of the buffer, that protection is spent. You now face further downside with little or no floor left, while still capped on the upside. The worst of both sides.
- Buying mid-period after a rally (buffer intact, cap reduced): the buffer may still stand, but because the index has risen toward the cap, your remaining room to gain has shrunk.
That second scenario is the one that catches people. You buy for protection after a market drop, precisely when you feel you need it most, and discover the protection went to whoever held the fund on day one.
Recency bias is also the force that drives some of the worst timing decisions with buffered ETFs: investors reach for downside protection after markets have already fallen, precisely when the buffer has been partially consumed by whoever held the fund from day one.
An AQR analysis found that 83% of surveyed buffer ETFs experienced worse peak-to-trough drawdowns than a period-matched stocks-plus-cash benchmark.
Read that figure carefully, because it reframes the entire product. Buying a buffer ETF mid-period in a falling market is not merely suboptimal; it can leave you worse off than if you had simply held cash alongside an index fund. The word “safe” turns into “conditional.”
The long-run numbers reinforce the point. Russell Investments analysis showed buffer ETFs underperforming the underlying index by roughly 4% annually on average over time. Add expense ratios running 0.74% to 0.85%, against a few basis points for a broad index ETF, and the drag compounds. The staggered monthly reset lineups, like Calamos’s 12-series structure, exist partly to solve the entry-timing problem by giving you frequent clean starting points.
What selling before the outcome period ends actually means for your return
Exiting early carries its own trap, separate from liquidity. You can sell the ETF any trading day; that is never in question.
What is in question is what you receive. Sell before the period ends and you get the mid-period net asset value, which reflects current options pricing, not a tidy pro-rata slice of the stated outcome.
The result can feel arbitrary if you do not understand options. The market might be down modestly while your fund is down more, or up less than you expected, because the value of the underlying options has not yet converged on the outcome that only crystallises at expiration. The cap and buffer are end-of-period truths, not daily ones.
Who these products are actually built for, and who should avoid them
Strip away the pitch in either direction and the real question is simple: does your situation match how this product delivers? These are neither a trap nor a miracle. They are a specialised tool, and tools have jobs they do well and jobs they do badly.
Adoption tells you they have found a home somewhere. As of early 2026, the category held roughly $89 billion across 487 products from 19 issuers, much of it in the advisor channel. Compared with structured notes, which are typically illiquid until maturity, buffered ETFs offer daily liquidity and transparent exchange pricing, which explains a good part of that shift.
Profiles that fit
- Near-retirees and capital-preservation-focused investors who want equity exposure but need explicit limits on how far a drawdown can go.
- Advisors replacing structured notes or insurance products who value daily liquidity, transparent pricing, and a defined outcome they can explain to a client in one sentence.
- Tactical satellite allocations in volatile markets, where a defined outcome adds a measure of predictability to part of the portfolio.
Profiles that do not fit
- Long-horizon accumulation investors for whom the cap steadily erodes compounding across ten-plus-year holding periods.
- Dollar-cost averagers whose regular contributions cannot line up cleanly with annual or quarterly outcome periods, breaking the alignment the payoff depends on.
- Behaviourally volatile investors who tend to abandon protection the moment a strong bull run makes the cap feel like a cage.
The unifying theme is that capped gains erode long-run performance against plain index funds. That is why these belong as satellite or tactical allocations, not as a replacement for the core of a growth portfolio. For a reader deciding whether to include one, the honest question is less about the product and more about whether your time horizon and your temperament fit the way it pays out.
Making the right call before you commit to a defined-outcome product
Everything in this guide reduces to a handful of questions you can answer before you spend a dollar. Work through them, and you sharply cut the odds of the single biggest source of disappointment with these funds: a return that diverges from what you expected.
- Am I buying at or near the start of the outcome period? If not, the advertised cap and buffer may not describe what you will actually receive.
- Do I understand what is driving this cap right now? The number reflects today’s rates and volatility. Comparing it to a prior period’s cap or a competitor’s cap only makes sense once you account for the market environment that produced each.
- Have I compared after-tax outcomes against the alternatives? Run the buffered ETF against a market-linked CD or annuity on an after-tax basis, and confirm Section 1256 treatment in the specific prospectus rather than assuming every fund carries it.
- Does my time horizon and behaviour fit the delivery mechanism? A long-horizon compounder or a serial early-seller is fighting the product’s design.
Remember that caps and buffers reset every cycle, and that with 19 issuers now competing, genuine product comparison is due diligence, not a coin flip. Tools like monthly-reset series lineups can help you manage entry timing, but they do not change the underlying maths.
Our full explainer on retirement asset allocation frameworks covers how modern approaches replace age-based heuristics and where capital-protection instruments fit within a properly structured glide path.
This article is for informational purposes only and should not be considered financial advice. Investors should conduct their own research and consult with financial professionals before making investment decisions. Past performance does not guarantee future results. Financial projections are subject to market conditions and various risk factors.