Conservative capital has always had a home. For decades, the assumption held that money seeking safety flows into government or corporate debt, and the bond market absorbed trillions on that logic alone.
That assumption is fracturing. One of the largest reallocations of conservative capital in modern portfolio construction is happening well outside the bond market, and it is being routed through derivatives instead.
The traditional 60/40 portfolio, 60% equities and 40% bonds, was built on a simple promise: when stocks fell, bonds rose to cushion the blow. But positive stock-bond correlations have broken that hedge, leaving advisors to manufacture yield and drawdown protection somewhere new. Options strategies for advisors have moved from a niche tactic to a mainstream substitute for fixed income, which raises the central question this analysis answers: is replacing bonds with derivative overlays a genuine structural upgrade, or a hidden concentration of risk dressed up as innovation?
The 60/40 portfolio breakdown in 2022 was not a one-year anomaly but the exposure of a regime-dependent flaw, namely that positive stock-bond correlation during inflationary shocks dissolves the hedge that four decades of falling rates had made to appear structural.
Tracking the great capital rotation into defined outcomes
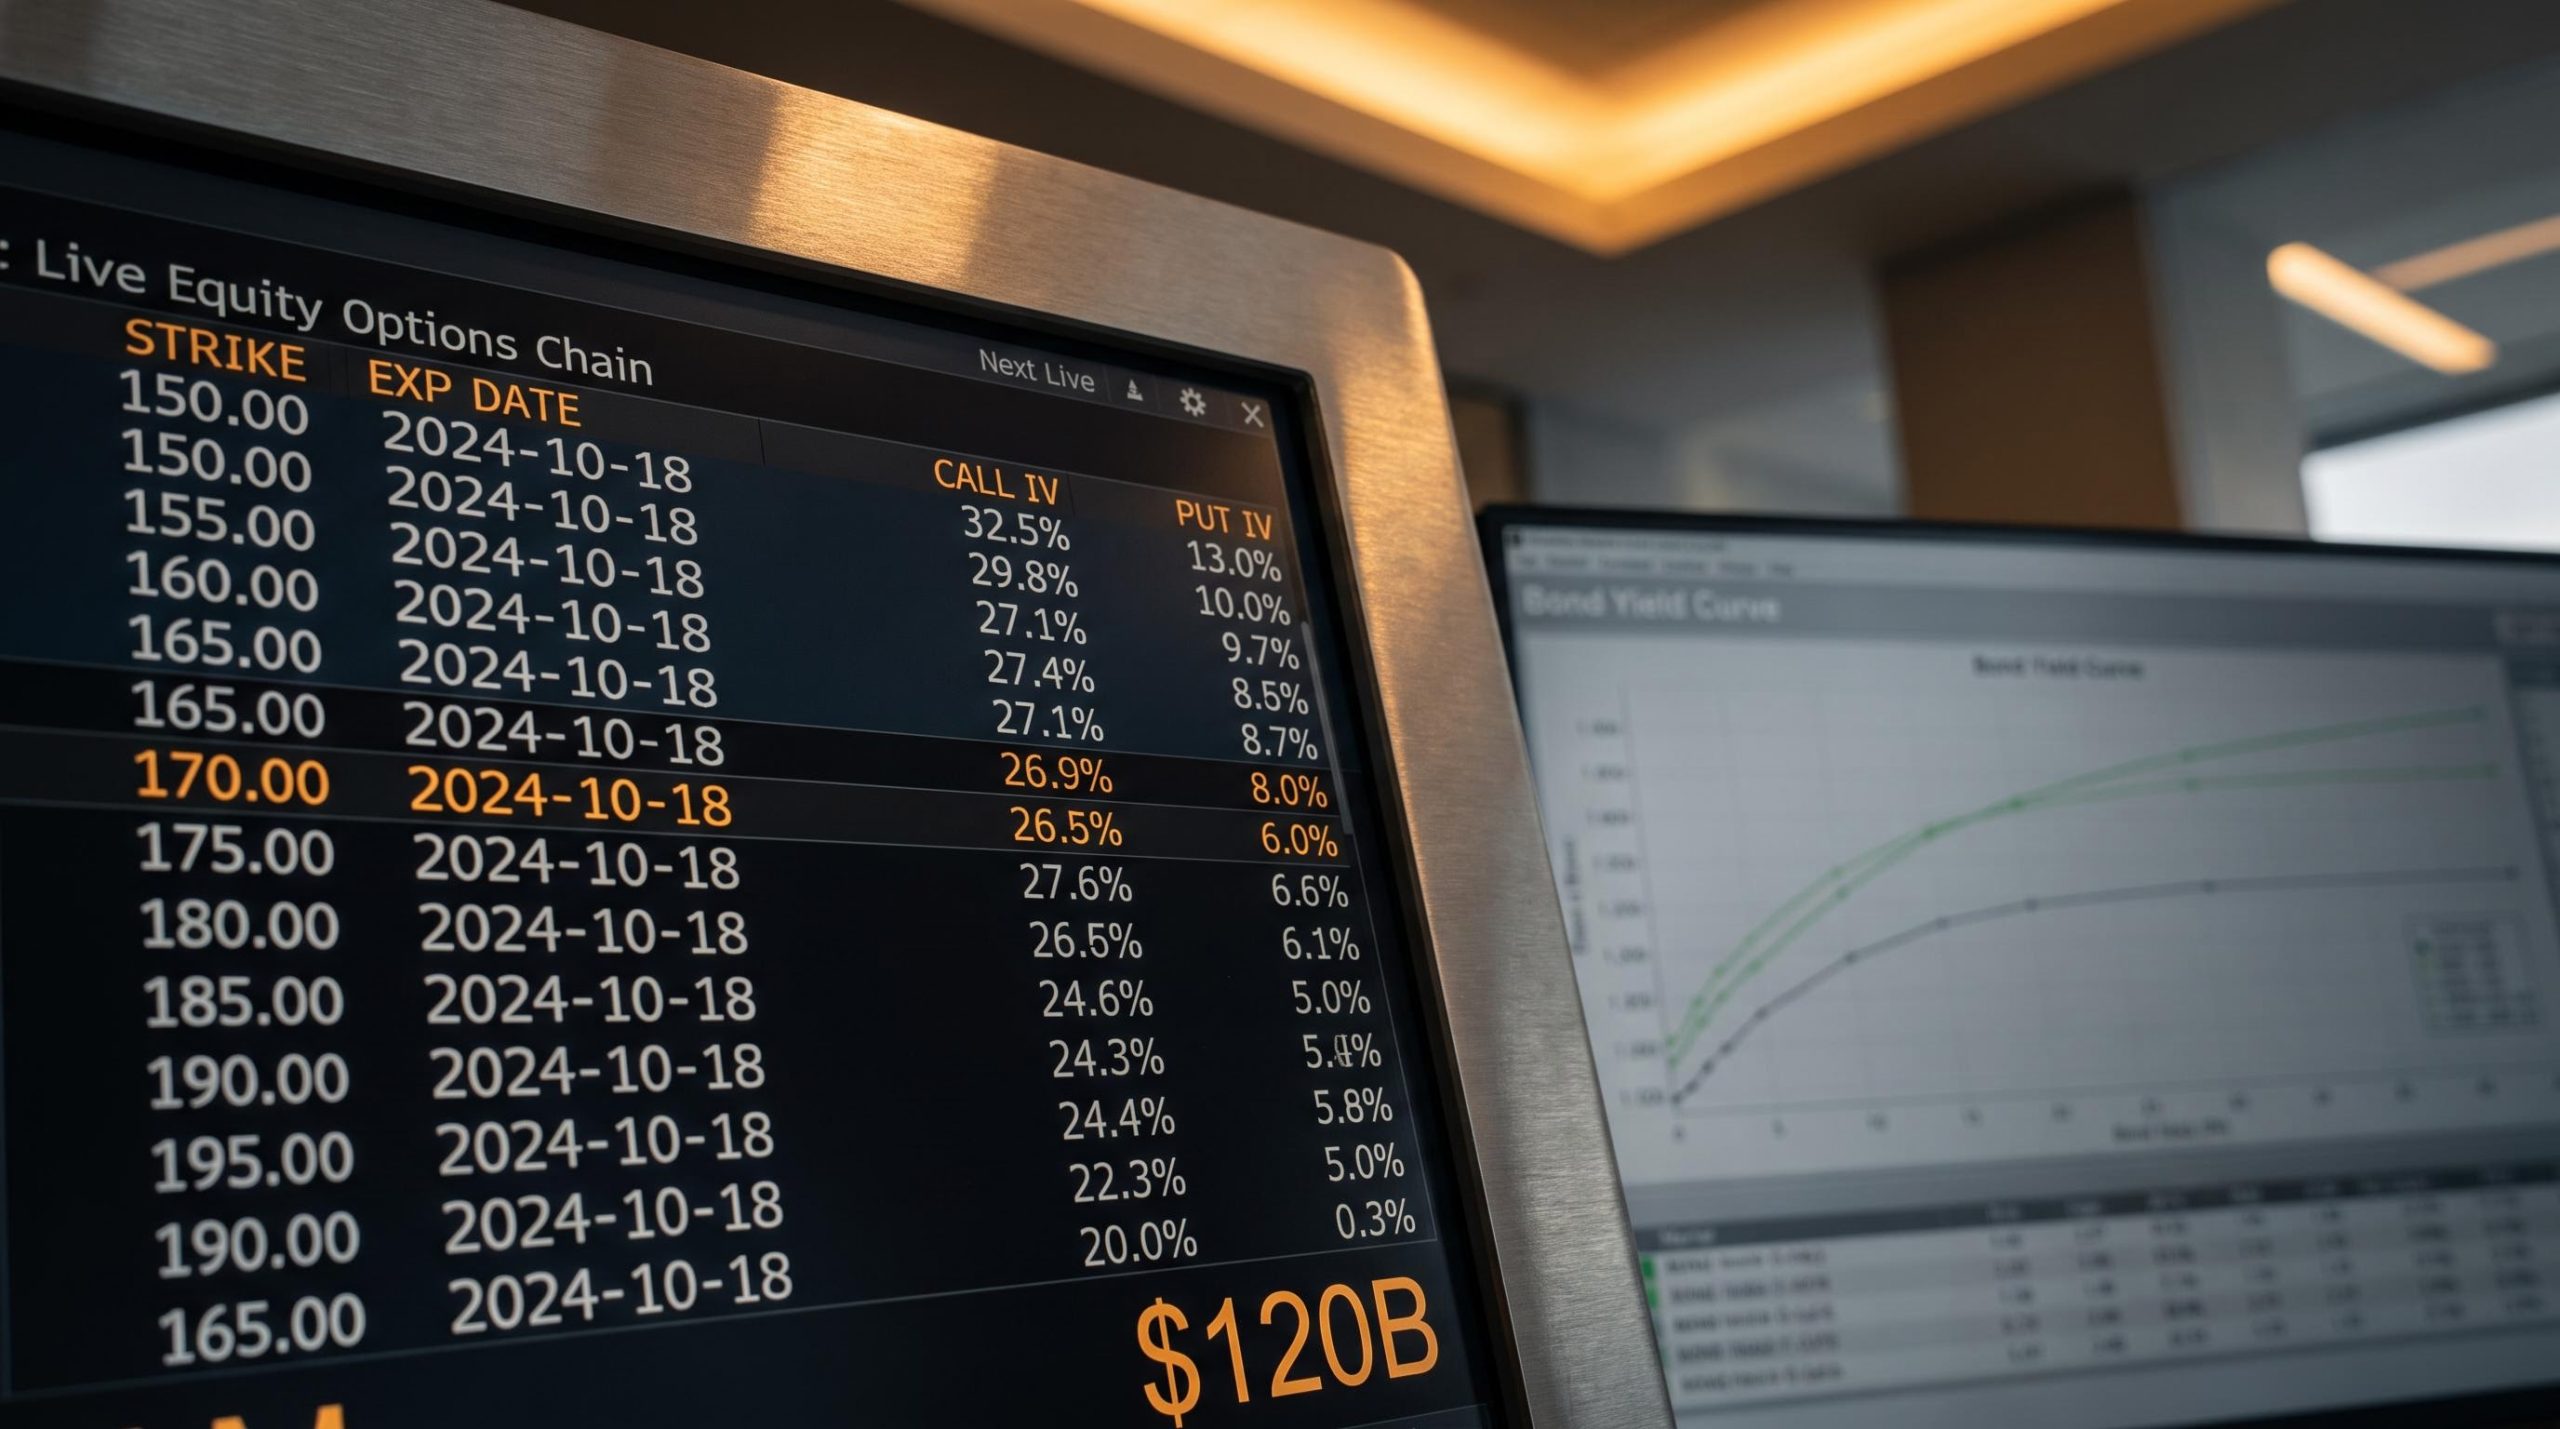
The scale of this migration is the first thing that should reset your expectations. Defined-outcome and options-income exchange-traded funds (ETFs) have grown from a sub-$10 billion niche a decade ago into a segment holding roughly $70 billion to $120 billion globally as of late 2025. This is not a cyclical fashion. It carries the fingerprints of a permanent shift in how portfolios are constructed.
J.P. Morgan ETF research tracking mid-2026 flows puts options-based ETF assets in the US alone at approximately $280 billion, a figure that underscores how far this segment has grown beyond the sub-$10 billion niche it occupied a decade ago.
The adoption data reinforces the point. According to the 2024 CAIS-Mercer survey, 92% of US financial advisors now incorporate alternatives into client portfolios, and 91% plan to increase those allocations over the next two years. Half of all advisors already commit more than 10% of client capital to alternatives.
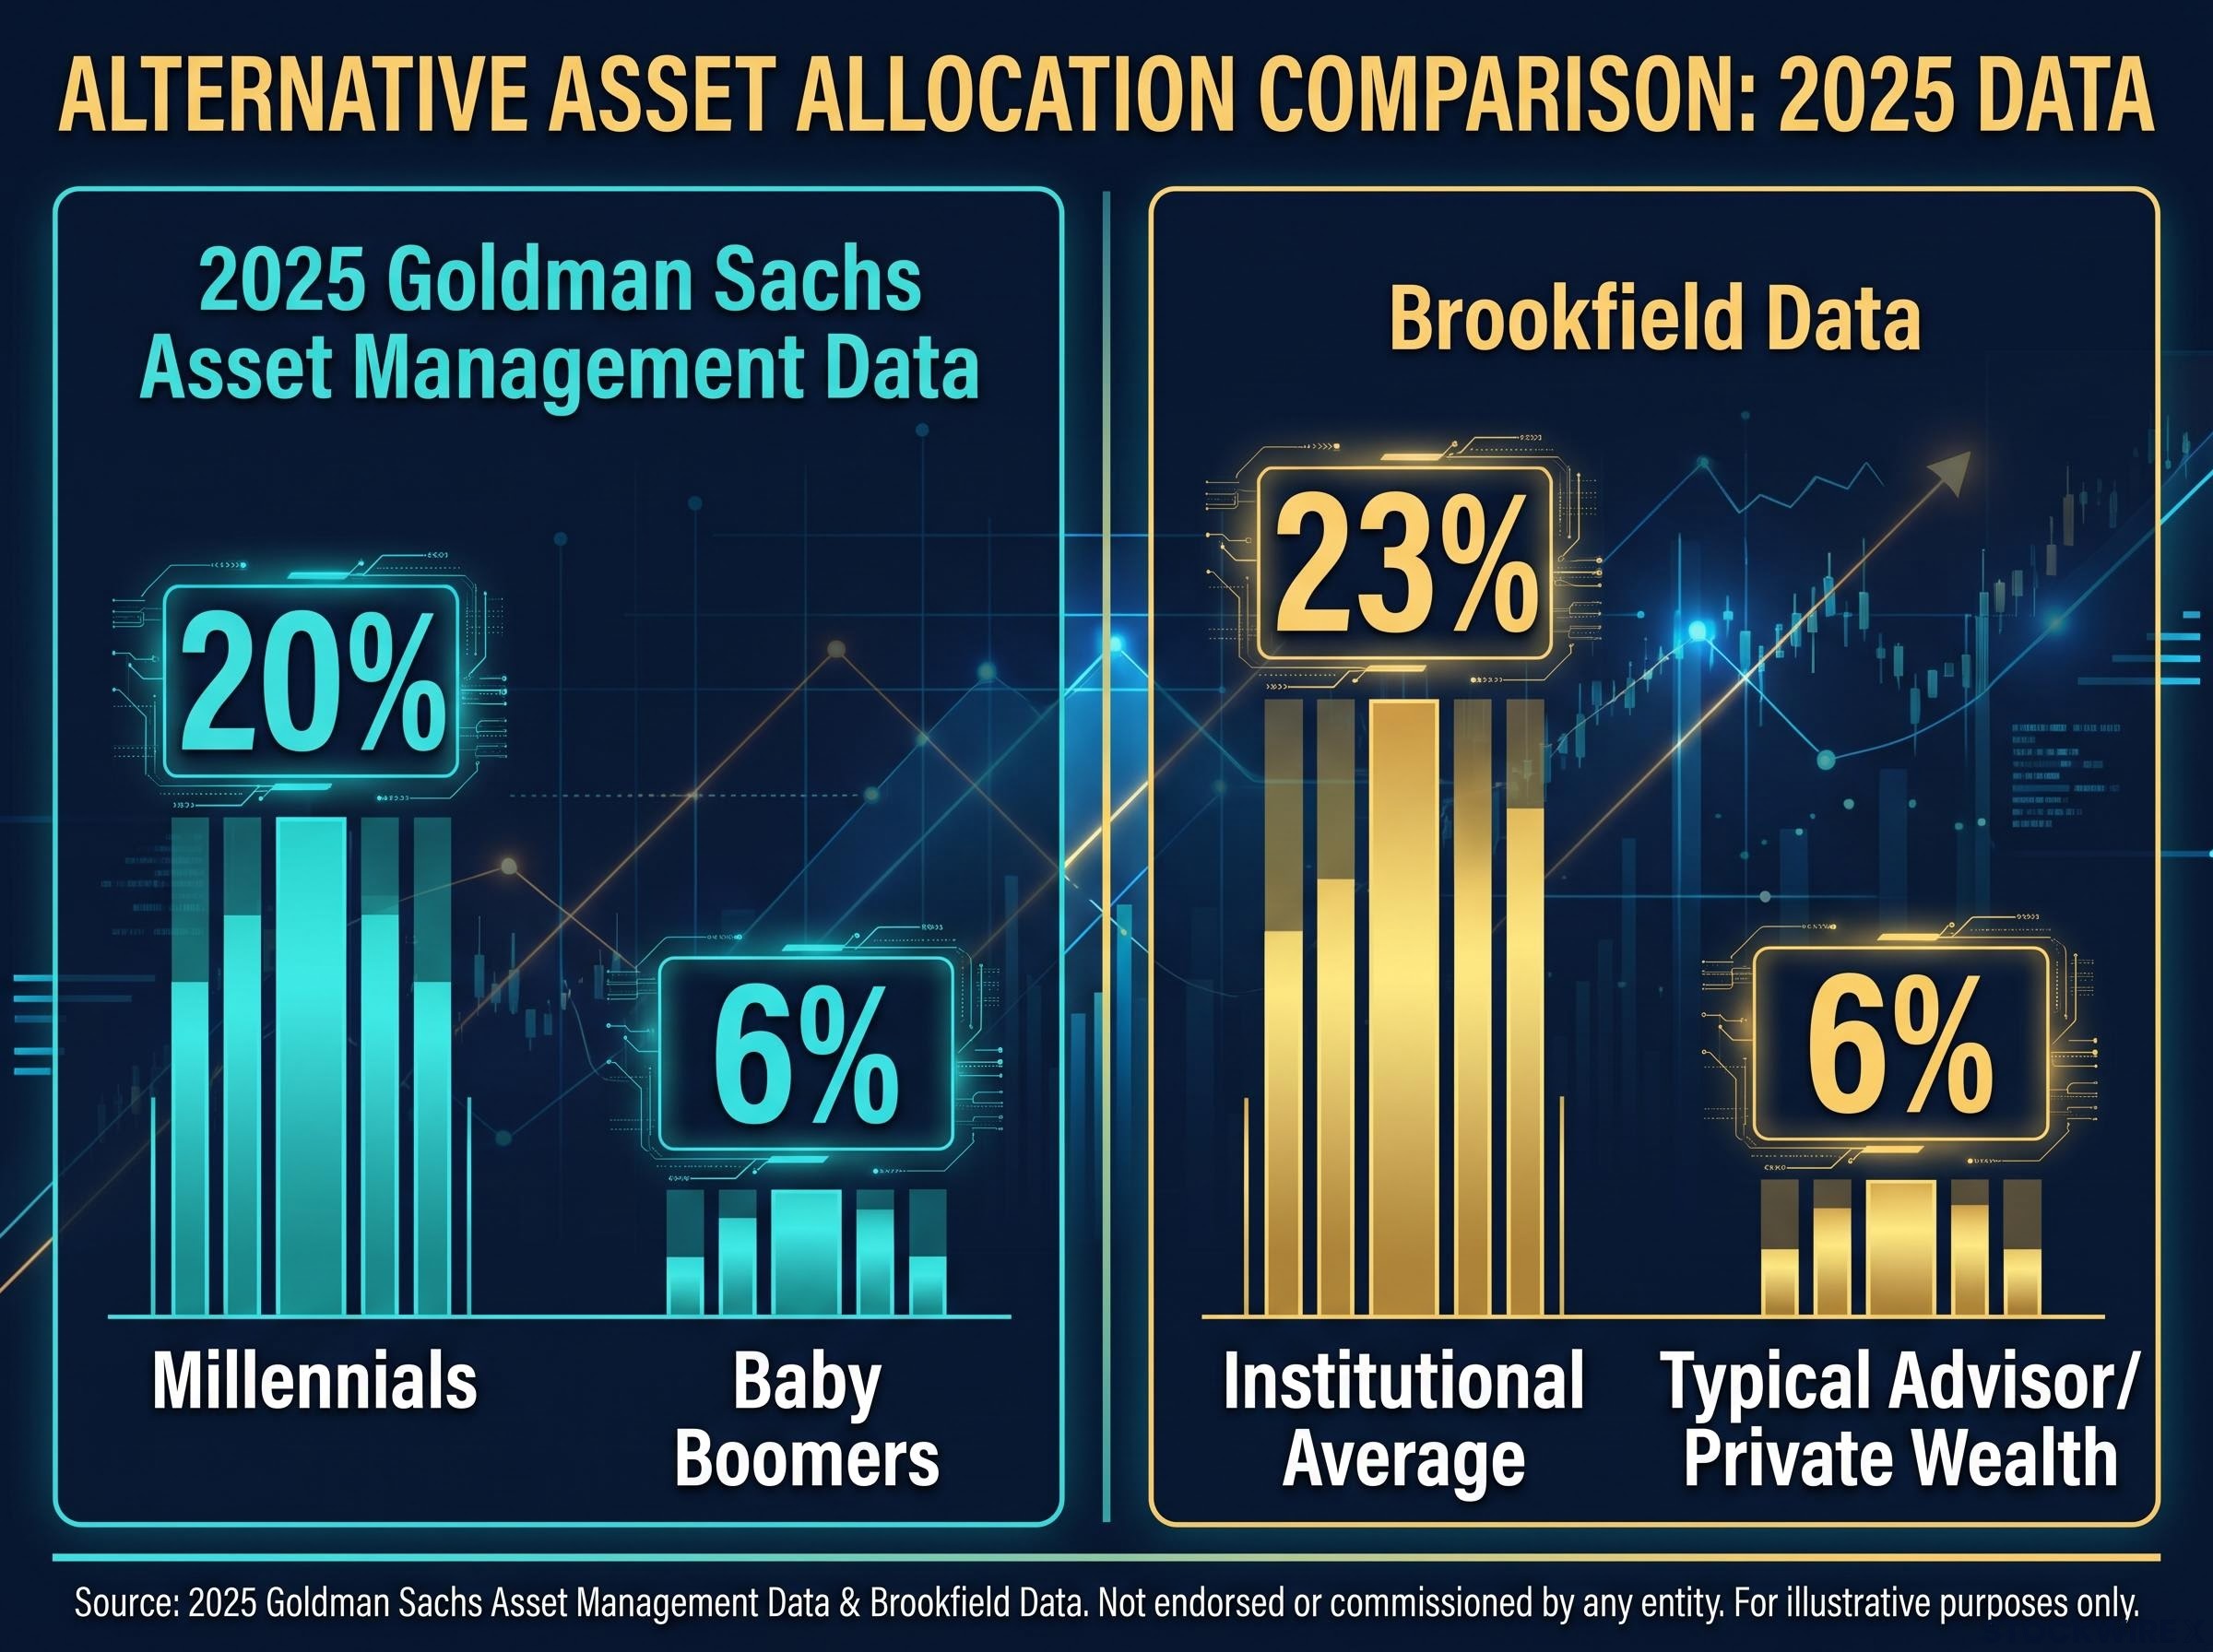
The uptake is far from uniform, and the gaps tell you where conviction is strongest. Goldman Sachs Asset Management research from 2025 found millennials allocating roughly 20% of their portfolios to alternatives, against about 6% for baby boomers. Brookfield data puts the institutional average near 23%, while the typical advisor and private wealth allocation sits closer to 6%, a reminder that institutions are still leading and much of the retail advisory channel remains hesitant.
Meanwhile, the traditional bond allocation itself is thinning. Vanguard research from 2024 shows most advisors allocate 20% or less to international bonds, against Vanguard’s own strategic recommendation of 40%. Capital that would once have anchored a fixed income sleeve is being redirected.
| Segment type | Estimated global AUM (2025) | Primary institutional use case | Typical advisor allocation |
|---|---|---|---|
| Defined-outcome (buffer) ETFs | ~$78B (Morningstar, 420 funds) | Drawdown mitigation with defined caps | Satellite, single digits |
| Covered-call / options-income ETFs | ~$84.3B (covered-call subset) | Premium income to substitute coupons | Satellite income sleeve |
| All equity options-strategy ETFs | ~$120B (Bloomberg Intelligence) | Equity risk dampening, real yield | Growing, still minority |
| Traditional international bonds | Broad, declining share | Diversification and duration | 20% or less (vs 40% recommended) |
The market is also concentrated. First Trust manages nearly $40 billion across 110 products, and Innovator oversees roughly $27.5 billion. The flows into buffer and covered-call funds tell you your peers are aggressively shedding interest rate risk. The decision left to you is whether to follow that herd or exploit the value being left behind in the assets they are abandoning.
When big ASX news breaks, our subscribers know first
How derivative overlays engineer bond-like behaviour
If bonds no longer reliably generate yield or cushion drawdowns, how do these products manufacture the same outcomes? The answer lies in three options structures, and understanding them stops you treating these ETFs as black boxes.
An option is a contract giving the buyer the right to buy or sell an asset at a set price by a set date. The seller collects a premium, an upfront payment, for taking on that obligation. That premium is the raw material of manufactured yield.
- Covered calls: The fund holds a stock or index and sells call options against it, collecting premium income. In exchange, it caps how much it can gain if the asset rises sharply. This trades upside for cash flow.
- Cash-secured puts: The fund sells put options and sets aside cash to buy the asset if prices fall. It collects premium now, accepting the obligation to purchase at a lower price later.
- Buffer spreads: The fund combines options to absorb a defined slice of losses (say the first 9% to 15%) in return for a cap on gains over a set outcome period. This is downside protection with a ceiling attached.
Buffer structures dominate the defined-outcome space. Cboe Global Markets reports that 98% of outcome-based ETF assets sit in buffer strategies, with about $52 billion in the popular 9-15% buffers and nearly $13 billion in deeper 15-40% buffers. The appetite skews toward moderate protection over maximum insurance.
Some managers go further to smooth the ride. Firms like Calamos anchor their auto-callable products to stabilised volatility and dividend inputs rather than passively accepting whatever the market prices, aiming for a more uniform investor experience. The common thread is that all of these strategies monetise market fear: the more nervous the market, the richer the premiums.
Trading duration risk for volatility risk
Here is the shift that matters most for how you protect client capital. A treasury bond carries duration risk, the danger that rising interest rates erode its price. Options overlays eliminate that risk almost entirely, because they are equity-linked rather than rate-linked.
What they introduce instead is implied volatility risk. Implied volatility is the market’s expectation of how much an asset will swing, and it directly determines how much premium an options strategy earns. When volatility spikes, the payout profile of an options collar becomes path-dependent, meaning the final outcome hinges on the route prices take, not just where they end up.
Implied volatility is extracted by reverse-engineering live option prices rather than from historical data, making it a real-time measure of collective market expectation about future price swings; when that figure rises, every premium-selling strategy in a buffer or covered-call fund earns richer income, but also takes on larger mark-to-market risk if the volatility environment shifts mid-cycle.
A treasury coupon is predictable and arrives on schedule regardless of market drama. An options overlay’s return depends entirely on the volatility environment it was written into. Understanding this trade means you are no longer relying on central bank policy to defend a portfolio. You are actively selling fear to generate income, and that changes the risk you are underwriting.
The empirical reality of options overlays during market shocks
Theory is generous to these products. The historical record is more honest, and it is where advisors need to slow down before repeating a wholesaler’s pitch to a client.
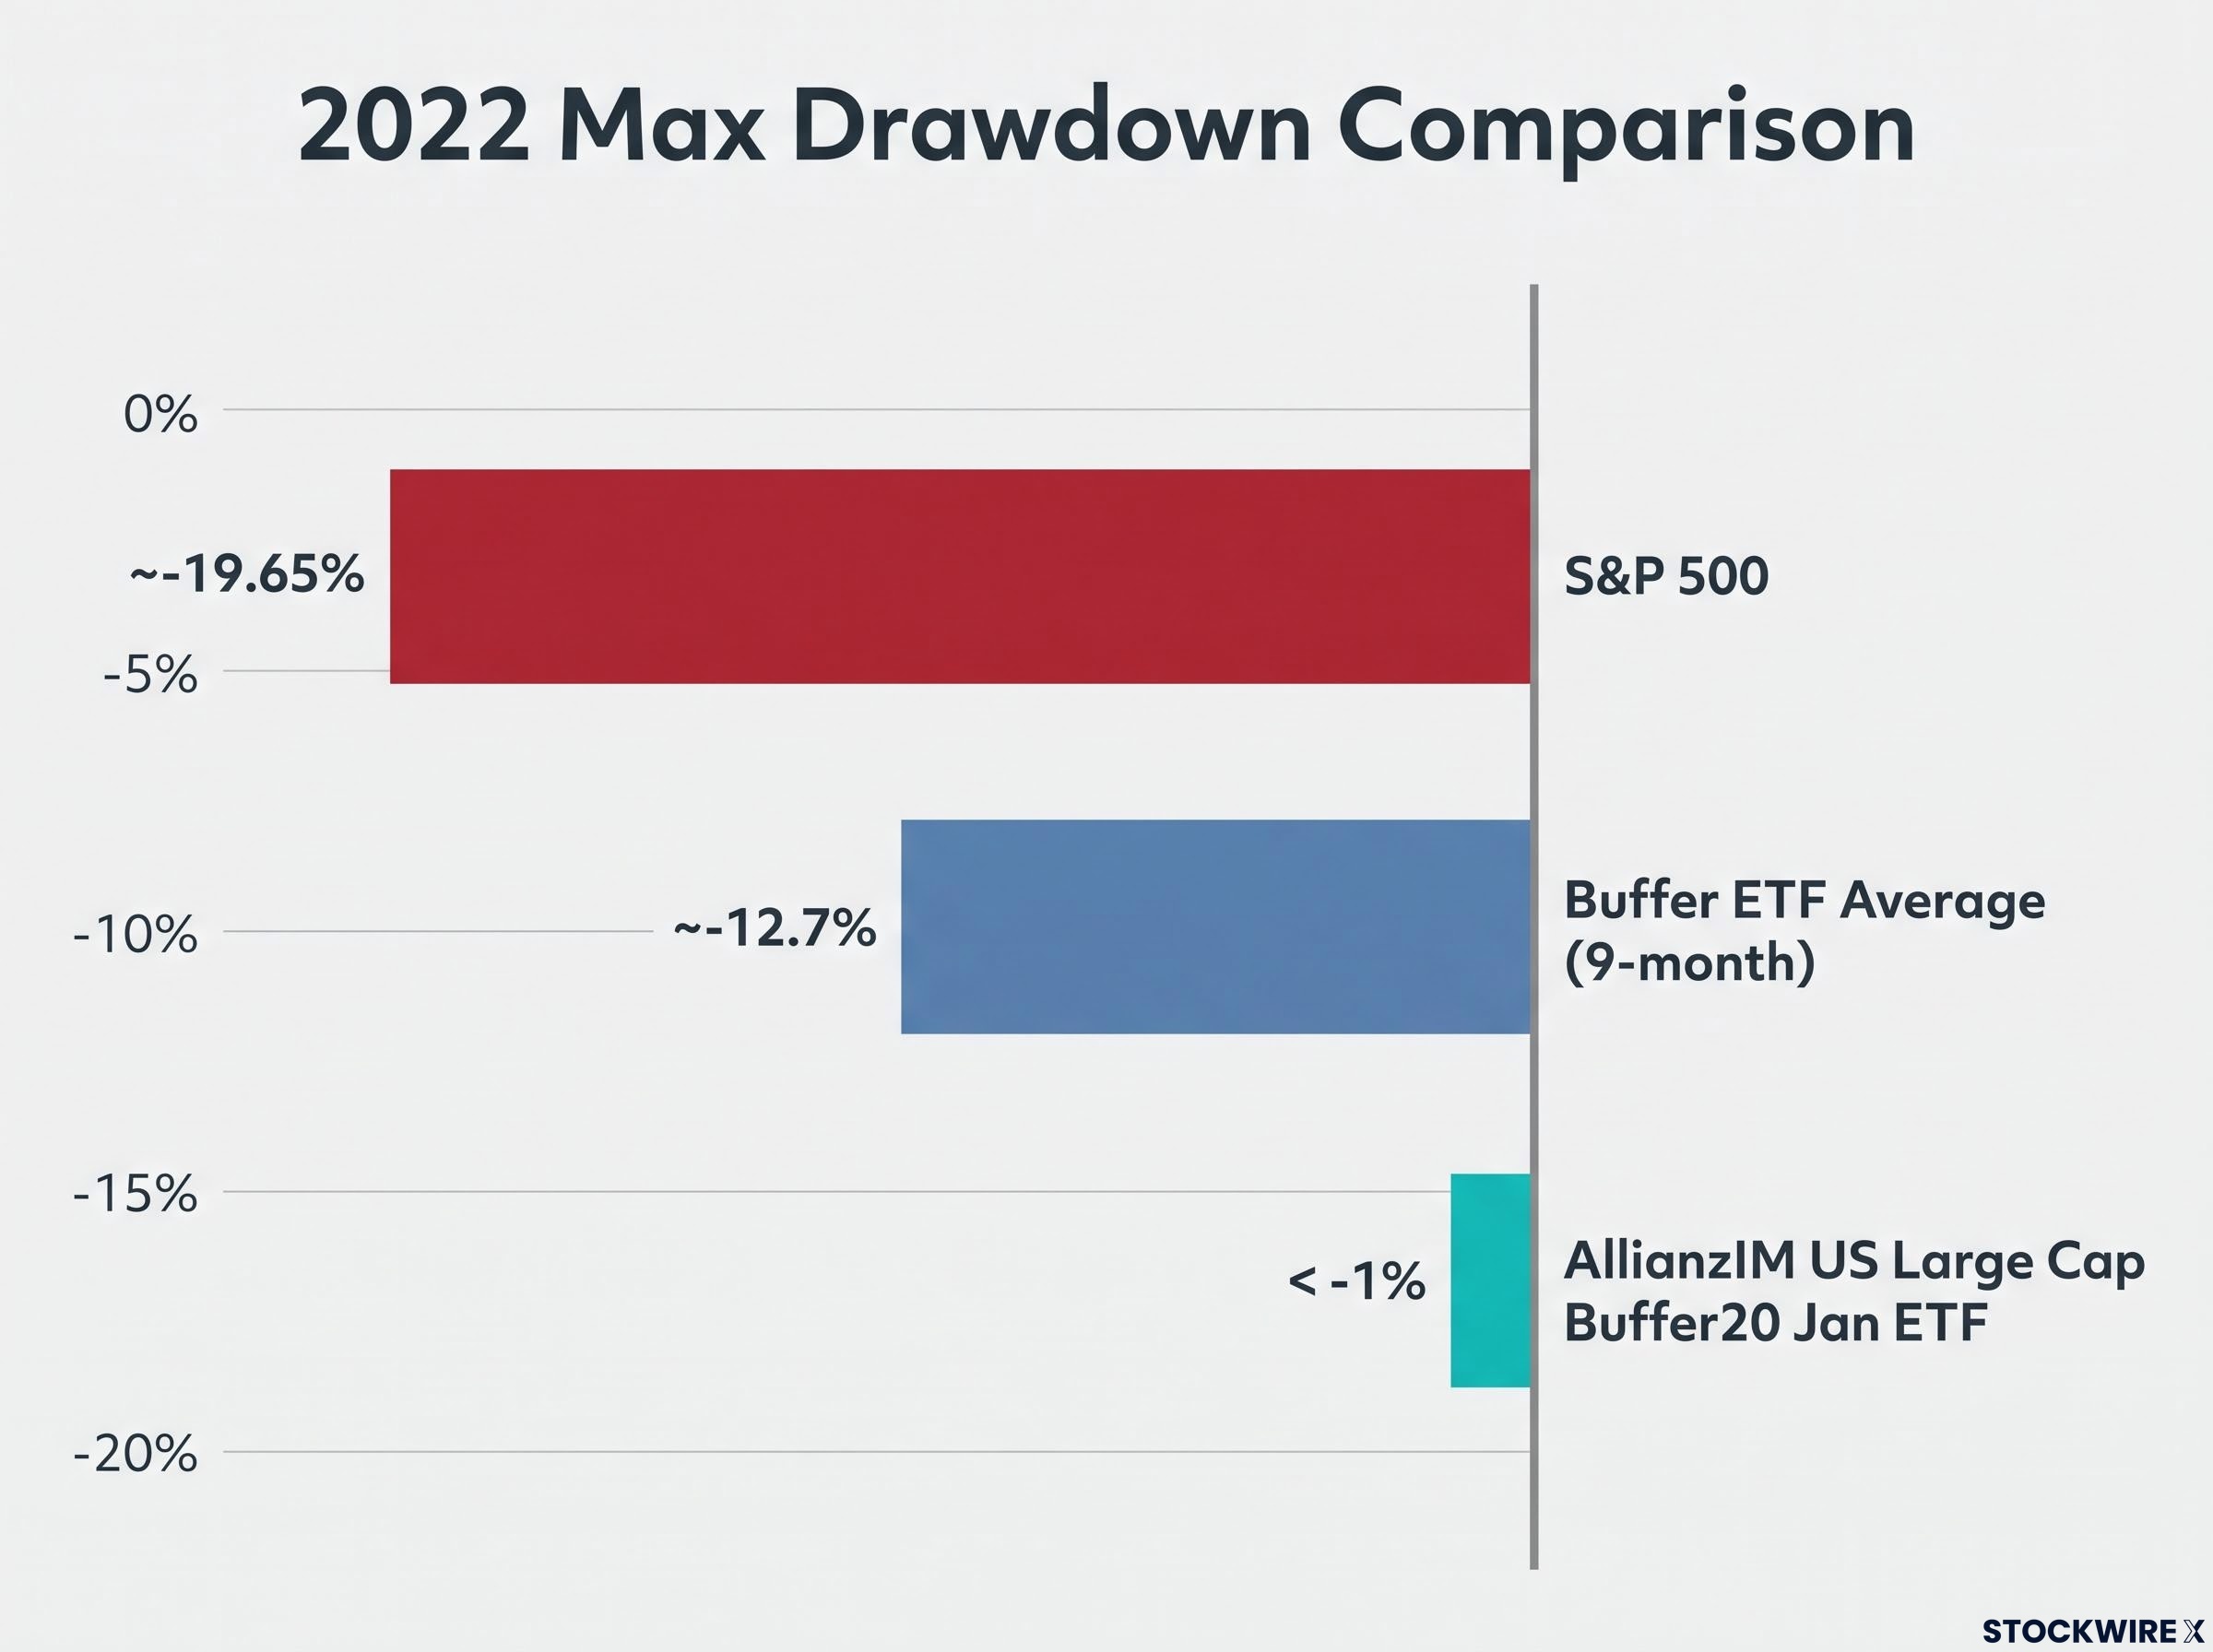
The 2022 bear market offered the first serious stress test. Buffer funds fell about 12.7% on average over the first nine months, roughly half the near 20% decline of the broader equity market. Standout examples went further: AllianzIM’s US Large Cap Buffer20 Jan ETF limited its 2022 loss to under 1%, against an S&P 500 fall of nearly 20%.
| Strategy | 2022 max drawdown | Volatility profile | Relative outcome |
|---|---|---|---|
| S&P 500 | ~-19.65% | High (~19%) | Full downside exposure |
| Buffer ETF average | ~-12.7% (9-month) | Reduced (~10%) | Roughly half the equity loss |
| Traditional 60/40 | Sharp, correlated year | Moderate | Lagged buffers over 2022-2025 |
A STOXX whitepaper analysing those drawdowns found buffer strategies delivered protection at roughly 10% volatility, well below the 19% of pure equities. On volatility reduction alone, the products did what they claimed.
The problem surfaces under the harshest shocks. An AQR review of three major drawdowns, including the 2020 Covid crash and a 2025 episode, found that more than 80% of buffer funds underperformed simple reference asset and cash benchmarks.
AQR’s research found that over 80% of buffer funds failed to beat plain equity-and-cash or reference asset baselines during three major drawdowns, suggesting that swapping bonds for buffers does not reliably improve outcomes when it matters most.
That finding is the pivot. Outcomes also varied sharply depending on when a position was bought relative to its option expiration cycle, so two advisors holding the same fund could experience very different results. The mixed record proves these overlays are not a passive fixed income replacement. To extract their protection, you have to time market entry deliberately, something you never had to do with a bond you simply held to maturity.
Diagnosing toxic yield and structural portfolio risks
The final skill is learning to distrust a headline yield. A double-digit distribution rate is not automatically income. Sometimes it is your client’s principal handed back to them in monthly instalments.
The distinction is between sustainable option premium and destructive return of capital. Return of capital happens when a fund pays out more than it earns, funding the difference by eroding its own net asset value (NAV), the per-share value of its holdings. That decay is often invisible if you watch only the distribution rate.
Covered call ETF selection that relies on headline yield alone systematically misprices income sustainability; the more diagnostic approach separates distribution streak length, lifetime payout growth, and total return context into distinct metrics, each of which can diverge sharply from what the raw yield figure suggests.
The danger intensifies on single-stock products. Options strategies written on highly volatile names like Nvidia or Tesla can advertise yields exceeding 100%, but a yield that high is mathematically impossible to sustain from premiums alone. It relies on NAV erosion, and analysts flag such figures as a warning rather than an attraction. Broad index overlays carry ordinary market risk; concentrated single-stock overlays carry structural risk on top of it.
Institutional desks evaluate this embedded risk with precise tools: net and bucketed vega by maturity (sensitivity to volatility changes), the profit-and-loss impact of skew and term-structure shifts, and liquidity stress-testing across different time horizons. Advisors do not need that machinery, but they do need a disciplined checklist:
- Check the NAV trajectory. If NAV is steadily falling while distributions stay high, the yield is eating the principal.
- Audit the distribution source. Separate genuine option premium from return of capital in the fund’s own reporting.
- Evaluate the underlying volatility. Compare the yield to the plausible long-run return of the underlying index. A yield far above it signals capital distribution, not income.
- Weigh the tax and structure drag. Charles Schwab flags that distributions are frequently taxed as short-term capital gains or ordinary income, alongside higher fees and capped upside.
When you see a double-digit distribution rate, treat it as a prompt to audit the volatility profile immediately. The frameworks above are what let you defend an allocation to a compliance department and protect a client from a monthly dividend that is quietly liquidating their capital.
Calibrating the modern income allocation
The evidence points to a measured conclusion rather than a wholesale replacement. Options strategies are powerful satellite tools for engineering income and dampening volatility in sideways or moderately choppy markets, but they are flawed as a complete substitute for high-quality fixed income.
Reinvestment capacity is the variable most advisors omit when constructing a covered-call sleeve: an investor spending distributions needs funds with unbroken payout streaks and high organic income ratios, while a compounder should prioritise total return and out-of-the-money call strategies that preserve equity upside and avoid capping the growth the strategy is meant to harvest.
The reason is specific. During deflationary shocks and sharp rate-driven downturns, treasury bonds can still deliver the negative correlation and principal stability that equity-linked overlays cannot. A hybrid approach that keeps genuine bonds for those scenarios and layers options overlays for range-bound or premium-rich conditions captures the strengths of both.
The practical shift for advisory practices is in risk profiling. The old conservative-moderate-aggressive questionnaire cannot capture the path-dependent, volatility-driven behaviour of defined-outcome products, and it will need to evolve to account for them honestly.
This article is for informational purposes only and should not be considered financial advice. Investors should conduct their own research and consult with financial professionals before making investment decisions.
Past performance does not guarantee future results. Financial projections are subject to market conditions and various risk factors.