
Start with the arithmetic, because that is where the discomfort begins. Apply even a modest 4% average interest rate across the roughly $40 trillion the United States owes, and once that debt fully rolls over, the annual interest bill lands near $1.6 trillion. That is one number, and it reshapes everything the government can afford to do.
Here is why it matters right now, not in some distant projection. Net interest is already eating a growing slice of the federal budget, and Treasury Secretary Scott Bessent has stepped directly into the bond market to keep long-term yields from climbing further. The math is not a forecast waiting to happen; it is already narrowing the government’s choices today.
What you are about to read gives you a framework for a single, uncomfortable idea: any lasting reversal in U.S. interest rates is far more likely to be forced by the bond market than chosen by policymakers. That distinction shapes your mortgage, your investments, and how you plan for the years ahead, and it deserves your attention.
The arithmetic that makes 5% rates fiscally unmanageable
Begin with the ratio, because the ratio is the whole story. The U.S. national debt sits at approximately $40 trillion. Federal revenue runs at roughly $5.5 to $6 trillion a year. So the government owes close to seven times what it collects annually.
The $40 trillion headline figure includes intragovernmental holdings that the government effectively owes to itself; publicly held debt, the roughly $32 trillion that requires ongoing external market demand and carries direct rollover risk, is the number that actually drives Treasury market dynamics.
Now layer the interest on top. At a 4% average rate applied across the entire debt load, annual interest payments approach $1.6 trillion once every maturing security has been refinanced at that level. That single line item would swallow a quarter to nearly a third of all federal revenue, crowding out almost everything else.
Roughly $1.6 trillion in annual interest at a 4% average rate. That is the number that makes every other budget priority a negotiation.
The good news, for now, is that the government is not paying 4% yet. According to tracking data, the weighted average interest rate across all marketable Treasury securities was 3.45% as of June 2026. The April 2026 breakdown showed 3.72% on Treasury bills, 3.19% on notes, and 3.38% on bonds. These figures are directionally reliable rather than independently confirmed, but the picture is consistent: the effective cost of the debt sits in the mid-3% range.
That mid-3% figure is the buffer. It is also the trap, because it only holds while old, cheaper debt remains on the books.
Treasury’s interest expense and average rate data shows a weighted average of approximately 3.49% across all outstanding debt as of August 2026, confirming that the buffer between current effective costs and the fiscally painful 4-5% range is real but narrowing with every rollover cycle.
| Scenario | Average Interest Rate | Annual Interest Cost (fully rolled over) | Share of Federal Revenue |
|---|---|---|---|
| Current effective rate | ~3.45% | ~$1.38 trillion | ~23-25% |
| 4% scenario | 4.00% | ~$1.6 trillion | ~27-29% |
| 5% scenario | 5.00% | ~$2.0 trillion | ~33-36% |
The Congressional Budget Office (CBO) projects net interest at 3.2% of GDP in 2025, rising toward a projected 5.4% by 2055, figures presented here as directional projections rather than confirmed current-year data. What this tells you is blunt: the U.S. is not approaching a fiscal cliff in theory. It already lives in a regime where the level of interest rates dictates what the government can and cannot afford, and any sustained move above 5% would tighten that constraint across every corner of public finance.
When big ASX news breaks, our subscribers know first
How the rollover trap turns a debt load into a debt spiral
The mechanism feels almost mechanical, which is exactly what makes it dangerous. Treasury debt matures constantly, and when it does, the government does not repay it from savings. It issues new debt to cover the old.
If prevailing yields are higher than the coupon on the maturing security, every rollover locks in a bigger interest bill. The debt stock itself keeps growing at the same time, so each new round of borrowing is calculated against a larger base. Follow that loop and it closes in on you.
- The government runs a primary deficit, meaning it spends more than it collects even before counting interest, so it must borrow.
- That new borrowing is issued at current yields, which are higher than the debt it replaces.
- Interest costs rise, widening the total deficit further.
- The wider deficit requires still more borrowing, enlarging the base on which the next round of interest is calculated. Then it repeats.
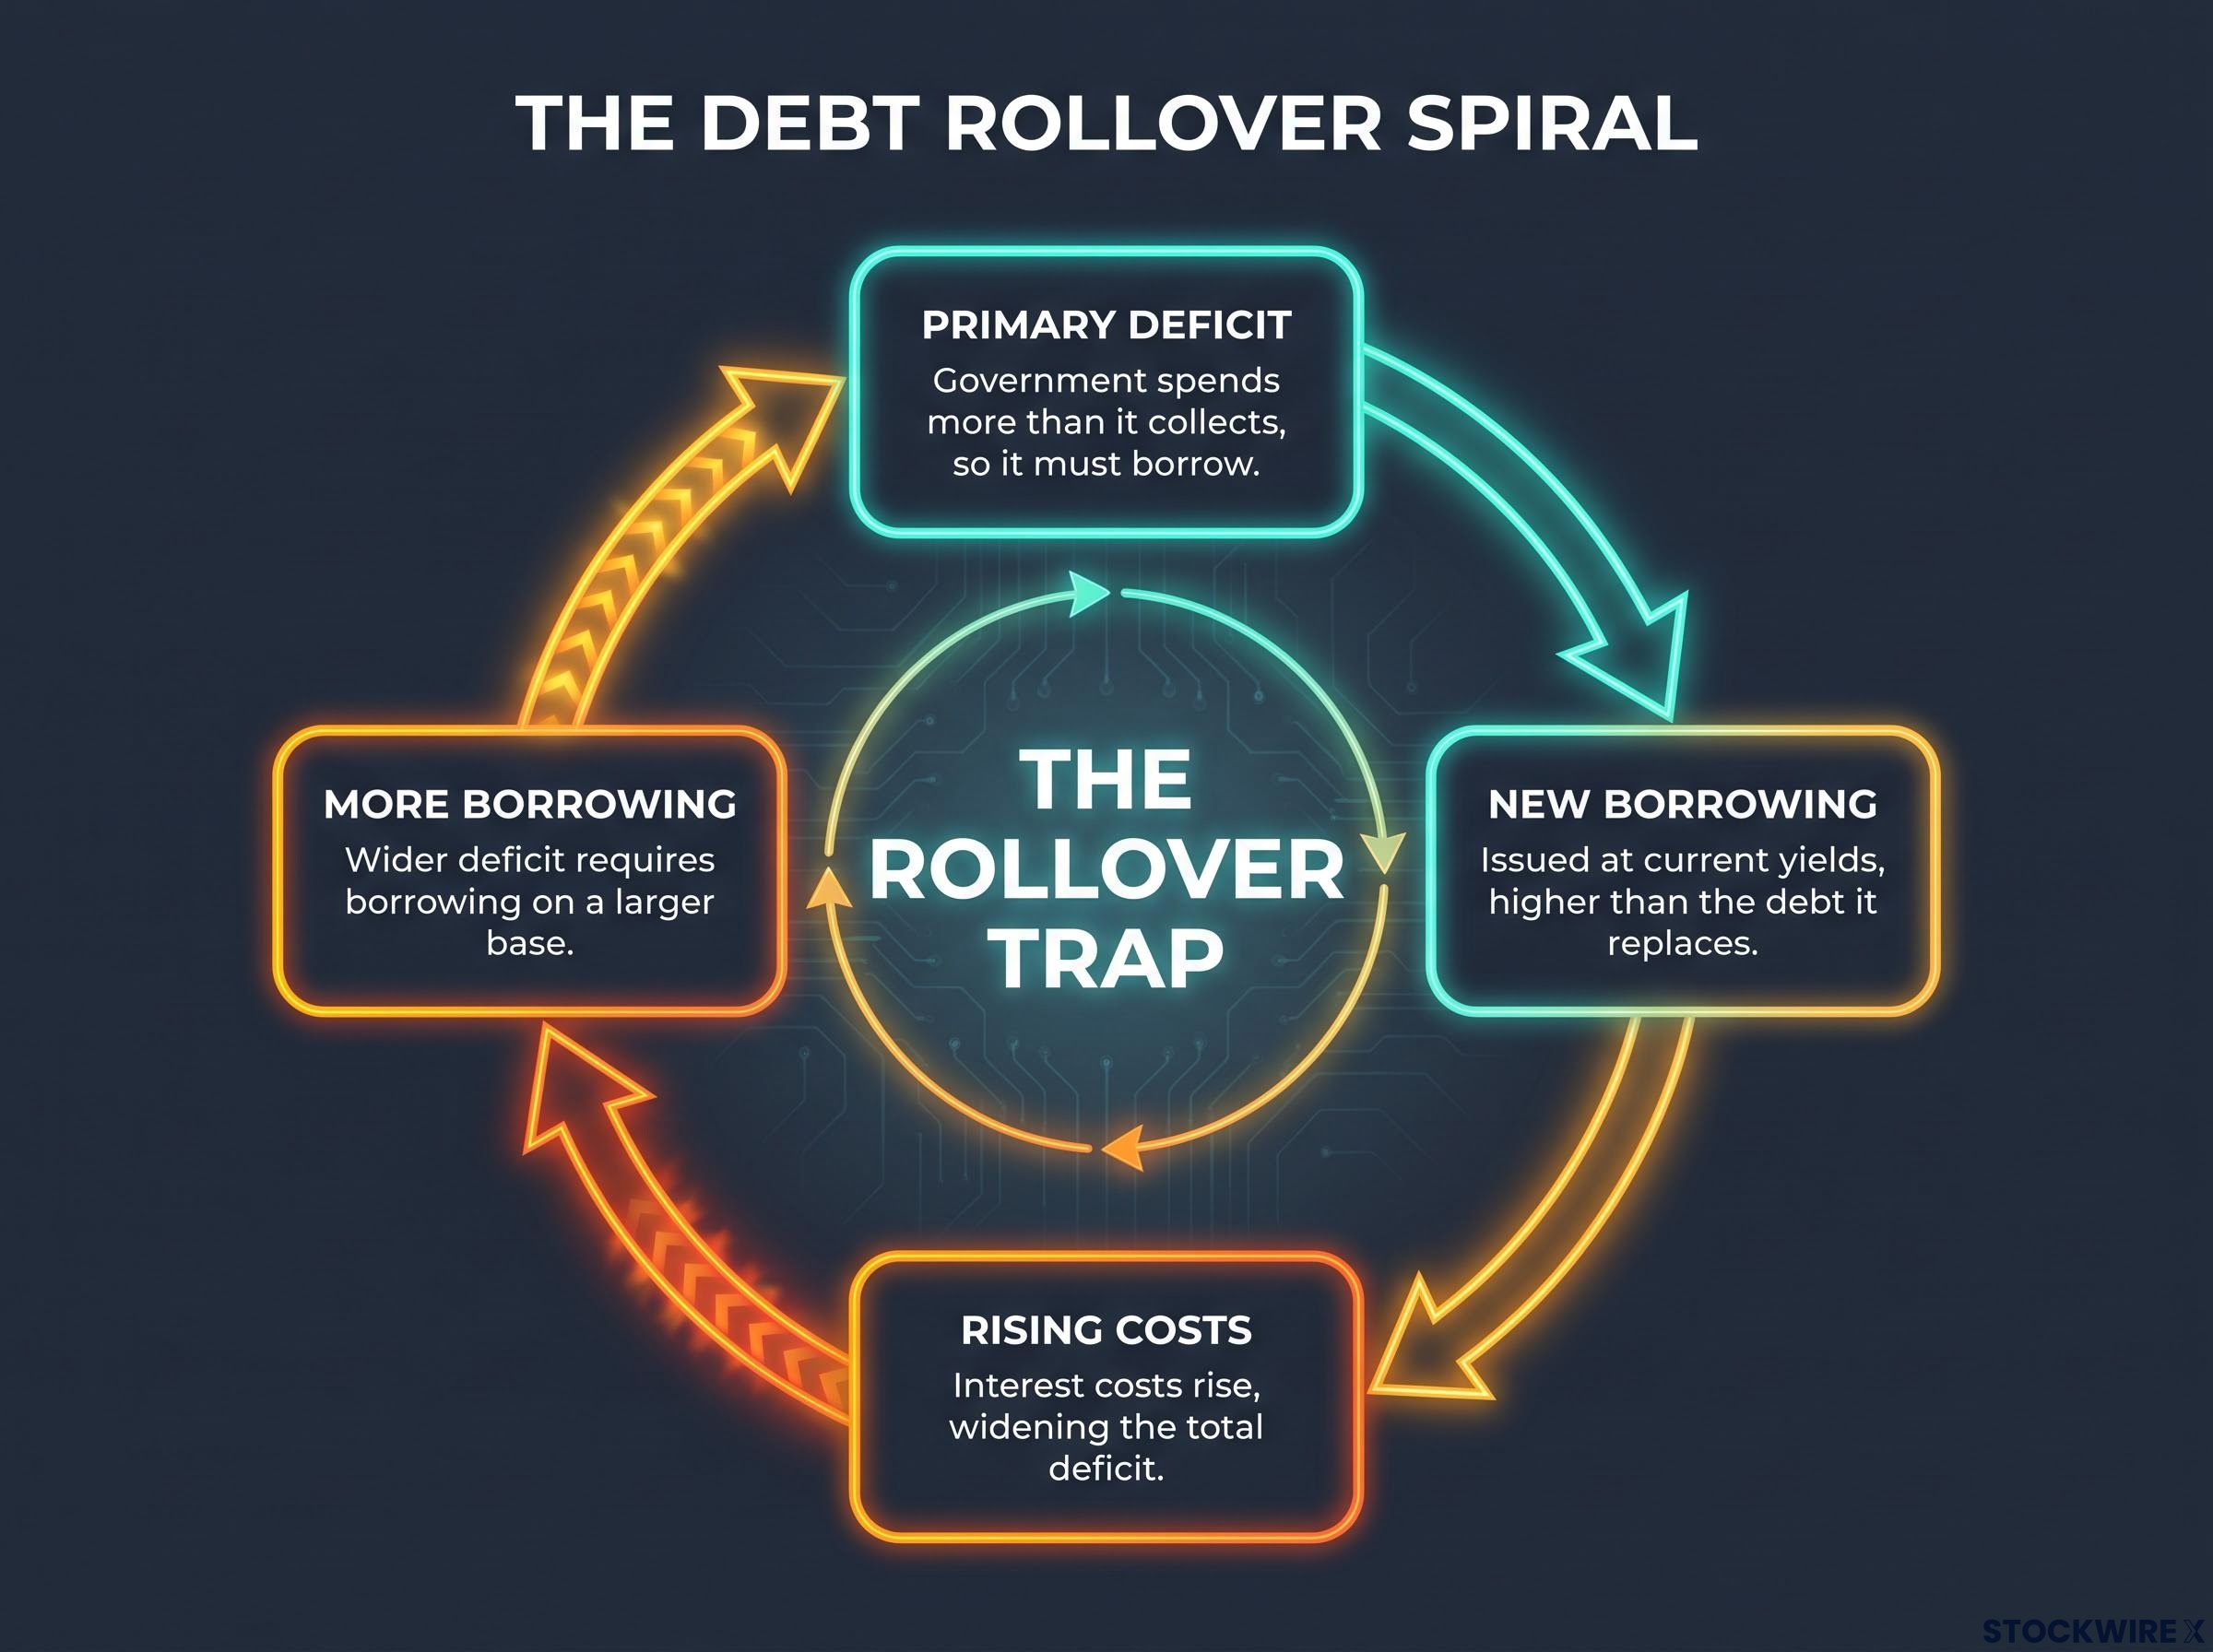
This is not a scenario waiting in the wings. It is a present-tense process, with the debt stock already expanding faster than GDP under current conditions. Each turn of the cycle makes the next turn slightly worse.
The uncomfortable implication for you is this: waiting for conditions to improve before addressing the debt is itself a decision. It is a fiscal action that makes the eventual adjustment more abrupt and less voluntary.
What crowding out looks like in practice
Crowding out is the practical consequence of the spiral, and it hits in a predictable order. Interest is a non-negotiable payment, so when it grows, the flexible parts of the budget shrink first: discretionary spending, public investment, and eventually pressure on social insurance programmes.
The CBO projection of net interest climbing from 3.2% of GDP in 2025 to a projected 5.4% by 2055 is not just a number. It represents a category that steadily outgrows the room left for infrastructure, research, and the capacity to respond when a recession or crisis actually arrives.
That last point matters most to you. The real constraint is not the headline debt figure; it is fiscal flexibility. A government spending an ever-larger share on interest has less ability to cut taxes, fund investment, or cushion a downturn, which is precisely the capacity that could otherwise grow the economy out of the problem.
What the bond market actually is, and why it cannot be managed away
The Treasury does have tools, and the most visible one is the bond buyback. A buyback is exactly what it sounds like: the government repurchases its own previously issued bonds before they mature, using the operation to support smooth market functioning and reduce the term premium, which is the extra yield investors demand for holding longer-dated debt.
The current programme is sizeable. Here is how it is structured:
The Fed’s share of outstanding public debt has shrunk from roughly 26% in 2021 to approximately 14% in mid-2026, and the shift in bond market dynamics that followed has transferred direct control over long-term borrowing costs away from the central bank and toward private institutional buyers whose priorities are not aligned with fiscal objectives.
- A quarterly liquidity-support allocation of $38 billion for longer-term bonds, unchanged between the November 2025 and August 2026 refunding announcements.
- A separate cash-management allocation of $25 billion per quarter for shorter-dated securities.
- A total planned envelope of $63 billion per quarter.
- Stated flexibility to increase these amounts if financing conditions remain strained.
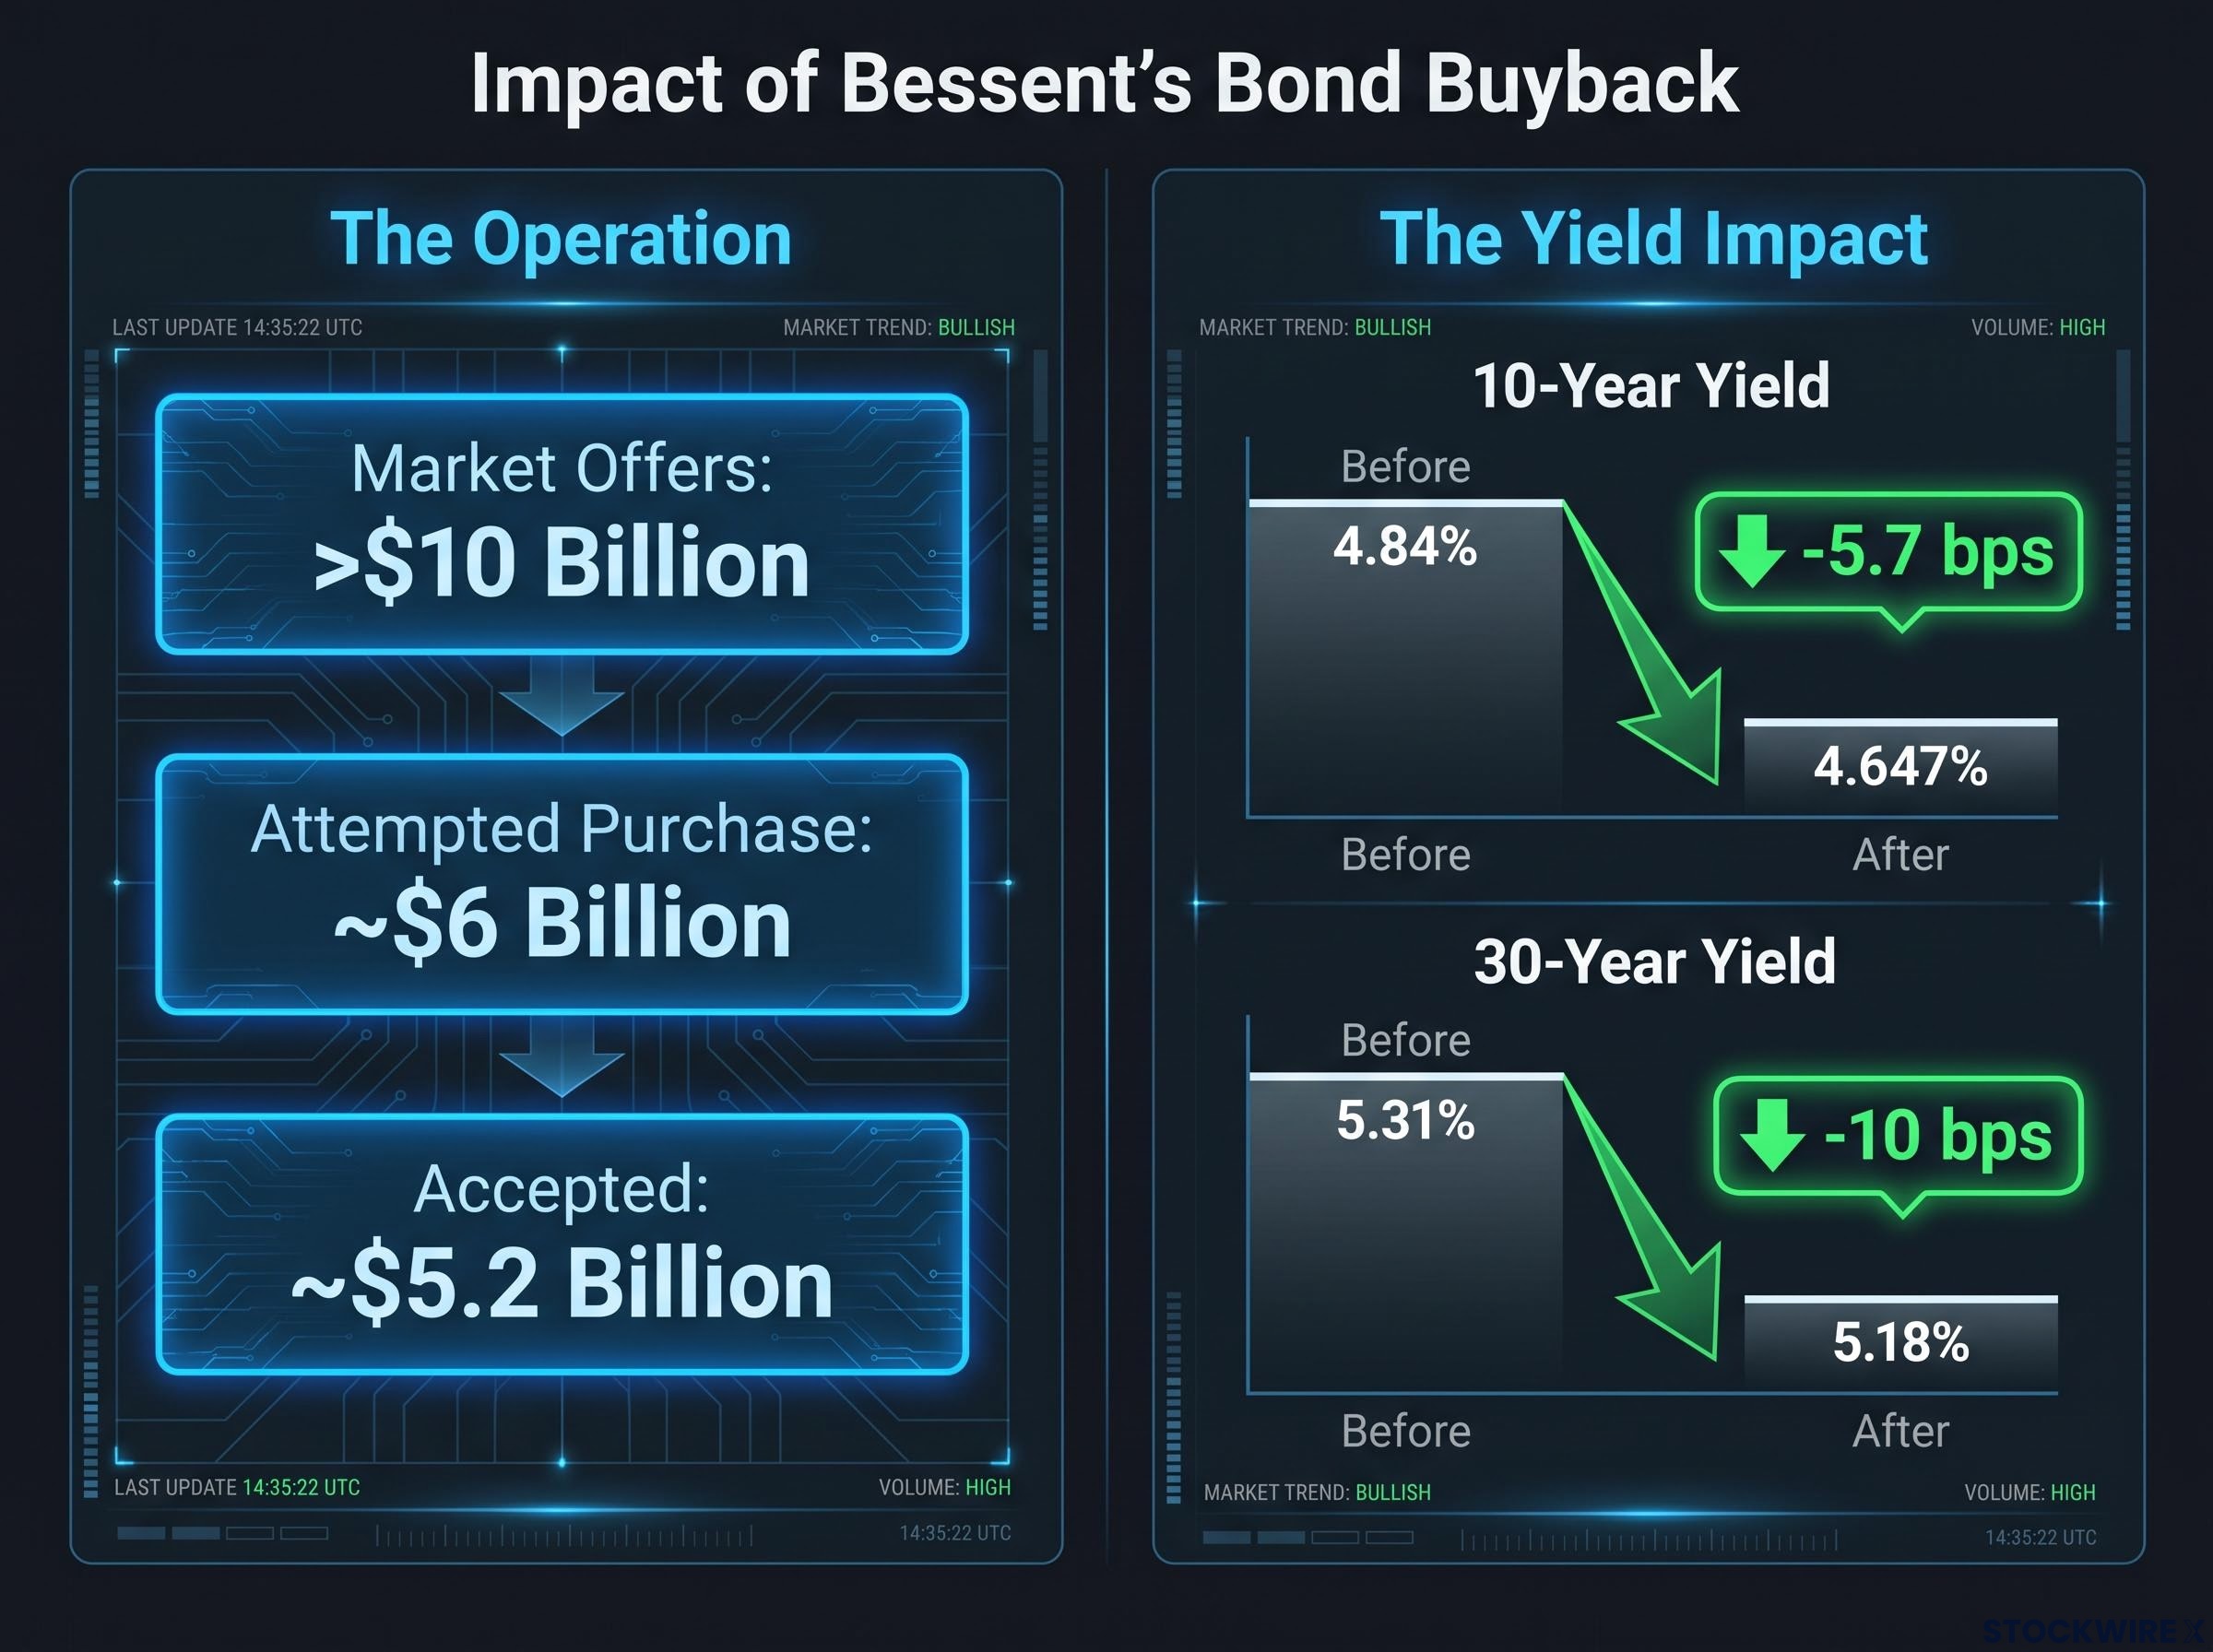
Bessent put the tool to work in a recent operation, and the episode is instructive. He attempted to purchase roughly $6 billion in bonds; market offers exceeded $10 billion, but only around $5.2 billion was ultimately taken in. Before the interventions, the benchmark 10-year yield had spiked to about 4.84% and the 30-year to roughly 5.31%. Afterward, the 10-year fell 5.7 basis points to 4.647%, and the deployment of buybacks eventually pushed the 30-year down by as much as 10 basis points to around 5.18%. These figures are directionally accurate but carry sourcing limitations.
Why the toolkit smooths the surface but cannot turn the tide
Here is the honest reckoning. A buyback can pull term premia down for a while, but it does not change the net supply of long-duration risk investors must hold, and it does nothing to alter the deficit trajectory driving the yield pressure in the first place.
The market understands this, and so, apparently, does the man running the operation.
Bessent has publicly acknowledged that if he were still in a market role, he would consider trading against U.S. Treasuries.
That is a striking concession from the person tasked with defending them. What it tells you is that even the most capable Treasury Secretary, armed with tens of billions in firepower, can only borrow time from the bond market. He cannot overrule it.
Historical precedents: when market resistance overwhelmed yield management
The pattern is not new. The U.S. bond vigilantes of the early 1990s forced long yields higher when they judged fiscal policy too loose. Japan’s yield-curve control has required ever-escalating central bank commitments to hold the line. Post-financial-crisis quantitative easing suppressed yields only through sustained, enormous purchases.
The lesson across all three is the same: when authorities lean hard on the long end, markets often read it as a signal of underlying trouble and demand a higher premium in response.
The competing schools of thought on whether this ends badly
Economists do not agree on how this plays out, and understanding the three main frameworks lets you evaluate almost any commentary you will read on the subject.
| Framework | Core Argument | Key Vulnerability |
|---|---|---|
| Fragile-Sustainability | Current debt trajectories are unsustainable without policy change (CBO, CRFB, IMF, BIS). | Structural primary deficits leave only painful fixes: higher taxes, lower spending, or inflation. |
| Cautiously Optimistic | Reserve-currency status and deep capital markets provide a real buffer. | Conditional on strong nominal GDP growth and real rates not rising sharply and persistently. |
| Modern Monetary Theory | A currency-issuing sovereign cannot be forced to default in its own currency. | Inflation and high nominal yields remain binding constraints requiring an active policy choice. |
The fragile-sustainability camp, which includes the CBO, the Committee for a Responsible Federal Budget (CRFB), the International Monetary Fund (IMF), and the Bank for International Settlements (BIS), sees large structural primary deficits pushing debt ratios ever higher, with only a limited menu of adjustments available.
The cautiously optimistic camp argues the debt is manageable, but attaches heavy conditions: nominal growth must stay robust and real interest rates must not rise sharply. Modern Monetary Theory takes a different angle again, arguing default is not a forced outcome for a currency issuer, while conceding that inflation and high nominal yields are genuine limits that demand a response.
Notice what unites them. Even the optimists cannot escape the political economy constraint: stabilising the debt through growth alone would require a level of sustained austerity that voters are unlikely to tolerate.
The situation has moved beyond what spreadsheet-based growth projections can realistically resolve.
That shared conclusion should reframe the debate for you. The real question is not whether an adjustment comes, but what form it takes and who bears the cost, and that is the distinction that should guide how you think about your own exposure.
What a forced rate reversal actually means for borrowers, investors, and the dollar
Everything above becomes personal at this point, and it turns on one distinction. A rate reversal driven by the Federal Reserve cutting in response to a cooling economy is a very different animal from one forced by fiscal stress.
In a fiscal-stress scenario, the Fed might cut short-term rates while long-term yields stay stubbornly high, because markets are pricing in fiscal and inflation risk. That means the relief you expect from a rate-cutting cycle may never reach the places that matter most to your finances. Here is where it lands:
- Household borrowing: Mortgage rates track 10- to 30-year yields, not the Fed’s policy rate. If long yields stay near the 4.84% and 5.31% levels that triggered Bessent’s intervention, mortgage relief stays out of reach even as the Fed eases.
- Corporate investment: Companies price debt off Treasury benchmarks. Higher real financing costs compress investment and hiring as firms shelve projects.
- Pension and insurance fund stability: Holders of long-duration assets may benefit from higher yields initially, but fiscal-driven volatility and inflation uncertainty complicate their ability to meet long-term obligations.
- The dollar and global spillovers: Immediate displacement of the dollar as reserve currency is unlikely, but eroding confidence in U.S. fiscal management would still trigger higher global risk premia, capital-flow shifts, and stress in dollar-funding markets.
Geopolitical friction is compounding the structural picture: sanctions-driven infrastructure-building in China and other major holders has already produced a pattern where foreign official institutions sold Treasuries into stress events rather than buying them, inverting the traditional safe-haven dynamic that once supported foreign demand for Treasuries during periods of fiscal uncertainty.
The distinction between a chosen easing and a forced one is the whole game for you. It determines whether a headline about the Fed cutting rates actually lowers your mortgage, steadies your employer’s borrowing costs, and protects the assets in your retirement accounts, or whether that relief simply fails to arrive where you need it.
Why fiscal reform tends to follow crisis rather than anticipate it
The reason relief is likely to be reactive rather than orderly comes down to electoral arithmetic. The level of austerity required to stabilise the debt ratio, without leaning on inflation or financial repression, exceeds what voters will accept under normal conditions.
So reform tends to arrive only after a crisis has already made the alternatives worse. Both the fragile-sustainability and cautiously optimistic camps share this observation, even as they disagree on timing and severity. The practical result is that the adjustment path is more likely to be abrupt and disruptive than gradual and voluntary.
What to watch as the fiscal ceiling closes in
You do not need to predict the crisis to prepare for it. You need to watch the right signals, and three variables will tell you whether the constraint tightens gradually or snaps.
- The rollover rate trajectory. Track the weighted average interest rate on marketable Treasuries, currently around 3.45%. As cheaper maturing debt is refinanced at today’s higher yields, that number climbs, and the closer it moves toward 4% or 5%, the harder the arithmetic bites.
- Treasury auction reception. Watch bid-to-cover ratios and primary dealer takedowns. Weak demand at auction is an early warning that the market is losing appetite for absorbing new supply at prevailing yields.
- The Federal Reserve’s balance-sheet response. Whether the Fed chooses to absorb fiscal pressure through balance-sheet expansion or defends its inflation mandate will shape how much of the strain lands on long-end yields.
Above all, watch the long end of the curve, particularly the 30-year Treasury, which drew active intervention near 5.31%. That is your clearest tell.
The single distinction to carry away: are rates falling because the Fed chooses to ease, or because the bond market forces the issue? The first is relief. The second is a warning.
A Fed-driven easing typically pulls the long end down alongside the short end. A fiscal-stress scenario sees the long end stay elevated or widen against short-term rates, even as the CBO’s projected 5.4% of GDP net-interest destination draws closer. Reading which pattern is in play is the most useful thing you can do with the framework above.
For investors who want a practical framework for monitoring these variables in real time, our dedicated guide to reading bond market signals covers the cross-asset indicators, including gold, the dollar, buyback operations, and TLT technicals, that tend to move ahead of headline yield confirmation.
This article is for informational purposes only and should not be considered financial advice. Investors should conduct their own research and consult with financial professionals before making investment decisions. Financial projections are subject to market conditions and various risk factors, and these forward-looking statements are speculative and subject to change based on economic and policy developments.