
A formula invented when American life expectancy sat below 70 is still being handed to investors planning 30-year retirements. The “100 minus your age in bonds” rule is not a law of finance. It is a relic, and the gap between what it prescribes and what modern retirement demands has never been wider. With Americans routinely facing 25 to 35 years in retirement, Medicare Part B premiums rising 5.9% year-over-year in 2025, and bond markets behaving unpredictably through an extended elevated-rate environment, the stakes of an oversimplified allocation formula are compounding in real time. Financial planners, major institutions (Vanguard, Fidelity, T. Rowe Price), and leading researchers (Michael Kitces, Wade Pfau, William Bengen) have converged on a clear position: age-based rules mislead more investors than they help. What follows explains exactly why the rule fails, what it confuses about risk, why standard questionnaires can make the problem worse, and what a modern income-driven retirement asset allocation framework looks like in practice. The goal is not to replace one formula with another. It is to replace formula-thinking entirely.
The rule that quietly drives millions of retirement portfolios
The premise is simple. Subtract your age from 100. The result is the percentage of your portfolio that belongs in equities; the remainder goes into bonds. A 60-year-old gets 40% in stocks. A 70-year-old gets 30%. Two popular variants raise the starting number to 110 or 120 to account for longer lifespans, but the logic is identical: age alone determines how much risk an investor should carry.
For a generation that retired at 65 and lived to 72, the arithmetic was defensible. For a generation that may spend three decades drawing down a portfolio, it is not. Wes Moss, writing in April 2026, characterised the rule as “outdated,” arguing it steers investors toward excessive conservatism precisely when their portfolios need to sustain decades of withdrawals and rising healthcare costs.
CDC life expectancy data confirms that a person reaching age 65 today can expect to live an average of 18.9 more years, meaning a retirement that begins at the traditional threshold routinely extends into the mid-80s and, for many, beyond.
The variants do not fix the structural flaw. They patch it. T. Rowe Price data from Q3 2025 found that investors aged 65 and older held equity allocations ranging from 20% to 80%, a spread so wide it demonstrates how little age alone predicts appropriate allocation.
T. Rowe Price (Q3 2025): Investors aged 65 and older showed equity allocations ranging from 20% to 80%, illustrating that age alone is a poor proxy for appropriate portfolio construction.
The table below shows what each variant prescribes versus what investors actually hold.
| Rule Variant | Age 60 Equity % | Age 70 Equity % | Modern Range (T. Rowe Price) |
|---|---|---|---|
| 100 minus age | 40% | 30% | 20-80% (ages 65+, with average approximately 45-55%) |
| 110 minus age | 50% | 40% | |
| 120 minus age | 60% | 50% |
The modern range is not noise. It reflects the reality that income needs, savings levels, health expectations, and spending timelines differ enormously across individuals of the same age.
When big ASX news breaks, our subscribers know first
Risk tolerance and risk requirement are not the same thing
Most investors encounter the word “risk” through a single question: how much volatility can you stomach? Risk tolerance, the emotional or psychological comfort level with portfolio swings, dominates the conversation. It is what questionnaires measure. It is what advisors assess in onboarding meetings.
Risk requirement is a different question entirely, and it is the one that matters more. It asks: what minimum return does this portfolio need to generate to meet the investor’s financial goals? The distinction produces real consequences.
- Risk tolerance: Subjective, emotional, questionnaire-derived. Shifts with market conditions. Measures how an investor feels about loss.
- Risk requirement: Objective, math-derived, plan-dependent. Determined by savings, spending, and time horizon. Measures how much growth the portfolio needs to deliver.
Scott Bishop, CFP at Presidio Wealth Partners, frames the distinction sharply: a financial plan, not age and not feelings, should be the primary guide for allocation. Flavio Landivar of Evensky & Katz / Foldes Wealth Management reinforces this by noting that an investor’s degree of dependence on their portfolio for near-term income is more meaningful than their birthday.
The specific failure mode is an investor with low risk tolerance but modest savings. That investor may need 60% or more in equities to generate sufficient long-term growth, yet a tolerance-driven assessment would steer them toward bonds, virtually guaranteeing a shortfall over a multi-decade retirement. Economist James Choi has argued that investors should maintain full equity exposure through the majority of their working careers, a position that only makes sense when viewed through the requirement lens rather than the tolerance lens.
Why standard questionnaires can make this confusion worse
Standard risk assessments are designed to measure comfort, not need. The scores they produce are not stable. Bishop notes that investor perception of market risk tends to shift more positively following periods of strong market performance, meaning questionnaires completed during bull markets systematically overstate willingness to bear risk.
The result is a moving target. An investor who scores as “moderate-aggressive” after a strong year may score “conservative” after a 10% correction, despite having identical financial circumstances. Basing allocation on these shifting readings, rather than on the fixed math of income requirements and time horizon, introduces a layer of behavioural noise that compounds the age-rule problem rather than correcting it.
What sequence-of-returns risk actually means for your first decade of retirement
Sequence-of-returns risk is the danger that poor market returns early in retirement, combined with regular withdrawals, permanently impair a portfolio even if long-run average returns are identical to a scenario where the bad years came later. The mechanism is straightforward, but the asymmetry is severe.
- Market declines hit a portfolio that is simultaneously shrinking. A 20% market decline in year two of retirement lands on a portfolio already reduced by a year of withdrawals.
- Forced selling to fund living expenses accelerates the damage. The retiree must liquidate shares at depressed prices, converting a paper loss into a permanent one.
- The recovery base shrinks permanently. Fewer shares remain to participate in any subsequent rebound, meaning the portfolio never fully recovers even if the market does.
This three-step compounding mechanism explains why the timing of returns matters more in retirement than during accumulation. Two portfolios with identical 7% average annual returns over 25 years can produce dramatically different outcomes depending on whether the weak years cluster at the beginning or the end.
Scott Bishop recommends raising fixed income and cash holdings approximately two to three years before retirement as targeted protection against this specific risk. The logic is precise: by building a cash buffer in advance, a new retiree avoids being forced to sell equities during a downturn in the most vulnerable phase of their withdrawal timeline.
The traditional response, shifting heavily into bonds at 65 via an age rule, is a blunt instrument. It addresses sequence risk but creates a new problem: insufficient long-run growth to sustain a 30-year retirement.
**William Bengen’s A Richer Retirement (August 2025) extends the original 4%** rule framework with dynamic equity management as a more precise response to sequence risk than static age rules, what Bengen describes as “supercharging” the sustainable withdrawal rate through active allocation adjustments rather than fixed formulas.
The V-shaped glide path: why your equity allocation may need to rise after 75
The most counterintuitive finding in modern retirement research is this: for many retirees, the correct equity allocation at 80 is higher than at 65.
Michael Kitces and Wade Pfau’s V-shaped glide path works as follows. Reduce equities approaching retirement to approximately 40-50% at age 65, protecting against sequence-of-returns risk during the most vulnerable withdrawal years. Maintain that conservative posture through early retirement. Then, beginning around age 75, gradually increase equity exposure by approximately 10-20 percentage points, pushing the allocation toward 60% or higher.
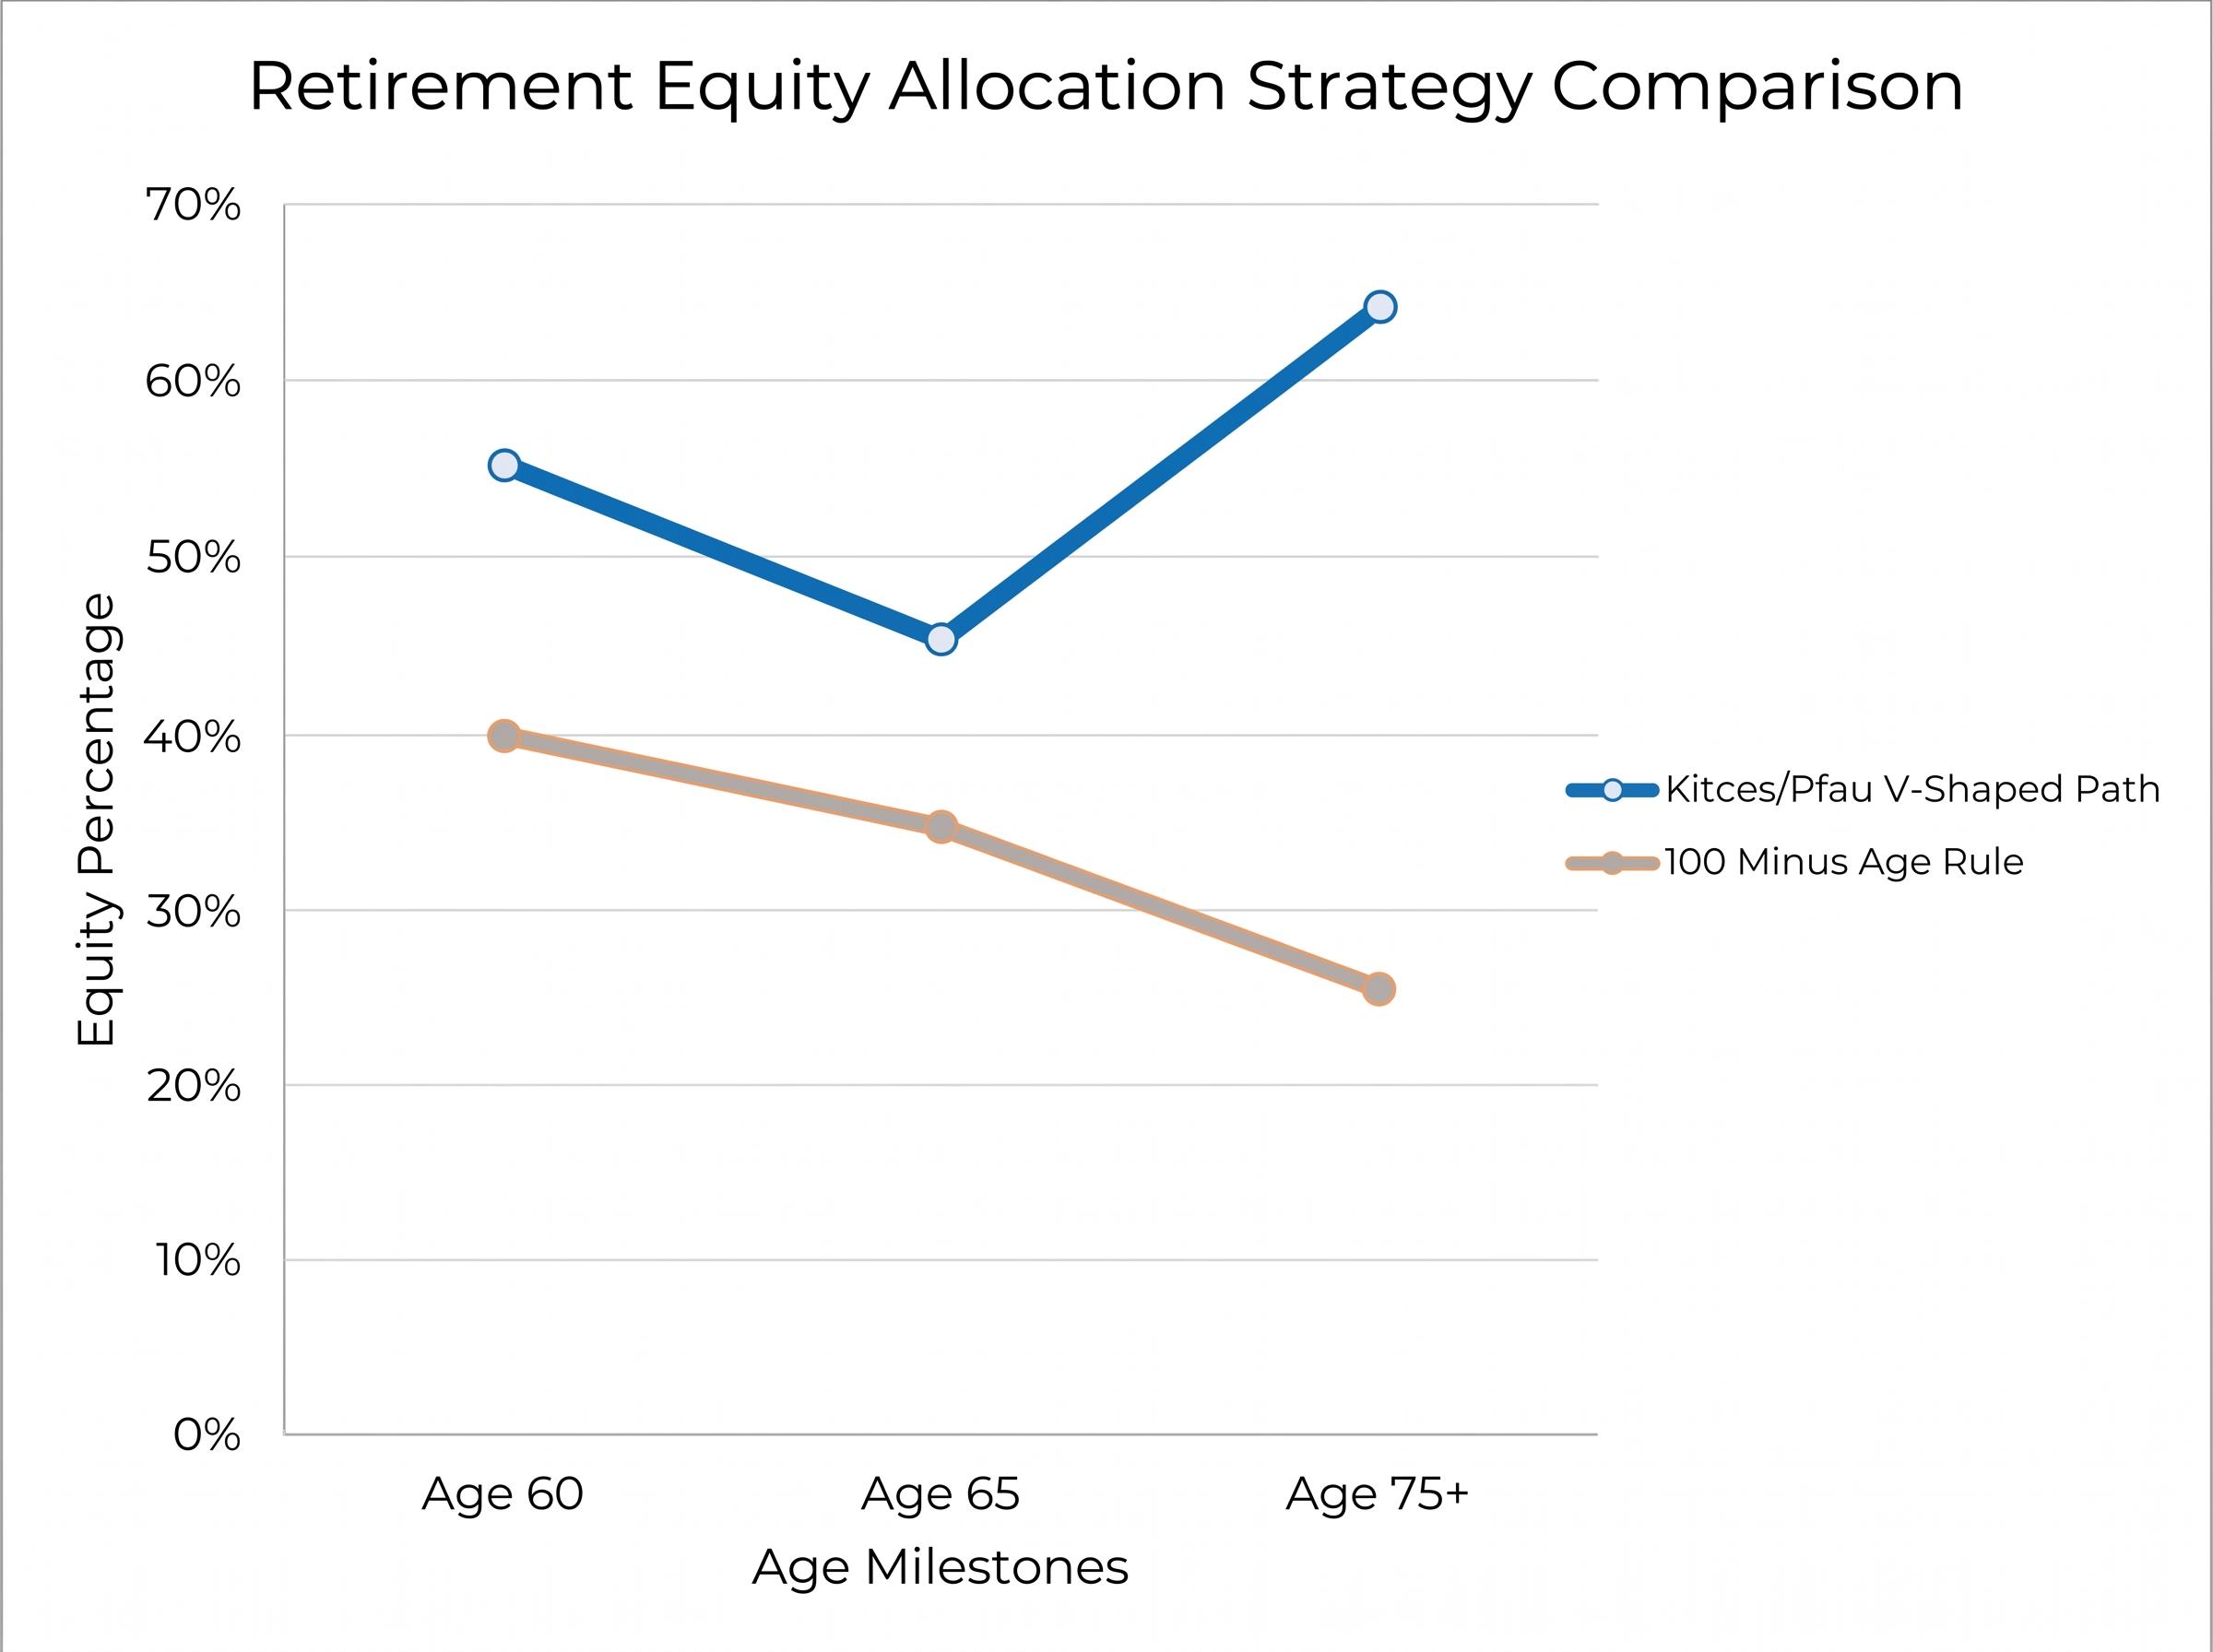
| Age / Stage | Kitces/Pfau V-Shaped Path (Equity %) | “100 Minus Age” Rule (Equity %) |
|---|---|---|
| Age 60 (pre-retirement) | 50-60% | 40% |
| Age 65 (early retirement) | 40-50% | 35% |
| Age 75+ (late retirement) | 60%+ | 25% |
The divergence at age 75 is stark. The age rule prescribes 25% equities. The V-shaped path prescribes 60% or more. The difference is not recklessness. It is longevity math.
Vanguard’s 2026 guidance endorses post-retirement equity stabilisation or modest increases for the same longevity reason, lending institutional weight to what initially sounds like an aggressive stance. T. Rowe Price Q3 2025 data shows that average equity exposure for investors 65+ already sits at approximately 45-55%, with many investors intuitively moving in this direction.
Why longevity risk reshapes the math
A 65-year-old today may face 20 to 30 years of retirement. That portfolio must sustain purchasing power through inflation, through Medicare cost increases (the 5.9% premium increase from 2024 to 2025 is representative, not exceptional), and through market cycles that age-based rules were never designed to navigate.
A bond-heavy portfolio that served an investor who retired at 65 and died at 72 in the 1970s is systematically underpowered for today’s retirees. The V-shaped glide path is not a preference. It is the allocation response to a demographic reality that the original rule’s creators could not have anticipated.
Equity compounding over long horizons is the mathematical engine behind both the V-shaped glide path and the bucketing framework: the second decade of a compounding investment generates nearly double the dollar gains of the first, which is precisely why reducing equity exposure too aggressively in early retirement carries a cost that cannot be recovered through bonds alone.
The CMS 2025 Medicare Part B premium announcement confirmed the standard monthly premium rose to $185.00 from $174.70 in 2024, a cost trajectory that bond-heavy portfolios prescribed by age rules are structurally underpowered to absorb across a multi-decade retirement.
Bucketing: the structural replacement for age-based formulas
The three-bucket structure replaces age as the allocation driver with two variables that actually determine what a portfolio needs to do: time horizon and spending purpose.
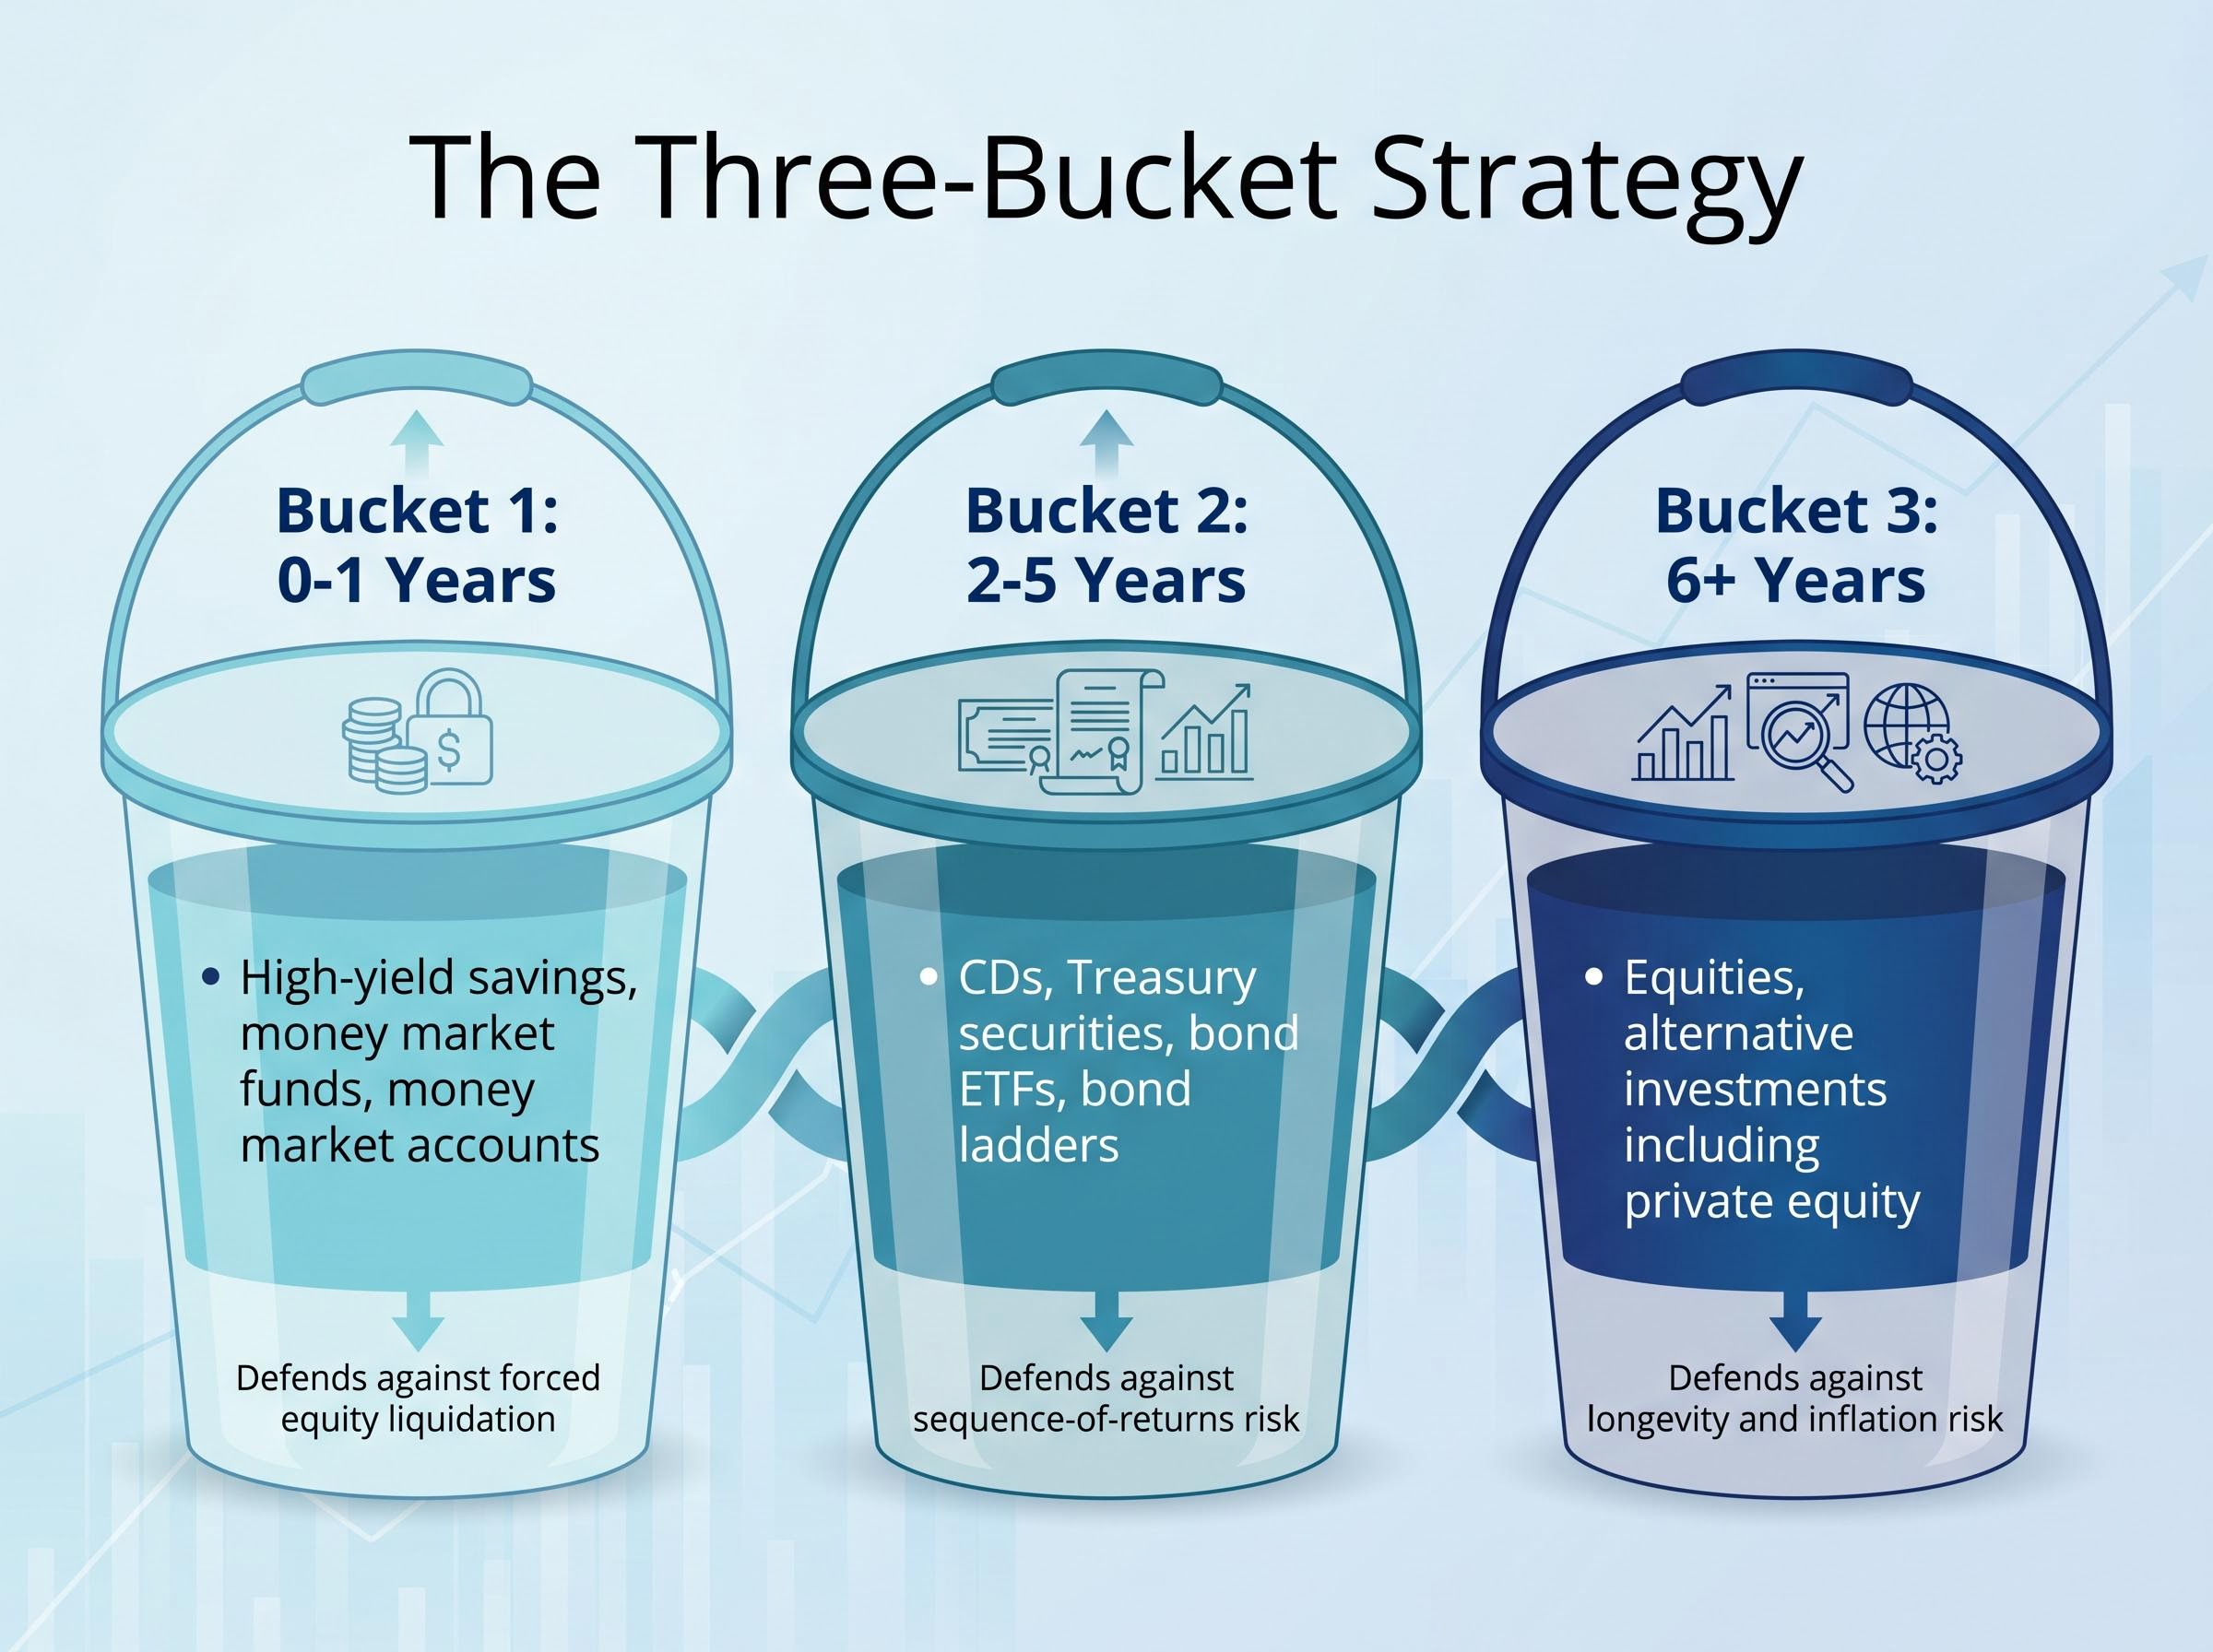
| Bucket | Time Horizon | Instruments | Purpose / Risk Defended |
|---|---|---|---|
| Bucket 1 | 0-1 years | High-yield savings, money market funds, money market accounts | Immediate spending needs; defends against forced equity liquidation |
| Bucket 2 | 2-5 years | CDs, Treasury securities, bond ETFs, bond ladders | Near-term income; defends against sequence-of-returns risk |
| Bucket 3 | 6+ years | Equities, alternative investments including private equity | Long-term purchasing power; defends against longevity and inflation risk |
Charles Schwab recommends a minimum of one year of living expenses in cash (bucket one), approximately four years in low-risk investments (bucket two), and more than eight years in long-term growth assets (bucket three). Fidelity’s 2026 guidance endorses the 3 to 5 year cash reserve approach alongside dynamic equity exposure.
Flavio Landivar of Evensky & Katz / Foldes Wealth Management favours staggered maturity bond ladders within bucket two, providing predictable income streams that naturally replenish as bonds mature.
Each bucket answers a specific risk identified earlier in this article. Bucket one neutralises sequence risk by ensuring the retiree never needs to sell equities during a downturn. Bucket two provides income stability across market cycles. Bucket three delivers the growth that a 25-35 year retirement demands.
How bucketing removes the pressure to sell at the wrong time
The behavioural mechanism is as important as the financial one. A retiree with 12 months of cash readily available does not need to make investment decisions during a market correction. The psychological link between portfolio volatility and spending anxiety, the link that drives premature equity liquidation, is broken.
Behavioural return drag, estimated at approximately 1.5% per annum on average, explains why the psychological link between portfolio volatility and spending decisions matters so much: the same emotional impulses that cause investors to sell equities during corrections also distort how they deploy capital during recoveries.
When a bear market arrives, the retiree draws from bucket one. Bucket three is left alone to recover. The decision about when to sell equities becomes a strategic rebalancing choice made in calm conditions, not a panic response to a red portfolio screen.
Building an allocation around your plan, not your birthday
The replacement framework has five components, each addressing a specific limitation that age-based rules cannot account for:
- Income-needs-driven planning. Project actual spending needs in retirement, stress-test withdrawal scenarios using frameworks like Bengen’s enhanced 4% rule, and build allocation around income generation rather than age formulas.
- V-shaped glide path. Reduce equities to approximately 40-50% approaching retirement, maintain conservatism in early retirement, then increase equity exposure post-75 to sustain purchasing power over a long horizon.
- Bucketing for sequence protection. Maintain 3-5 years of expenses in cash and near-cash instruments, use bonds and dividend stocks for medium-term income, and rely on equities for long-term growth.
- Dividend and income tilt. Dividend-paying equities serve double duty, providing income without requiring principal sales while maintaining equity market exposure for growth.
- Tax-efficient asset location. Coordinate asset type with account type to maximise after-tax portfolio value.
Dividend-growth strategies that screen for payout sustainability and earnings quality serve the income-tilt component of this framework more reliably than pure high-yield approaches, which have historically carried concentrated sector exposure to rate-sensitive industries and produced weaker long-run total returns.
The tax dimension deserves particular attention, as it is a layer of complexity that age-based rules entirely ignore. IRS Publication 590-B (2026 edition) guidance supports holding bonds in tax-deferred accounts (traditional IRAs, 401(k)s), where interest income is sheltered from current taxation, and equities in taxable accounts or Roth accounts, where long-term capital gains receive preferential treatment. Lower-income years in early retirement can also present windows for Roth conversions, reducing future required minimum distribution (RMD) burdens.
The convergence is notable. Vanguard, Fidelity, T. Rowe Price, Kitces, Pfau, and Bengen all point toward the same conclusion: personalised, plan-based approaches are the correct replacement for age heuristics.
The right question is not “what percentage of my portfolio should be in bonds at age 62?” It is “what does my portfolio need to produce, when do I need it, and how do I structure assets across accounts to deliver that most efficiently?”
A formula for a shorter life in a simpler market has no place in your retirement plan
The “100 minus age” rule endures because simplicity is comforting. One number, one calculation, one answer. The appeal is real. But the complexity of modern retirement, spanning 30-year horizons, rising healthcare costs, tax-advantaged account management, and bond markets that no longer behave as predictable safe havens, demands more than a formula designed for a world that no longer exists.
Age is an input to a financial plan. It is not a substitute for one. The five-component framework outlined above accounts for income needs, timing, sequence risk, account structure, and tax efficiency. A birthday-derived formula addresses none of them.
Scott Bishop, CFP at Presidio Wealth Partners, frames the principle directly: a financial plan should be the primary guide for determining allocation, not age and not feelings.
The concrete next step is straightforward. Pressure-test a current allocation against the framework. Does the split reflect income needs and time horizon, or does it simply reflect a birthday? If the answer is the latter, the portfolio is built on a rule that was never designed for the retirement ahead of it.
This article is for informational purposes only and should not be considered financial advice. Investors should conduct their own research and consult with financial professionals before making investment decisions. Past performance does not guarantee future results. Financial projections referenced in this article are subject to market conditions and various risk factors.