
The S&P 500 equity risk premium has fallen to 2.1%, a level not seen since 2002 and below the trough recorded on the eve of the 2007 financial crisis, according to JPMorgan.
That comparison is worth sitting with. The extra return you are being paid to hold stocks over inflation-protected bonds is now thinner than it was heading into the worst financial shock in living memory.
This is not the routine valuation chatter that circulates whenever the market grinds higher. Something structural has shifted. A sustained equity rally has collided with a 2.60% real bond yield to squeeze the premium from both ends at once, and JPMorgan’s Flows and Liquidity team has named the moment explicitly.
By the end of this piece, you will know what the equity risk premium actually measures, why its current compression matters more than a headline P/E ratio can tell you, and what past episodes of similar compression have tended to produce. You will walk away able to judge claims about equity valuations with a sharper instrument than you had before.
What the equity risk premium actually measures, and why it matters more than P/E ratios
If you want to know whether stocks are expensive, you probably reach for the price-to-earnings ratio. It is the most familiar valuation tool in existence, and for good reason: it tells you how much you are paying for each dollar of a company’s earnings.
But the P/E ratio has a blind spot. It measures price against earnings in isolation, and says nothing about what else you could do with your money. That is the gap the equity risk premium fills.
The equity risk premium (ERP) is the earnings yield of the S&P 500 minus the 10-year real Treasury yield. The earnings yield is simply the P/E ratio flipped upside down, expressed as a percentage. Subtract the return you could earn risk-free on inflation-protected government debt, and what remains is the extra compensation investors are demanding for taking on equity risk.
The Federal Reserve asset valuation framework defines the equity risk premium as the forward earnings-to-price ratio for the S&P 500 less the 10-year real Treasury yield, the same construction JPMorgan applies and the one that makes today’s 2.1% reading legible against the Fed’s long-run median of 4.68 percentage points.
That framing is what makes ERP the more complete instrument. A P/E ratio cannot tell you whether stocks are compensating you fairly given where bond yields sit today. The ERP can, because it is a spread rather than a standalone number.
Damodaran’s implied ERP methodology solves for the discount rate embedded in current index prices rather than reading the spread directly, which is why it produces a different number from JPMorgan’s real-yield approach while measuring the same underlying market.
The choice of the real yield rather than the nominal one is deliberate. Using the TIPS-based real yield strips inflation out of both sides of the comparison, isolating the pure reward for holding equities instead of a guaranteed government return.
Why the choice of real versus nominal yield changes everything
Here is where the numbers get slippery. The ERP is not a single observable fact. It is a model output, and the model you pick changes the answer dramatically.
JPMorgan’s real-yield method lands at 2.1%. Goldman Sachs, using a multi-stage dividend discount model that solves for the discount rate implied by the index level, arrives at roughly 3%. State Street Global Advisors, using the nominal 10-year yield instead of the real one, reports just 0.19%.
Those figures are not in conflict. They are measuring the same market through different lenses. A nominal benchmark quietly blends inflation compensation into the reading, while a real benchmark removes it, which is exactly why SSGA’s 0.19% and JPMorgan’s 2.1% can both be valid at once.
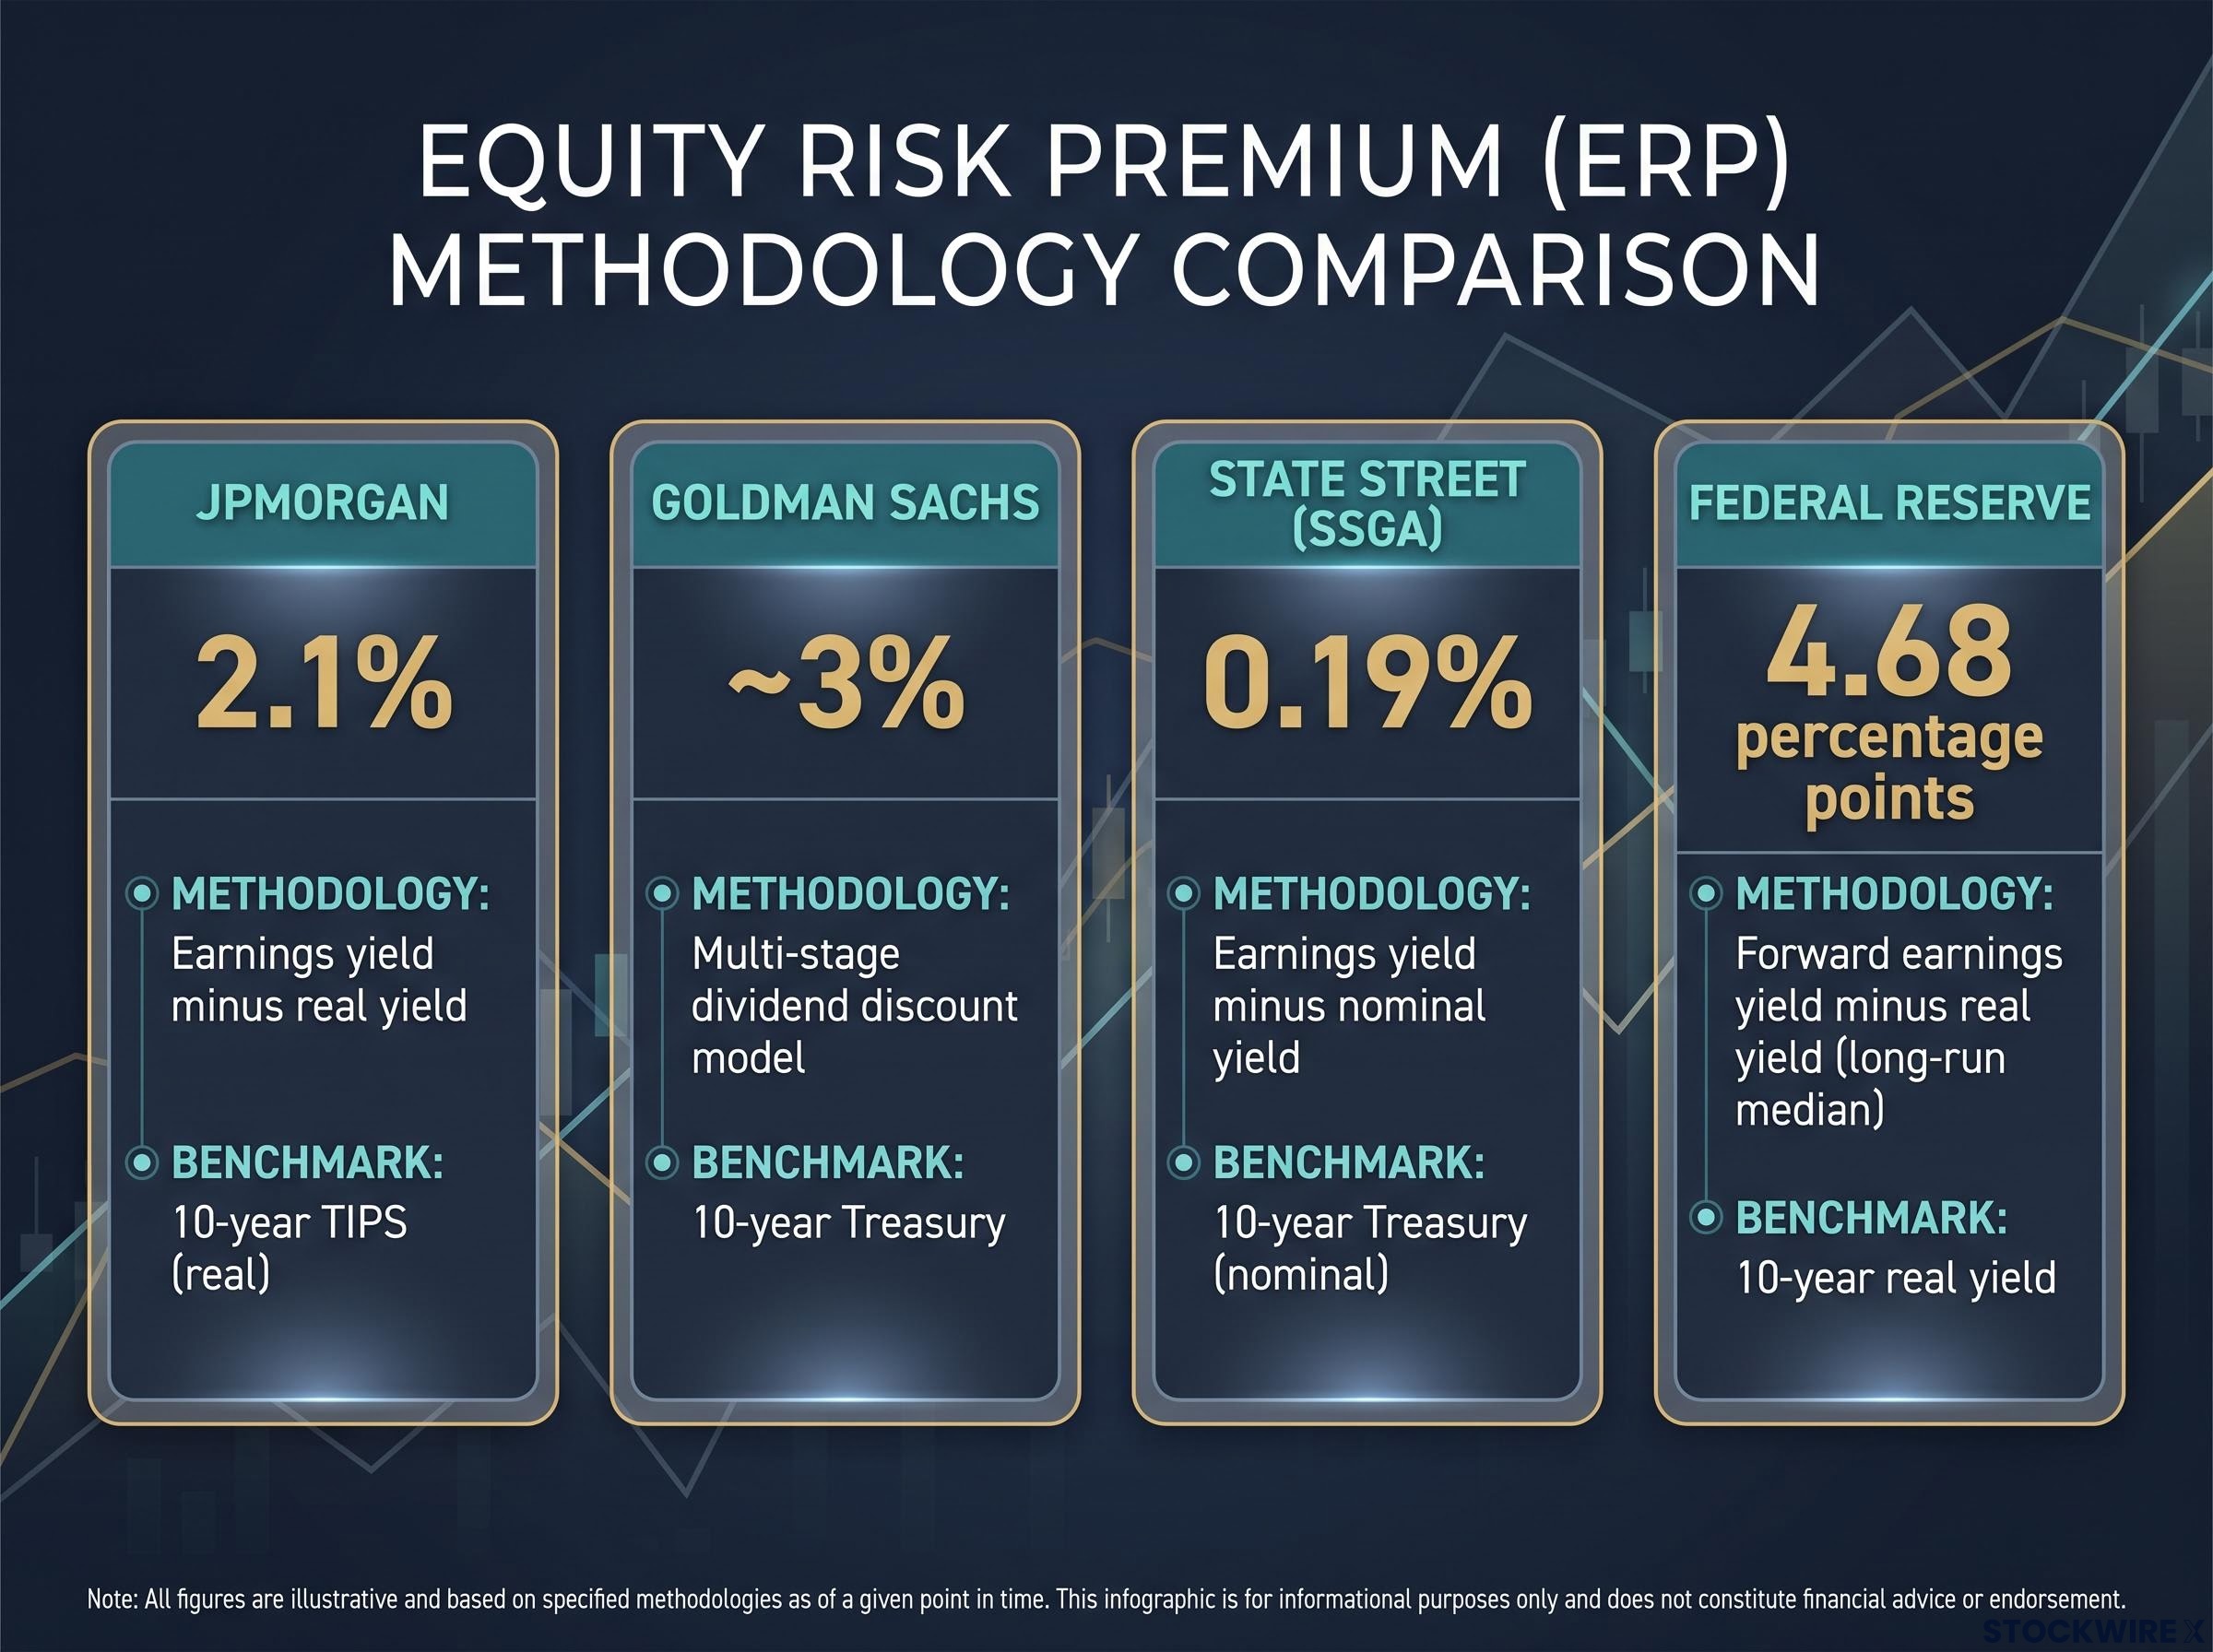
| Institution | ERP methodology | September 2026 estimate | Benchmark used |
|---|---|---|---|
| JPMorgan | Earnings yield minus real yield | 2.1% | 10-year TIPS (real) |
| Goldman Sachs | Multi-stage dividend discount model | ~3% | 10-year Treasury |
| State Street (SSGA) | Earnings yield minus nominal yield | 0.19% | 10-year Treasury (nominal) |
| Federal Reserve | Forward earnings yield minus real yield (long-run median) | 4.68 percentage points | 10-year real yield |
The Federal Reserve’s long-run median of 4.68 percentage points is the benchmark that makes today’s reading legible. When the historical norm sits above four points and the current print is barely half that, the shape of the problem comes into focus.
When big ASX news breaks, our subscribers know first
How the squeeze happened: two forces compressing the premium at once
A thin ERP is not the product of one unusual event. It is the result of two forces arriving together, each pushing on a different side of the calculation.
- The earnings-yield channel. The 2026 equity rally lifted prices faster than corporate earnings grew. Because the earnings yield is earnings divided by price, a rising price with flat earnings mechanically compresses that yield, even if company fundamentals are perfectly healthy.
- The real-yield channel. The 10-year TIPS real yield climbed to roughly 2.60% by 11 September 2026, up from around 1.1% in May 2026, according to First Trust’s analysis. A higher risk-free yield lifts the number you subtract, shrinking the spread from the other end.
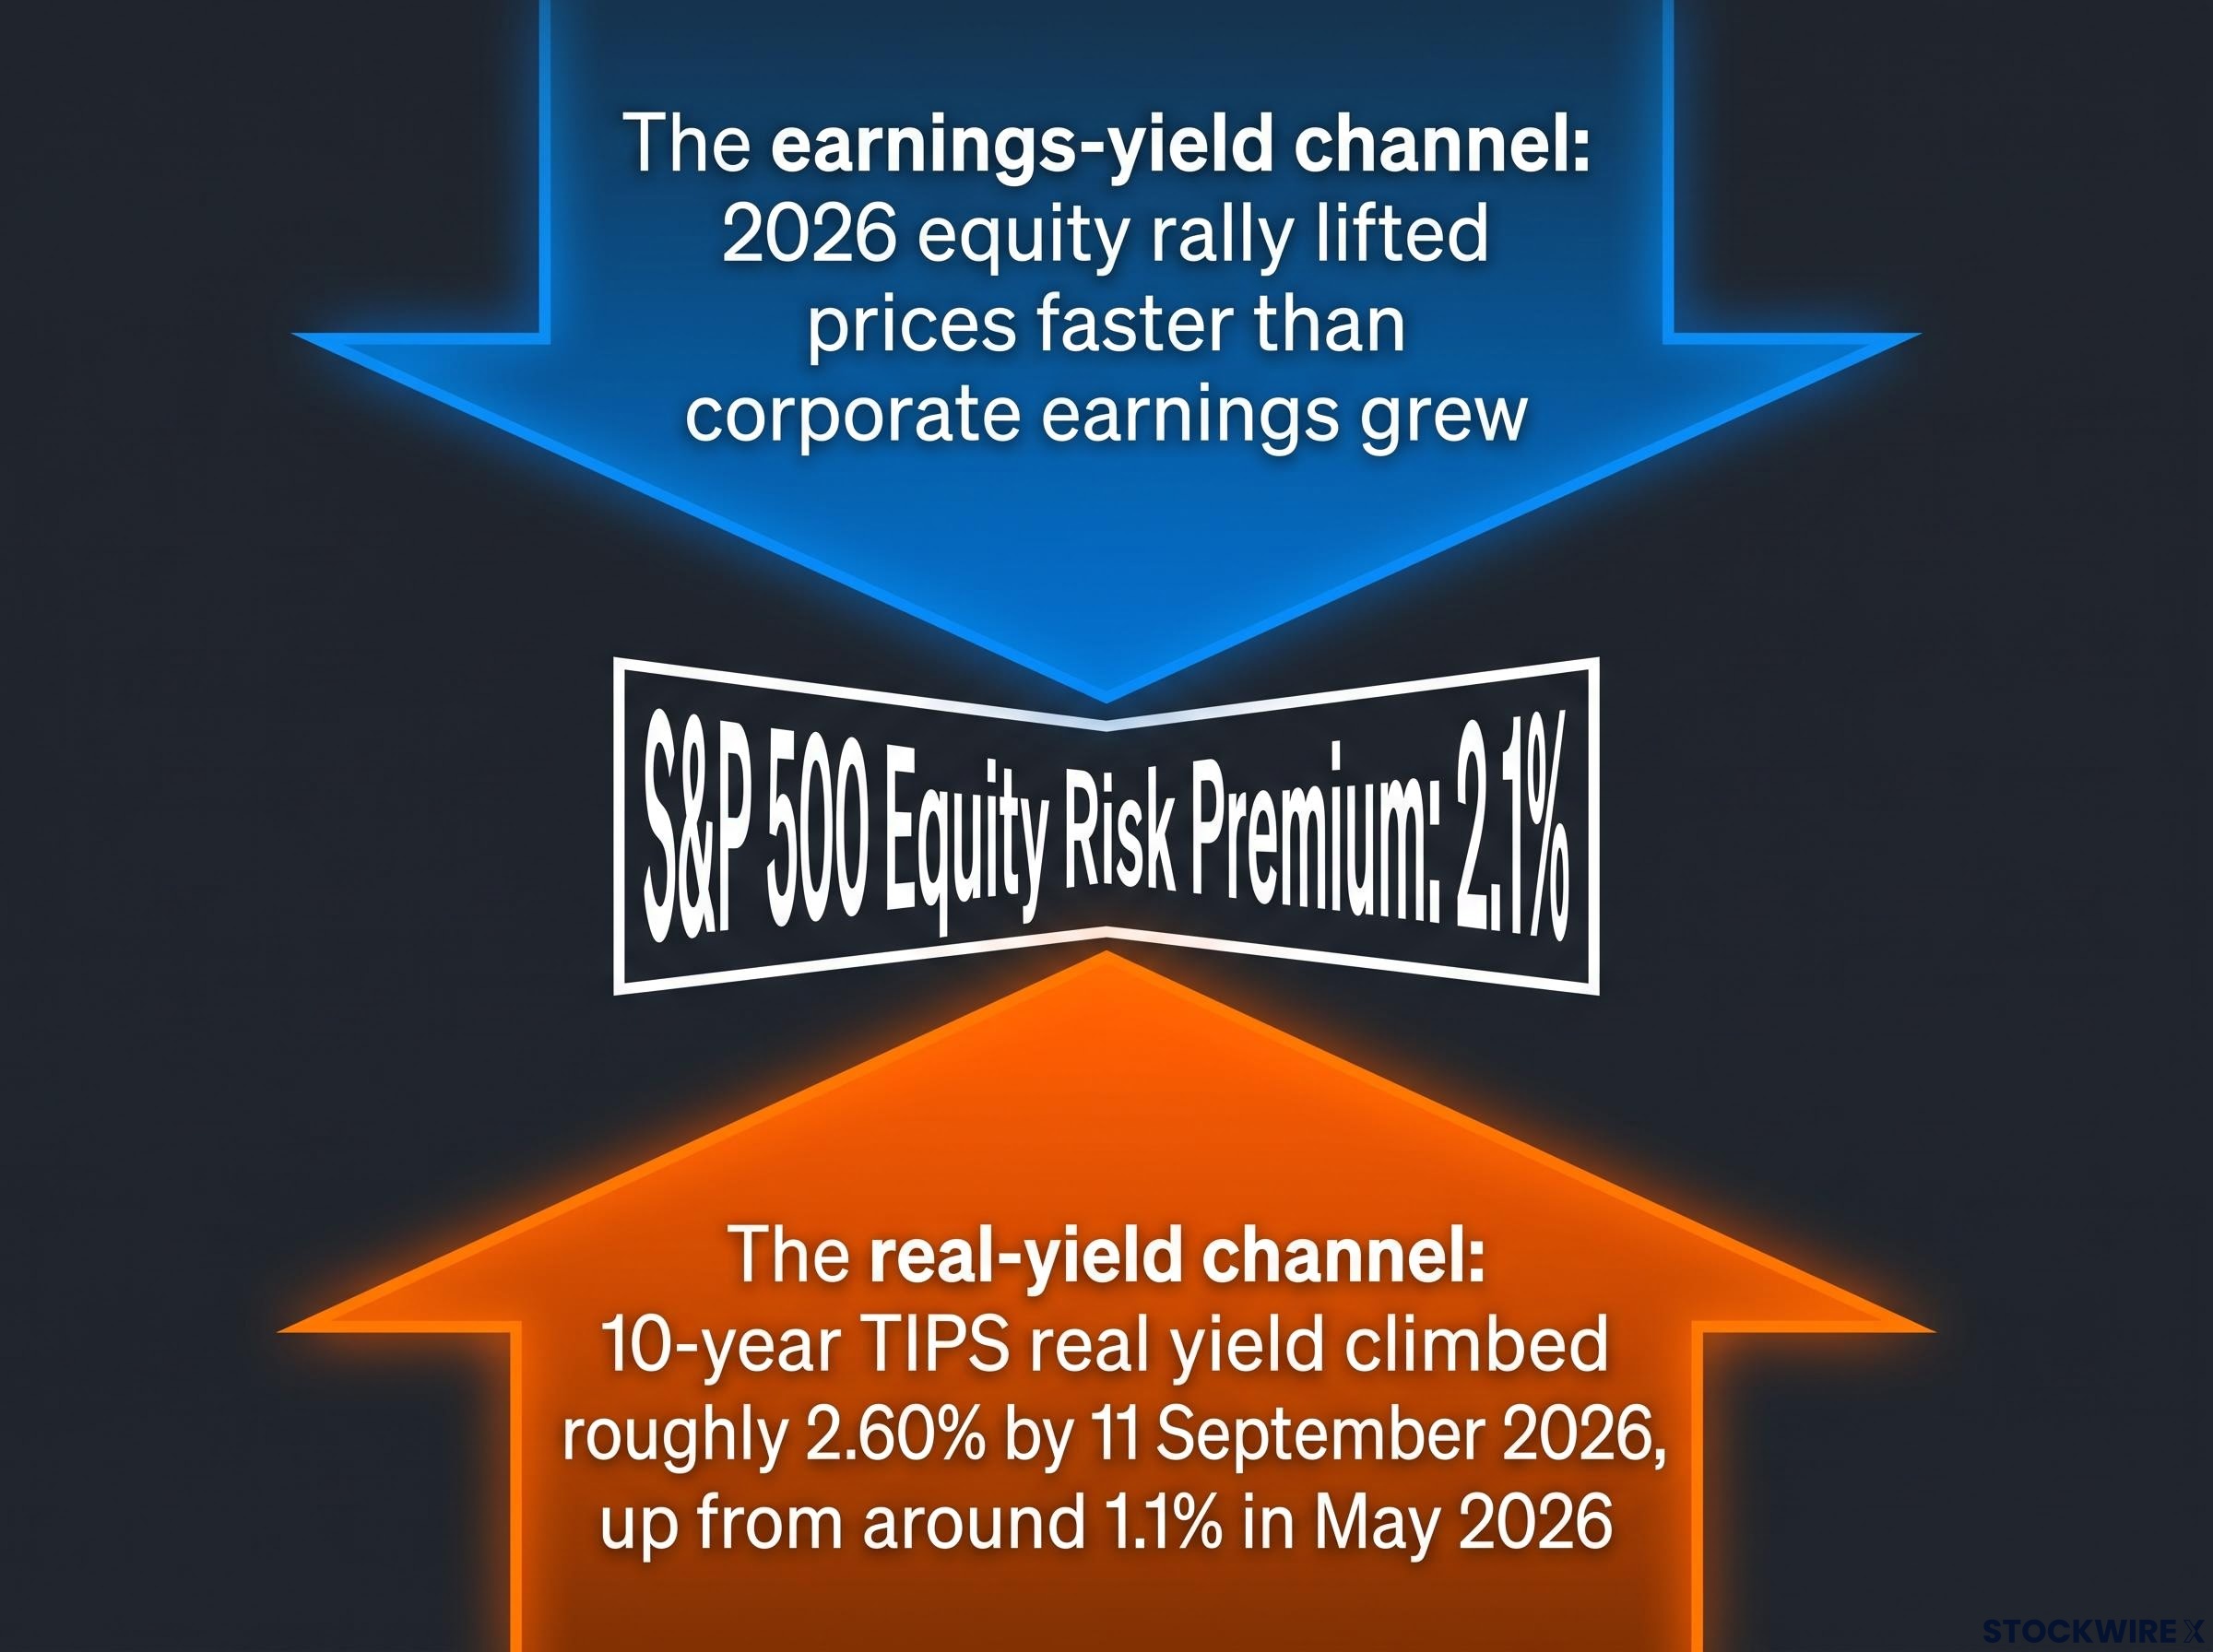
That real-yield move is the part worth pausing on. A jump of roughly 150 basis points in under four months is not a routine wobble. Your equity holdings have been repricing against a rising discount rate the whole time, whether or not the index level has caught up to it yet.
The real Treasury yield mechanics that drove the 10-year TIPS rate from roughly 1.1% to 2.60% in under four months operate through term premium expansion rather than growth optimism, and that distinction matters because term-premium-driven yield rises have historically produced equity drawdowns even before underlying business fundamentals weaken.
For context on the wider yield backdrop, the nominal 10-year sat at 4.96% on 11 September 2026, with breakeven inflation implied at 2.36%, per TreasuryRateWatch and TipsYield.com.
JPMorgan attributes the compression to precisely these two drivers working in tandem: a strong equity rally squeezing the earnings yield, and a steep rise in real bond yields lifting the denominator of the spread. The firm’s strategist flagged the risk months before the reading hit its extreme.
“There is limited space before a further increase in real bond yields starts to become an issue for the equity market,” said Nikolaos Panigirtzoglou, JPMorgan global market strategist, in comments reported by Reuters in May 2026.
What rising real yields do to equity valuations at the stock level
The macro mechanism lands hardest at the individual stock level, and not evenly. When real yields rise, the discount rate applied to future cash flows rises with them, and each dollar of future earnings becomes worth less today.
Long-duration growth stocks, the ones whose profits sit far out in the future, carry the heaviest repricing burden. Their value depends more on distant cash flows, which is exactly what a higher discount rate erodes fastest.
Growth stock discount rates amplify this dynamic because the bulk of a long-duration company’s value sits in cash flows projected five to fifteen years out, meaning even a modest rise in the real risk-free rate removes a disproportionately large slice of present value relative to a business generating most of its earnings today.
With the ERP already compressed, there is no valuation cushion to absorb that repricing. Goldman Sachs notes the S&P 500 forward P/E eased from roughly 22x to 19x across 2026, so some adjustment has happened, yet the premium remains thin. When the buffer is gone, yield-driven repricing hits positions directly rather than being softened by it.
What history says about compressed premia, and how long they can persist
The historical record has plenty to say here, and it is worth letting it speak before drawing conclusions.
JPMorgan points to the 1974-1998 period as its cautionary precedent. High real rates through those decades constrained equity returns and made stocks unusually responsive to bond yield movements, a dynamic the firm warns may be returning.
The late 1990s tell a different but equally instructive story. Research summarised by IESE, drawing on Ritter and Warr, found the implied ERP fell from roughly +12% to -4% between 1979 and 1997, a prolonged compression that ran for years. It did not trigger an immediate correction. Mean reversion arrived only with the 2000-02 dot-com bear market, achieved through collapsing equity prices rather than falling bond yields.
The New York Fed has identified September 1987 and December 1999 as ERP low points, both preceding major market stress. The pattern is consistent: compressed premia have tended to precede weaker forward returns, though rarely on a schedule anyone could trade around.
| Historical episode | Approximate ERP low | Trigger for mean reversion | Outcome for equities |
|---|---|---|---|
| 1972-73 peak/bust | ~-2% per annum | Stagflation, rising real rates | Sharp 1973-74 bear market |
| 1987 (pre-crash) | NY Fed-identified low | October 1987 crash | Rapid valuation reset |
| Late 1990s dot-com | Declined toward -4% (implied) | Equity price collapse (2000-02) | Prolonged bear market |
| 2007 pre-GFC | 2.4% | Financial crisis | Severe drawdown |
| Current 2026 reading | 2.1% | To be determined | To be determined |
Empirical work reinforces the reversion tendency. A study of UK and US markets found ex-ante equity risk premia mean-reverting toward roughly 4.1-4.2% over the 1923-2019 window, close to the Fed’s long-run median of 4.68 percentage points. The gravitational pull toward the historical norm is real, even if the timing is not.
Why the ERP is a calibration tool, not a sell signal
Before you treat 2.1% as a red light, note the honest caveat. Charles Schwab’s research warns that valuations, including the ERP, have historically been poor market-timing instruments, describing them as unreliable for calling tops. Deeply negative readings in the early 1990s preceded a strong bull run, not a crash.
There is also a structural counterargument. Julius Baer contends that assuming valuations must revert to their long-term mean has weakened, given the S&P 500’s shift toward higher-margin, capital-light technology businesses. Today’s index is not a like-for-like match with the one that produced those historical averages.
None of this dismisses the current reading. It simply tells you what the ERP is: a calibration tool for setting return expectations, not a trigger for binary decisions.
What a 2.1% equity risk premium means for how your portfolio is positioned
So what do you actually do with a premium this thin? The honest answer is that it does not tell you to sell. It tells you your margin of safety has narrowed, and that a portfolio built on the assumption that equities will beat bonds by their historical average is now carrying a risk the current pricing does not support.
Institutional investors tend to respond in three recognisable ways when the premium compresses:
- Raise the required return hurdle before committing fresh capital to equities, refusing to pay yesterday’s valuations.
- Shift toward bonds or shorter-duration equity strategies that are less exposed to real-rate moves.
- Lean harder on selectivity, favouring stock-picking and factor strategies over broad passive index exposure.
That last point comes from Robeco, which categorised historical decades by ERP regime and found that low-premium environments, notably the 1930s, 1970s, and early 2000s, coincided with prolonged weak or negative realised equity premiums. Its conclusion is constructive rather than defensive: when the premium fades, alpha matters more than beta.
State Street sharpens the allocation question directly. As Treasury yields climb toward earnings yields, bonds become genuinely competitive on a yield basis, which forces a reassessment of how much you hold in equities purely for the return advantage.
TIPS real yields at roughly 3.05% on the 30-year benchmark place the inflation-protected bond market in the top quartile of real return opportunity since 2000, which is the competitive context that makes a 2.1% equity premium feel thinner than it would have looked against the sub-1% real yields of the post-crisis decade.
“With the ERP at 2.1%, equities have less cushion against further increases in real yields,” warned the Flows and Liquidity team led by Nikolaos Panigirtzoglou, JPMorgan, in September 2026, adding that stocks may react more sharply to bond-market shocks as a result.
Goldman Sachs offers the counterweight worth holding onto. Rising rates do not automatically mean falling stocks, and earnings growth remains the dominant driver of a durable bull market. Goldman stays overweight US equities over a 12-month horizon, treating compressed ERP as a long-term return headwind rather than a signal of imminent correction.
The practical questions for you are concrete. How much real-rate exposure is baked into your equity holdings? Were your allocation assumptions calibrated for the low-rate world of 2009 to 2021? And does selectivity now deserve more weight than passive exposure?
Three variables to watch before the ERP picture changes
Rather than leave you staring at 2.1% with no way to act, here are three observable inputs that would tell you the landscape is shifting. Watch these and you are engaging with the ERP as a living indicator, not a historical footnote.
- The 10-year TIPS real yield, currently 2.60%. This is the single most important variable. If real yields fall, the premium widens mechanically even with equity prices unchanged, easing the current vulnerability at a stroke.
- Forward earnings revisions. If earnings growth accelerates enough to lift the earnings yield, the premium can widen from the equity side rather than the bond side. That is the Goldman Sachs bull case, and it is the outcome that lets stocks stay expensive without losing their edge over bonds.
- Equity price levels. A meaningful index correction would compress the P/E and expand the earnings yield at the same time, widening the premium and resetting the risk-reward balance from the other direction.
Knowing which variable moves first tells you not just that the environment has changed, but why, and whether the shift is durable or fleeting. The historical average sits roughly 100 basis points above the current reading, implying something near 3.1% as a reversion target.
For calibration, remember Panigirtzoglou’s May 2026 framing: there is “some distance” before markets reach late-1990s exuberance, but limited space before a further real-yield rise becomes a genuine problem. That gap is the space you are watching.
This article is for informational purposes only and should not be considered financial advice. Investors should conduct their own research and consult with financial professionals before making investment decisions. Past performance does not guarantee future results, and historical patterns in the equity risk premium may not repeat.
Navigating an equity market with a historically thin margin of safety
At 2.1%, the S&P 500 equity risk premium is not simply below average. It sits more extreme than the eve of the 2007 financial crisis, reached through simultaneous pressure from a powerful equity rally and a sharp rise in real yields. That dual squeeze is what makes this moment structurally different from the ordinary rhythm of expensive markets.
The message is calibration, not alarm. History shows compressed premia can persist for years without a reckoning, and the ERP has never been a reliable sell signal. But the forward return expectations implied by today’s level are materially lower than the post-crisis norm most investors have quietly internalised. Keep the three variables in front of you, the real yield, earnings revisions, and equity prices, and treat this as an environment that rewards awareness and selectivity over passive assumption.