By the time an ETF theme lands on the front page of the financial press and tops the one-year return charts, the gains that put it there have already been made. The crowd arrives late by design: the numbers that attract them are the numbers that record what has already happened.
That asymmetry sits at the heart of recency bias investing, and it has never been easier to act on. The exchange-traded fund era has stripped almost all the friction out of chasing performance.
Intraday trading, near-zero costs, and a growing catalogue of single-theme products mean you can rotate into last quarter’s winner in seconds. The impulse is old. The speed of acting on it is new.
Here is the cognitive wiring that costs investors years of compounding, and what to do instead. This covers the psychological mechanism driving the pattern, a landmark case study where you can watch it unfold in real numbers, the aggregate data on why timing-based strategies fail, and a practical framework for telling a legitimate portfolio adjustment apart from a bias-driven one.
Why your brain treats last year’s winner as next year’s certainty
When you look at a fund that returned 60% last year and decide it belongs in your portfolio, the reasoning feels sound. Strong recent numbers look like evidence. Your brain is doing what it evolved to do: spot a pattern and project it forward.
That instinct has a name. Recency bias is the tendency to overweight recent events relative to long-term base rates when forming expectations about the future. It is not the same as optimism. Optimism is a mood; recency bias is a specific error in how you weigh information, and it applies just as forcefully to fear as to greed.
The psychology of investing connects recency bias to a broader set of cognitive traps, including loss aversion and overtrading, that Barber and Odean’s research found cost the most active individual investors roughly 6.5 percentage points annually compared with their least-active counterparts.
The mechanism that amplifies it is the representativeness heuristic, a mental shortcut where you treat a small sample as if it represents the whole. A short run of strong returns starts to feel like proof of durable skill or a structural edge, rather than what it actually is: one draw from a distribution that includes plenty of bad years too.
The trouble is that market leadership rotates. Vanguard’s twenty-year asset class return data shows that the segments ranking at the top in a given year frequently slide down the table the next, while yesterday’s laggards rotate into the lead. Chasing last year’s winner is often a bet on the least likely outcome.
The ETF market makes this bias unusually cheap to act on. Three features do the damage:
- Intraday liquidity: You can buy or sell any theme at any moment the market is open, so the impulse never has to cool.
- Low trading costs: The financial penalty for acting on a whim has all but disappeared.
- Thematic product design: A single ticker now expresses a narrow market view, so the newest narrative always has a ready-made vehicle.
A 2024 SSRN working paper titled “FLOW” documents that performance chasing is pervasive across modern investment vehicles, with strong flow-performance relationships clearly visible in ETFs. Investors, the research finds, are more confident in recent returns than the evidence warrants.
Schwab Asset Management warning Schwab Asset Management explicitly links recency bias to following a hot investment trend, cautioning that an excessive focus on recent events can undermine an investor’s long-term financial plan.
The result is what advisers call the behaviour gap: the difference between a fund’s actual return and the return investors realise, driven by entering a trend only after the bulk of the rally has already happened. Your instinct to trust recent winners is not laziness. It is a wiring problem, and ETFs have made acting on that wiring faster and cheaper than at any point in market history.
When big ASX news breaks, our subscribers know first
ARKK and the anatomy of a performance-chasing cycle
To see recency bias in real numbers, follow the money into the ARK Innovation ETF (ARKK) and watch when it arrived.
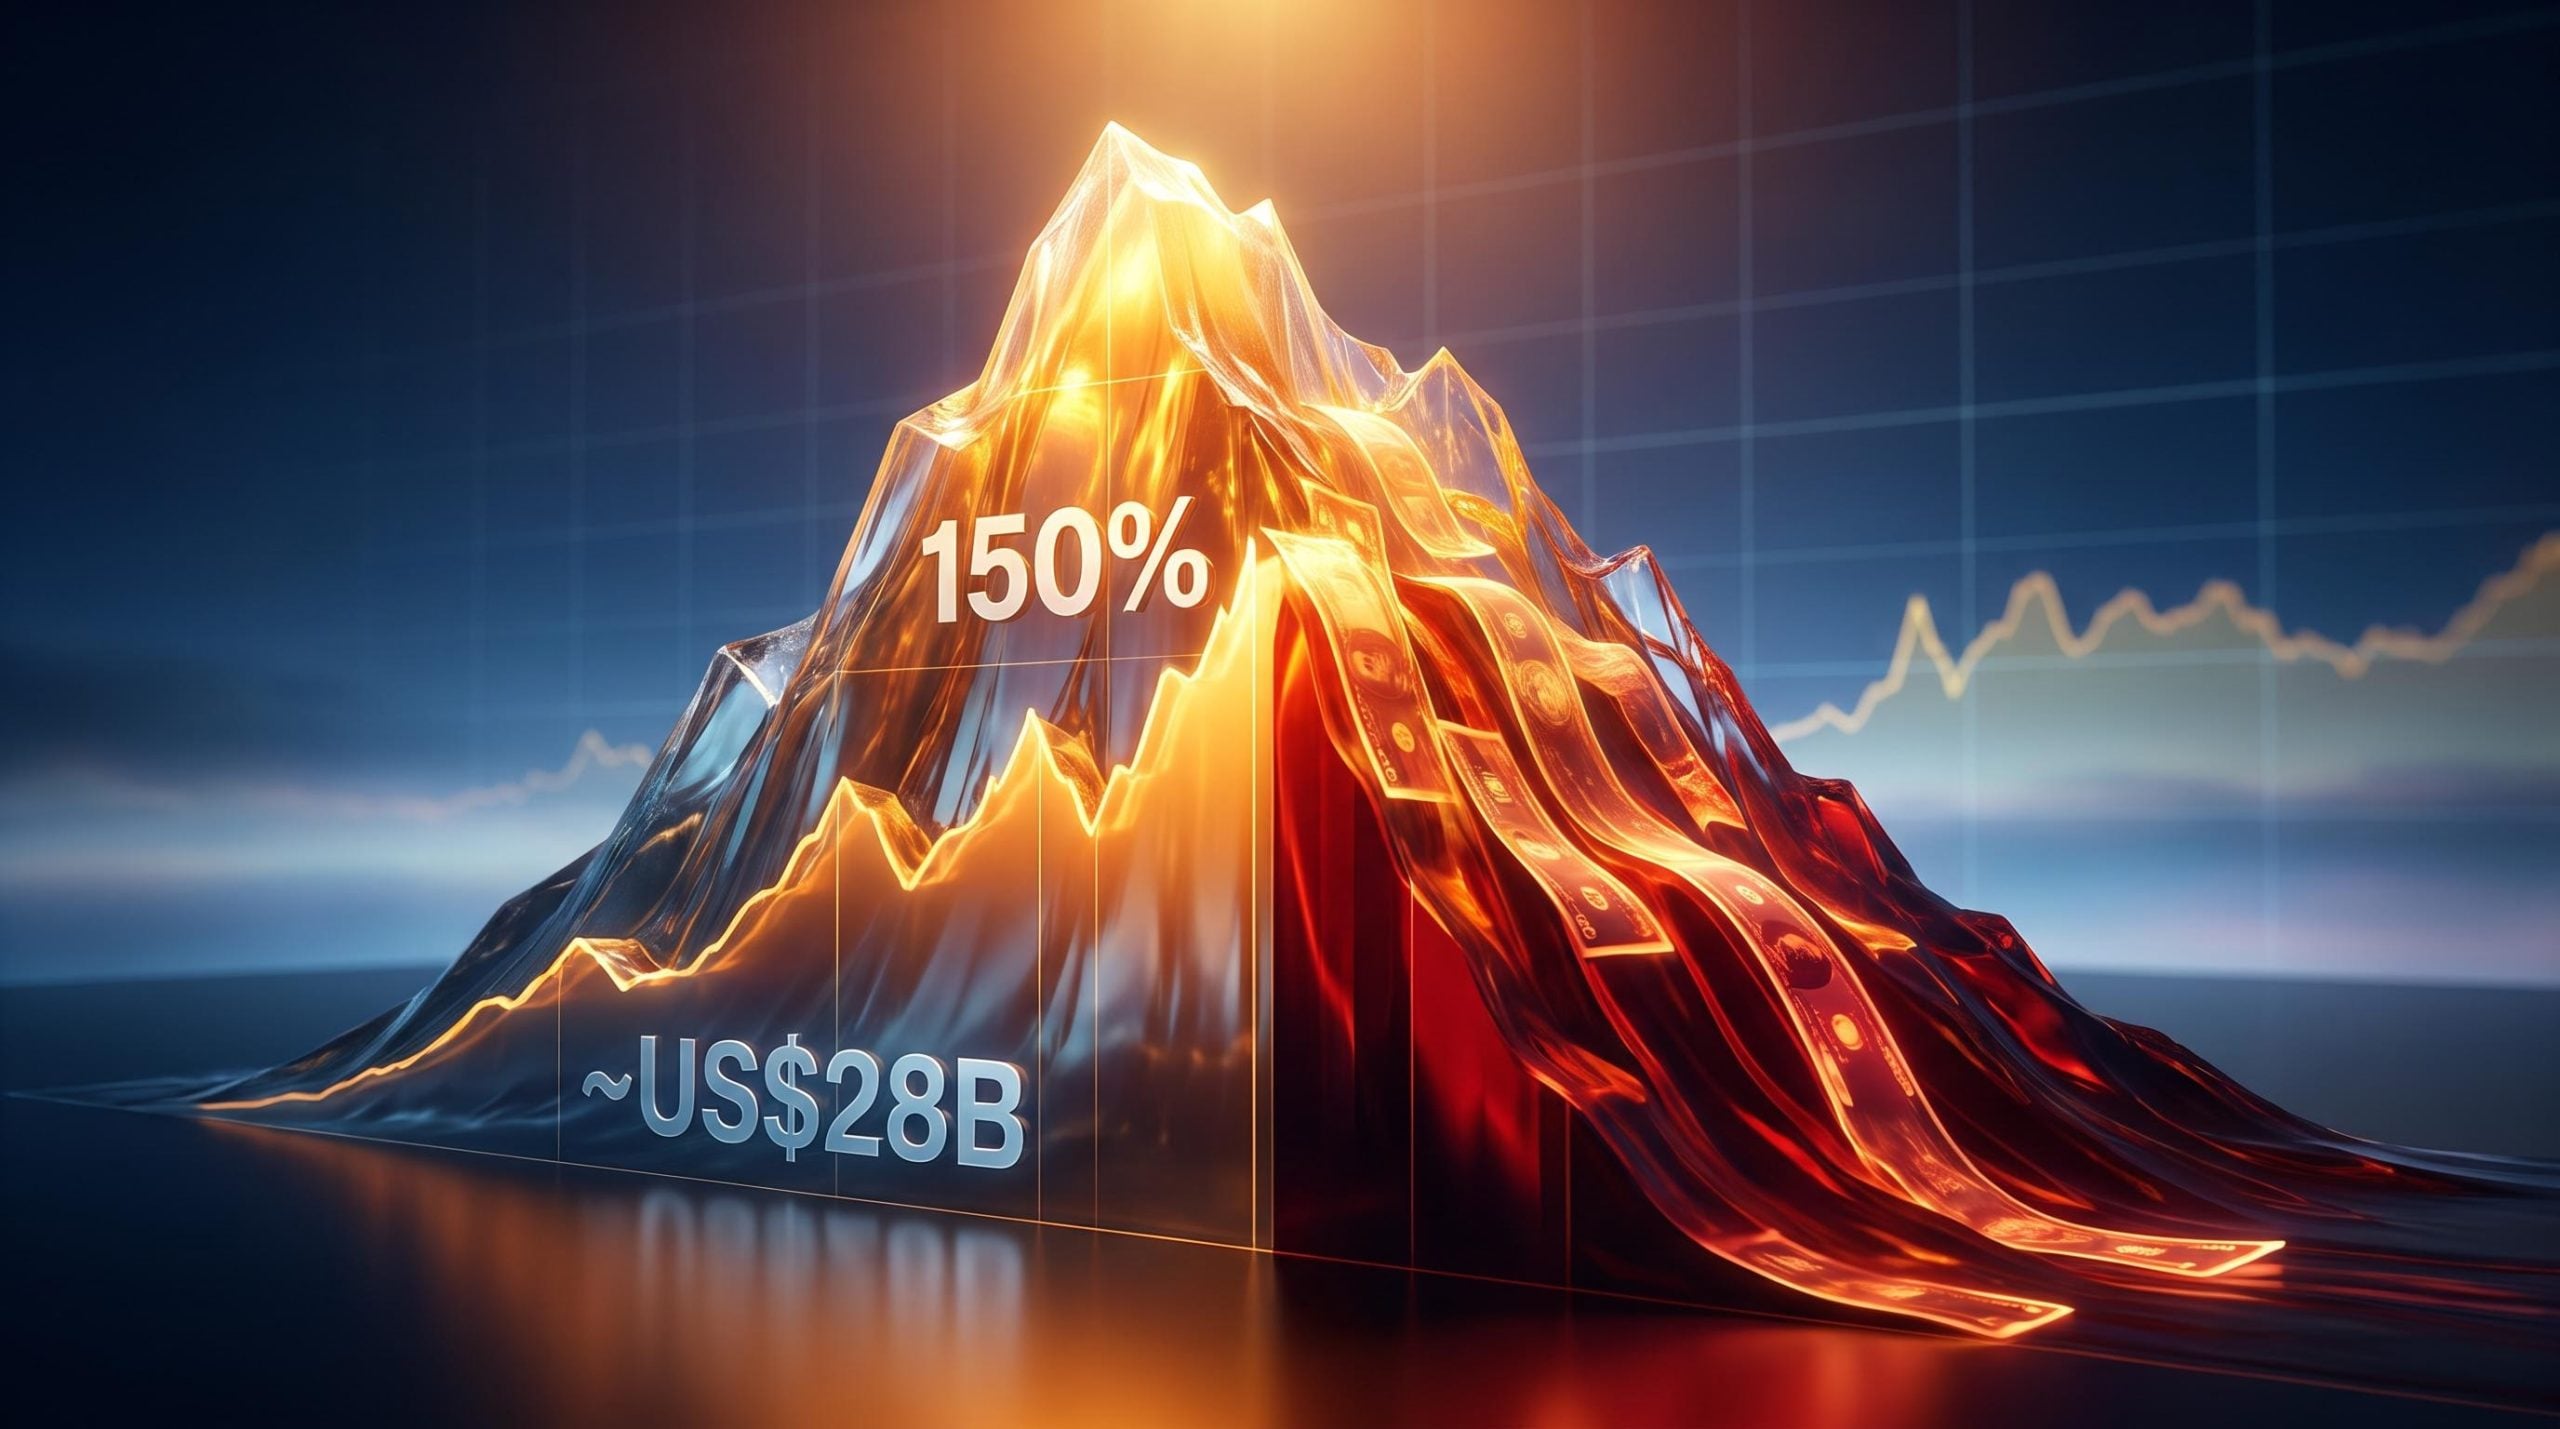
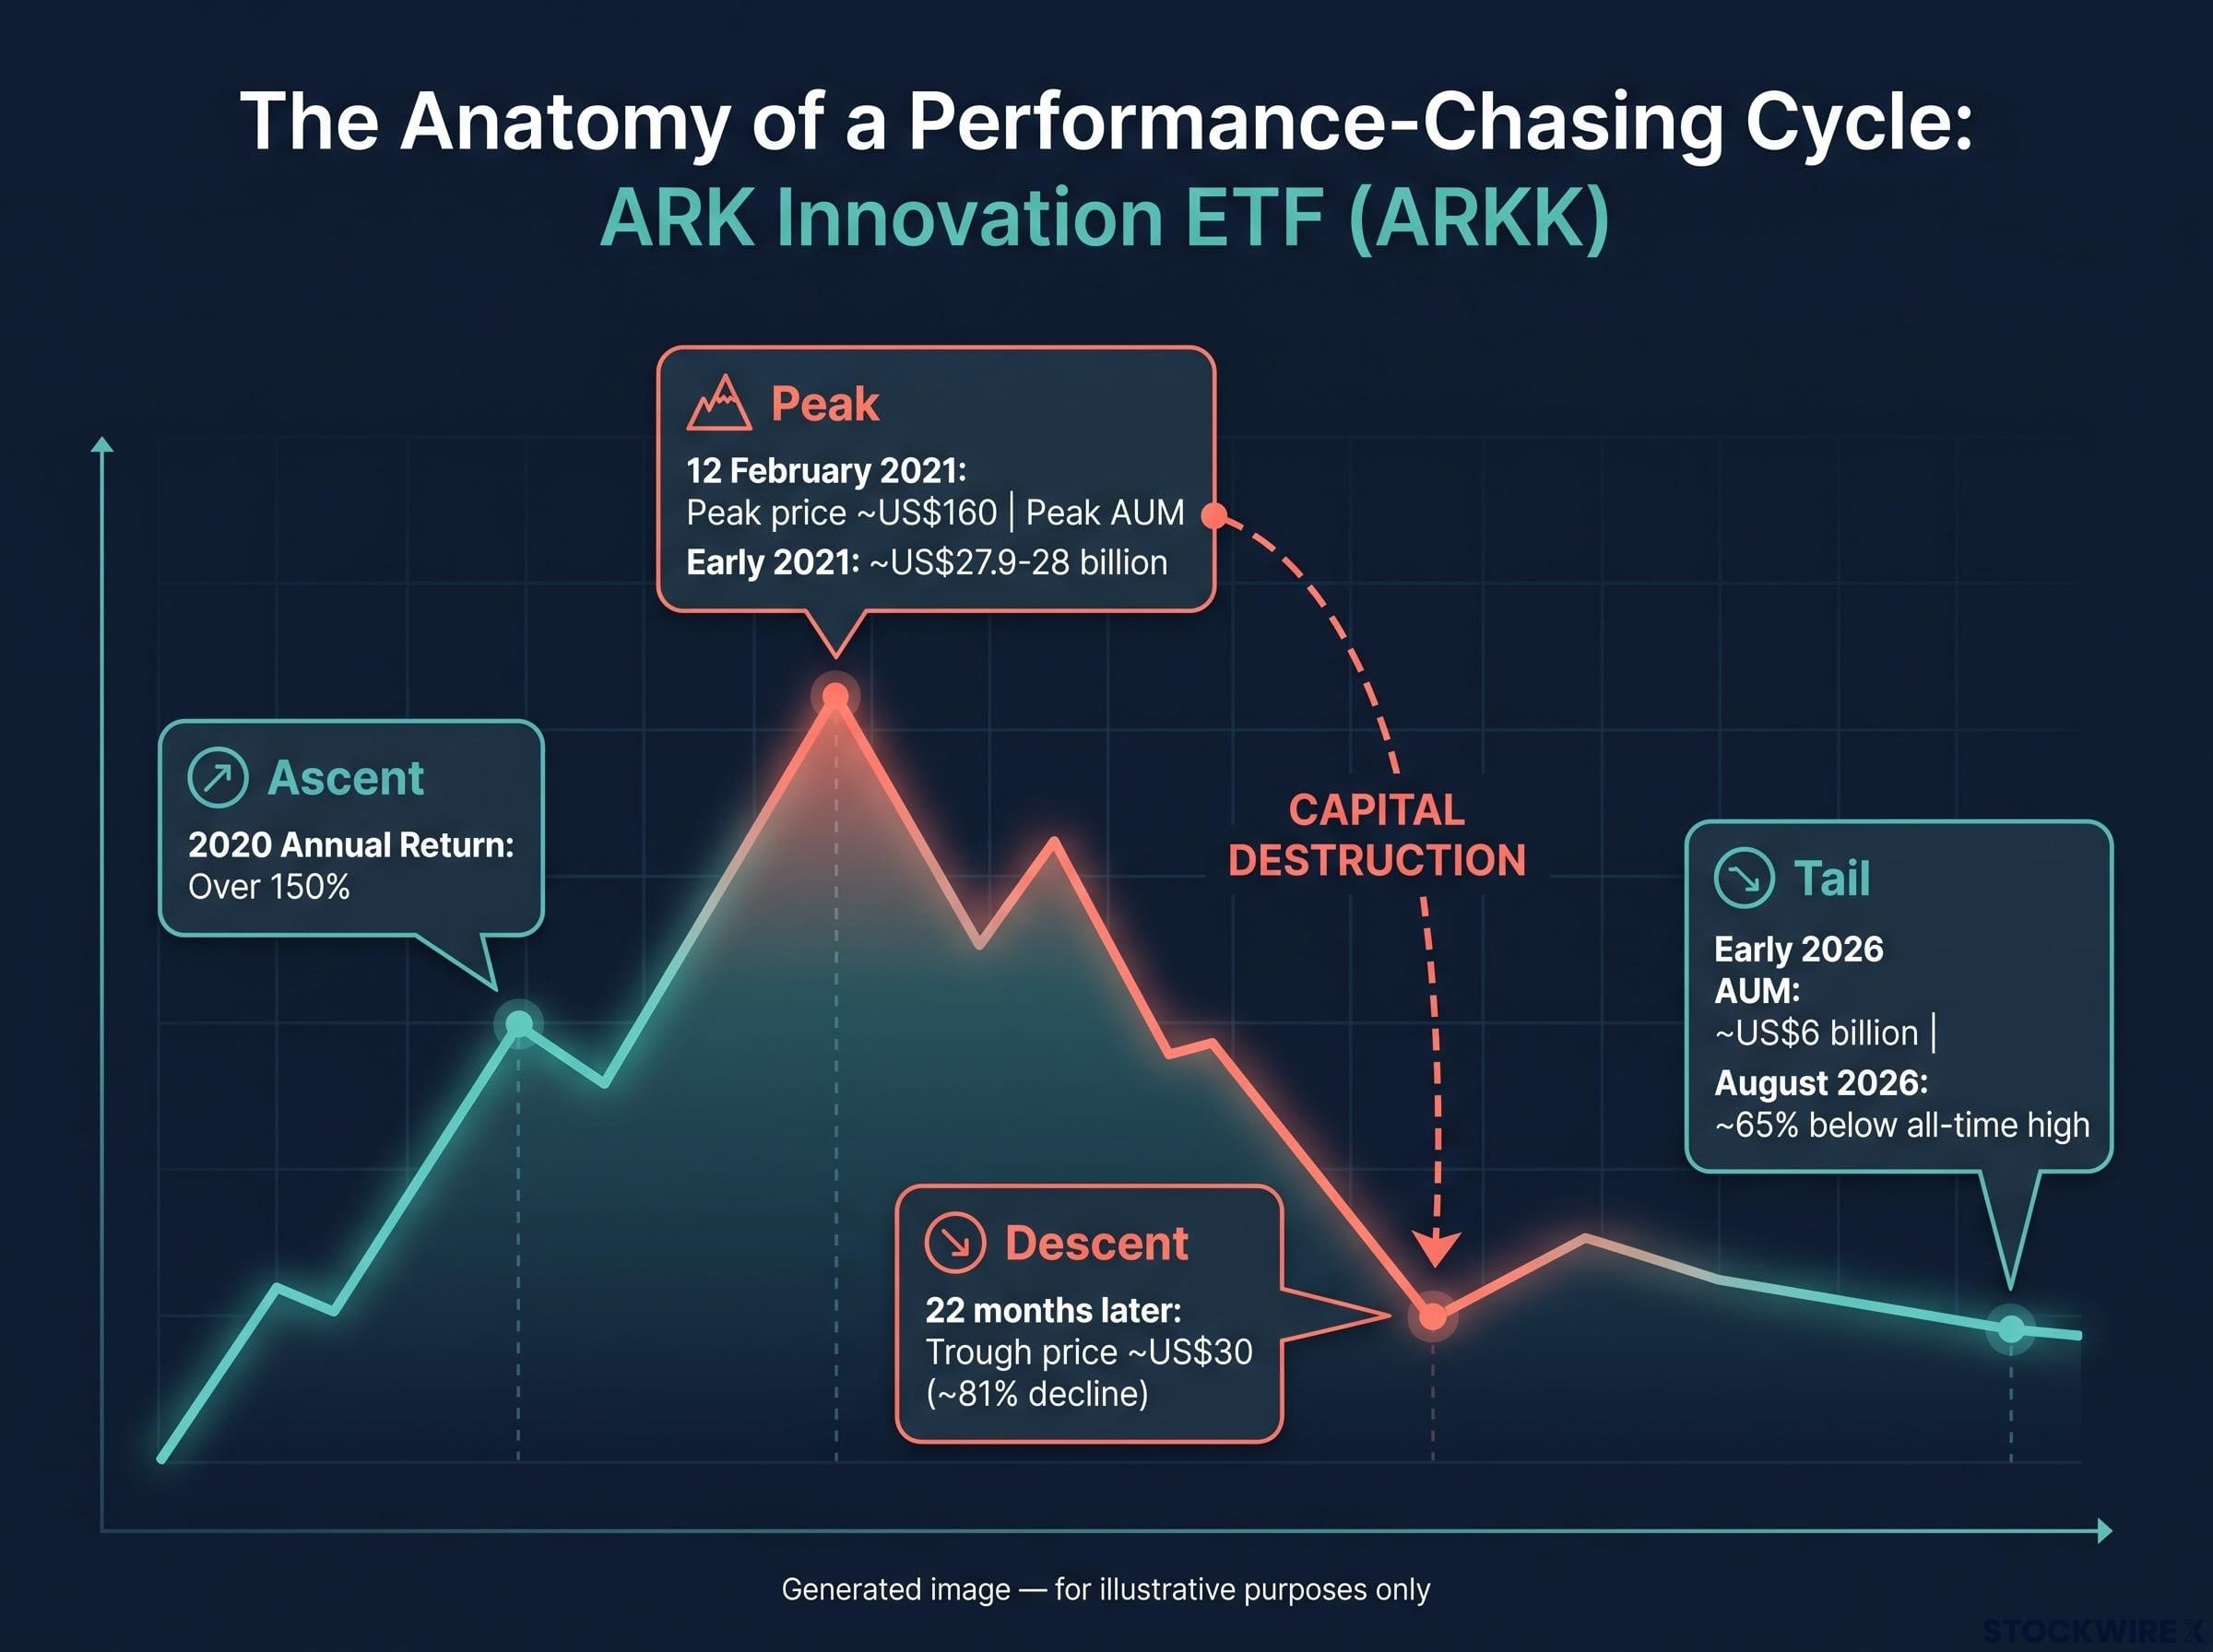
In 2020, ARKK returned more than 150%. Those returns did their job: capital poured in through late 2020 and into 2021, pushing assets under management to a peak near US$27.9-28 billion in early 2021. The critical detail is the timing. The bulk of that money landed after the extraordinary gains, not before them.
The fund peaked on 12 February 2021. Then rising interest rates turned against its concentrated holdings of unprofitable growth companies. Within twenty-two months, ARKK fell roughly 81% in nominal terms, from about US$160 to US$30.
Investors who bought near the top did not experience the 150% year. They experienced the drawdown that followed it.
| Time period | Key metric | Figure |
|---|---|---|
| 2020 | Annual return | Over 150% |
| Early 2021 | Peak assets under management | ~US$27.9-28 billion |
| 12 February 2021 | Peak price | ~US$160 |
| 22 months later | Trough price | ~US$30 (~81% decline) |
| Early 2026 | Assets under management | ~US$6 billion |
| August 2026 | Price vs all-time high | ~65% below |
By early 2026, ARKK’s assets had fallen to roughly US$6 billion, and as of August 2026 the fund remained around 65% below its all-time high in nominal terms. The capital that chased the peak largely left after the losses.
The behaviour gap is not unique to ARKK: Morningstar’s 2025 report estimates thematic funds carry 2-3% annualised underperformance from poor investor timing alone, a figure that compounds silently across the full holding period.
ARKK is not simply a bad fund. It is a precise illustration of what recency bias looks like at scale, and the same signature appears everywhere themes dominate the flow tables. Amid Nvidia’s rally, Morningstar data showed US AI-themed ETF assets rise from US$2.55 billion to US$6.88 billion in the twelve months to end-February 2024. ETF Stream reported that investors flocked to the iShares MSCI Global Semiconductors UCITS ETF and the Xtrackers Artificial Intelligence & Big Data UCITS ETF only after they posted trailing one-year returns of 63.9% and 61.1% respectively.
The scale of the pattern is visible in the aggregate flow data. Invesco’s March 2025 thematic report found that thematic ETFs pulled in US$45.9 billion in 2024, with 94% of that captured by “Next Gen” growth and technology themes.
Invesco flow concentration, 2024 Nearly half of the year’s thematic ETF inflows, some US$22.8 billion, arrived in the fourth quarter alone, after the themes had already run.
That timing asymmetry is the whole story. Money crowds in near the top, not the bottom. The next time a single theme dominates the ETF flow tables, you now know which part of the cycle heavy inflows usually mark.
What the data on tactical allocation actually shows
You might reasonably think the answer is smarter timing: watch the data, spot the turn, and reposition before the crowd. The evidence on funds that do exactly that for a living is not encouraging, and it gets worse the longer you look.
Start with five years. In a February 2025 Morningstar analysis, John Rekenthaler found that over the trailing five years the average tactical fund lagged the average moderate-allocation fund by more than 2 percentage points a year. Measured against a static 60/40 portfolio rebalanced annually, the shortfall doubled to roughly 4 percentage points a year.
Extend the window to a decade and the gap holds. Over the ten years to 30 April 2023, Morningstar found the average tactical fund returned just 2.3% a year, against roughly 7% for a static 60/40 strategy, a shortfall of about 4.4 percentage points annually.
Stretch it to twenty years and the pattern is unchanged. Over the two decades to early 2025, tactical-allocation funds delivered around 5.0% annualised, against 6.4% for moderate-allocation funds and 7.8% for a basic 60/40 portfolio.
| Time horizon | Tactical fund return (annualised) | Static 60/40 return (annualised) | Underperformance gap |
|---|---|---|---|
| 5-year | ~4 points below | Static 60/40, rebalanced annually | ~4 percentage points |
| 10-year | 2.3% | ~7% | ~4.4 percentage points |
| 20-year | ~5.0% | 7.8% | ~2.8 percentage points |
The underperformance is structurally predictable. Successful repositioning requires being right twice, once on the way out and once on the way back in, against a market that already prices in the views of millions of participants at once. Forming a reasonable opinion about market conditions is not the same as translating it into a profitable trade.
Independent research reaches the same conclusion. Fiduciary Wealth Partners reviewed more than 100 tactical strategies from 1994 to 2016 and found they underperformed static index-based strategies by roughly 2 to 5 percentage points a year. Treat that persistence across five, ten, and twenty-year windows as your baseline prior: the shortfall is not a research gap you can close with better analysis, it is built into the strategy itself.
The cost of market timing extends beyond entry decisions: a $100,000 S&P 500 position held continuously for a decade grew to roughly $272,000, but missing just 10 of the market’s best days reduced the ending balance to $153,000, a shortfall produced not by bad analysis but by emotional exits.
The case for tactical allocation, and where it actually holds
Tactical allocation is not indefensible, and it is worth stating the counter-case fairly. Supporters such as Porter Investments and ProFlex Finance argue that rules-based tactical tilts can add value under specific, tightly constrained conditions: a genuine shift in the macro regime, valuations at historical extremes, or the need to smooth withdrawals during retirement drawdown.
In those scenarios, the goal is managing risk and limiting drawdowns rather than maximising raw returns. That distinction matters, because a risk-focused tilt is judged by a different standard than a return-chasing one.
Even proponents agree that any tactical approach that works must be strictly disciplined and rare. The aggregate data reflects what happens when that discipline is absent, which, on the evidence, is most of the time.
What a non-biased portfolio adjustment actually looks like
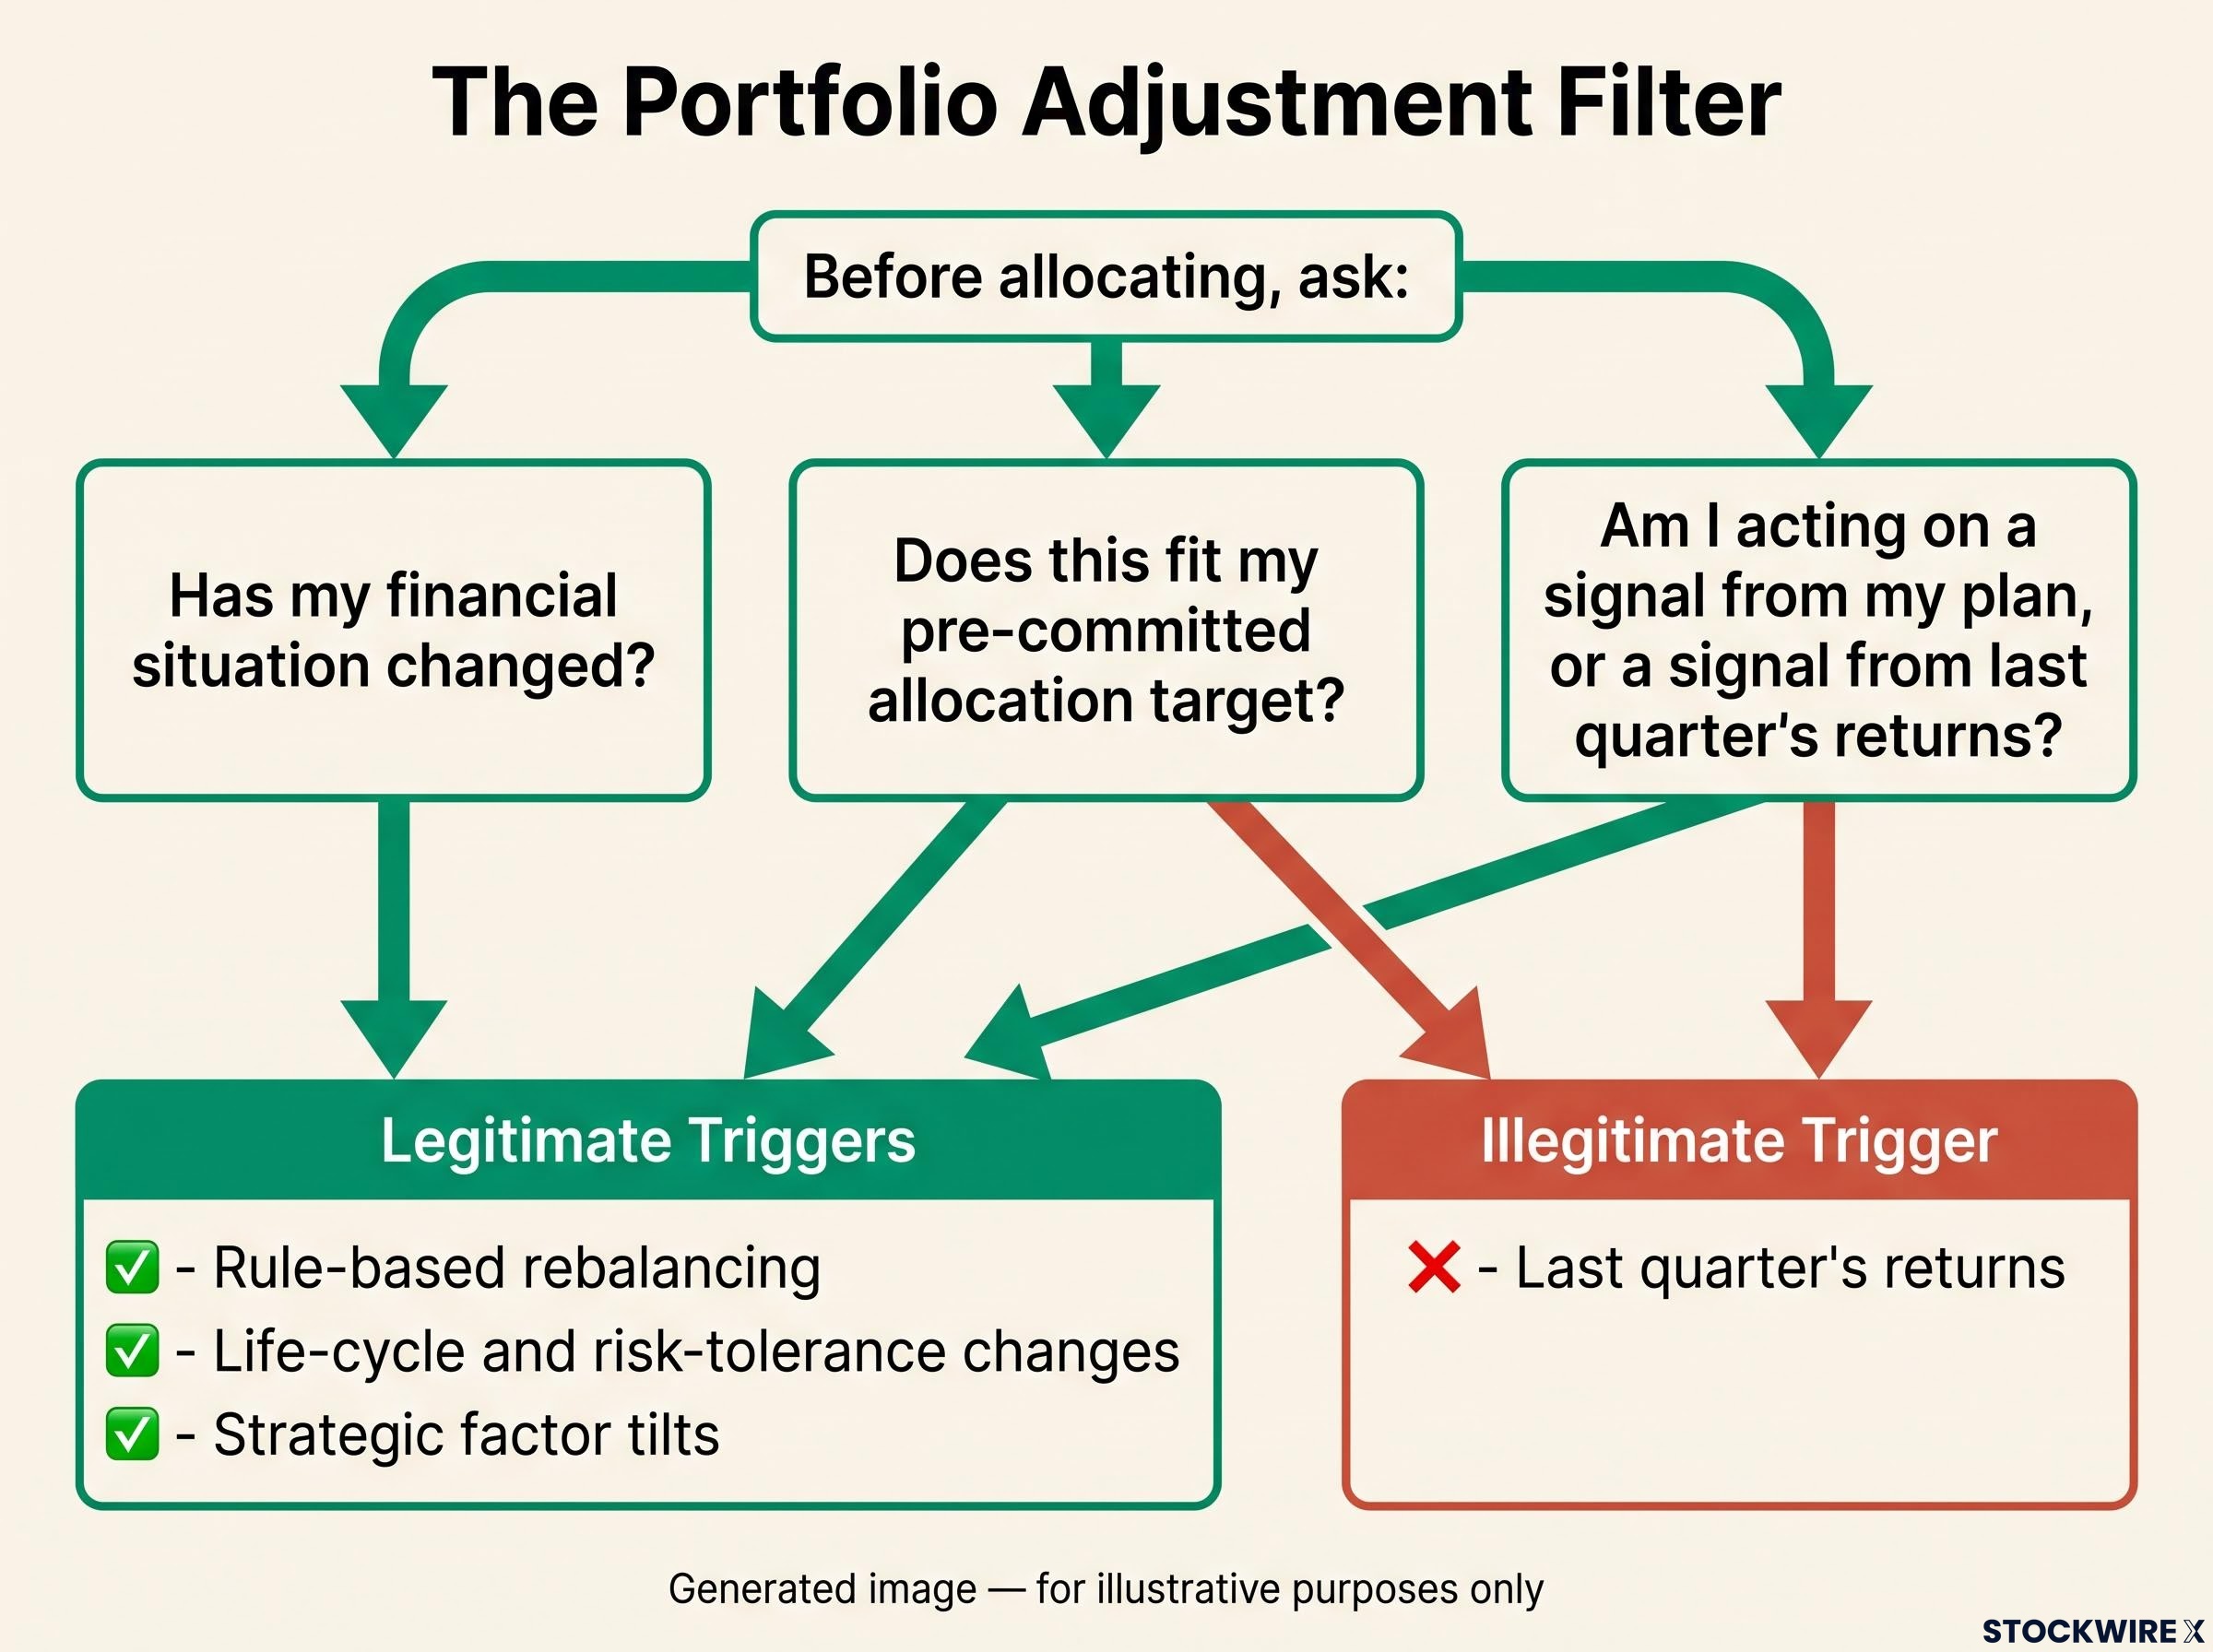
None of this means you freeze your portfolio and never touch it again. There is a clean line between the illegitimate reason to change your ETF holdings, recent performance as the primary signal, and the legitimate ones, which are triggered by your own plan or your own circumstances rather than by last quarter’s returns.
Three legitimate triggers exist, listed here from most clearly distinguishable from bias to least:
- Rule-based rebalancing. You return your portfolio to its target allocation after market moves cause it to drift. This is the cleanest signal because it is defined in advance and has nothing to do with which theme is hot.
- Life-cycle and risk-tolerance changes. As your time horizon shortens or your income needs shift, for example as you approach retirement, you adjust your strategic baseline. These are long-term policy shifts, not market-timing trades.
- Strategic factor tilts. You apply long-term, rules-based tilts toward factors such as value or quality, reviewed over multi-year horizons and grounded in decades of evidence rather than recent news.
Rebalancing deserves special attention because it is structurally the opposite of performance chasing. When a rally pushes your equities above their target weight, rebalancing trims them, selling what has risen, and adds to bonds, buying what has lagged. That is a built-in discipline of selling high and buying low, the exact inverse of chasing the winner.
Rules-based rebalancing operationalises the discipline the article recommends: Vanguard’s framework combines a quarterly review with a 5% drift threshold, meaning the trigger for action is portfolio drift from a pre-committed plan, not a market narrative.
There is a practical limit. Rebalance too often and you rack up trading costs and tax drag without a clear benefit, which is why predefined rules and a written plan matter more than constant tinkering.
SeeItMarket warning SeeItMarket analysts caution that investors abandoning balanced portfolios for all-equity, one-ticket ETF solutions are likely falling victim to recency bias after years of strong equity returns.
The test is simple. A legitimate change is triggered by a shift in your own circumstances or a drift from a plan you committed to in advance. A bias-driven change is triggered by what the market did last quarter. Run any allocation impulse through that filter before you act on it.
Sitting still is a strategy, not an oversight
The conditions that make performance chasing feel rational, rising prices, prominent coverage, and effortless ETF access, are precisely the conditions that historically precede a reversal. The narrative peaks at the same moment the returns do.
This is why a written financial plan and predefined rebalancing rules matter. They are not bureaucratic formalities. They are the only reliable mechanism for inserting a pause between the impulse to reposition and the act of doing it.
Across an investing lifetime, systematic late entry is what produces the behaviour gap, the quiet, cumulative cost of always arriving after the rally. Vanguard’s twenty-year data is the structural reminder underneath all of it: leadership does not persist.
The most useful response to the next compelling ETF narrative is not to research it more carefully. It is to return to your plan and ask whether anything in your own situation has actually changed. Before making any thematic ETF allocation, answer three questions:
- Has my financial situation changed?
- Does this fit my pre-committed allocation target?
- Am I acting on a signal from my plan, or a signal from last quarter’s returns?
If the honest answer is the last one, the impulse is recency bias wearing the costume of an opportunity. The next high-profile theme is already forming somewhere, and you now have the tools to tell the difference.
This article is for informational purposes only and should not be considered financial advice. Investors should conduct their own research and consult with financial professionals before making investment decisions.
Past performance does not guarantee future results. Financial projections are subject to market conditions and various risk factors.