Why a Rising AUD Is Quietly Eroding Your International ETF Returns
1 hr ago

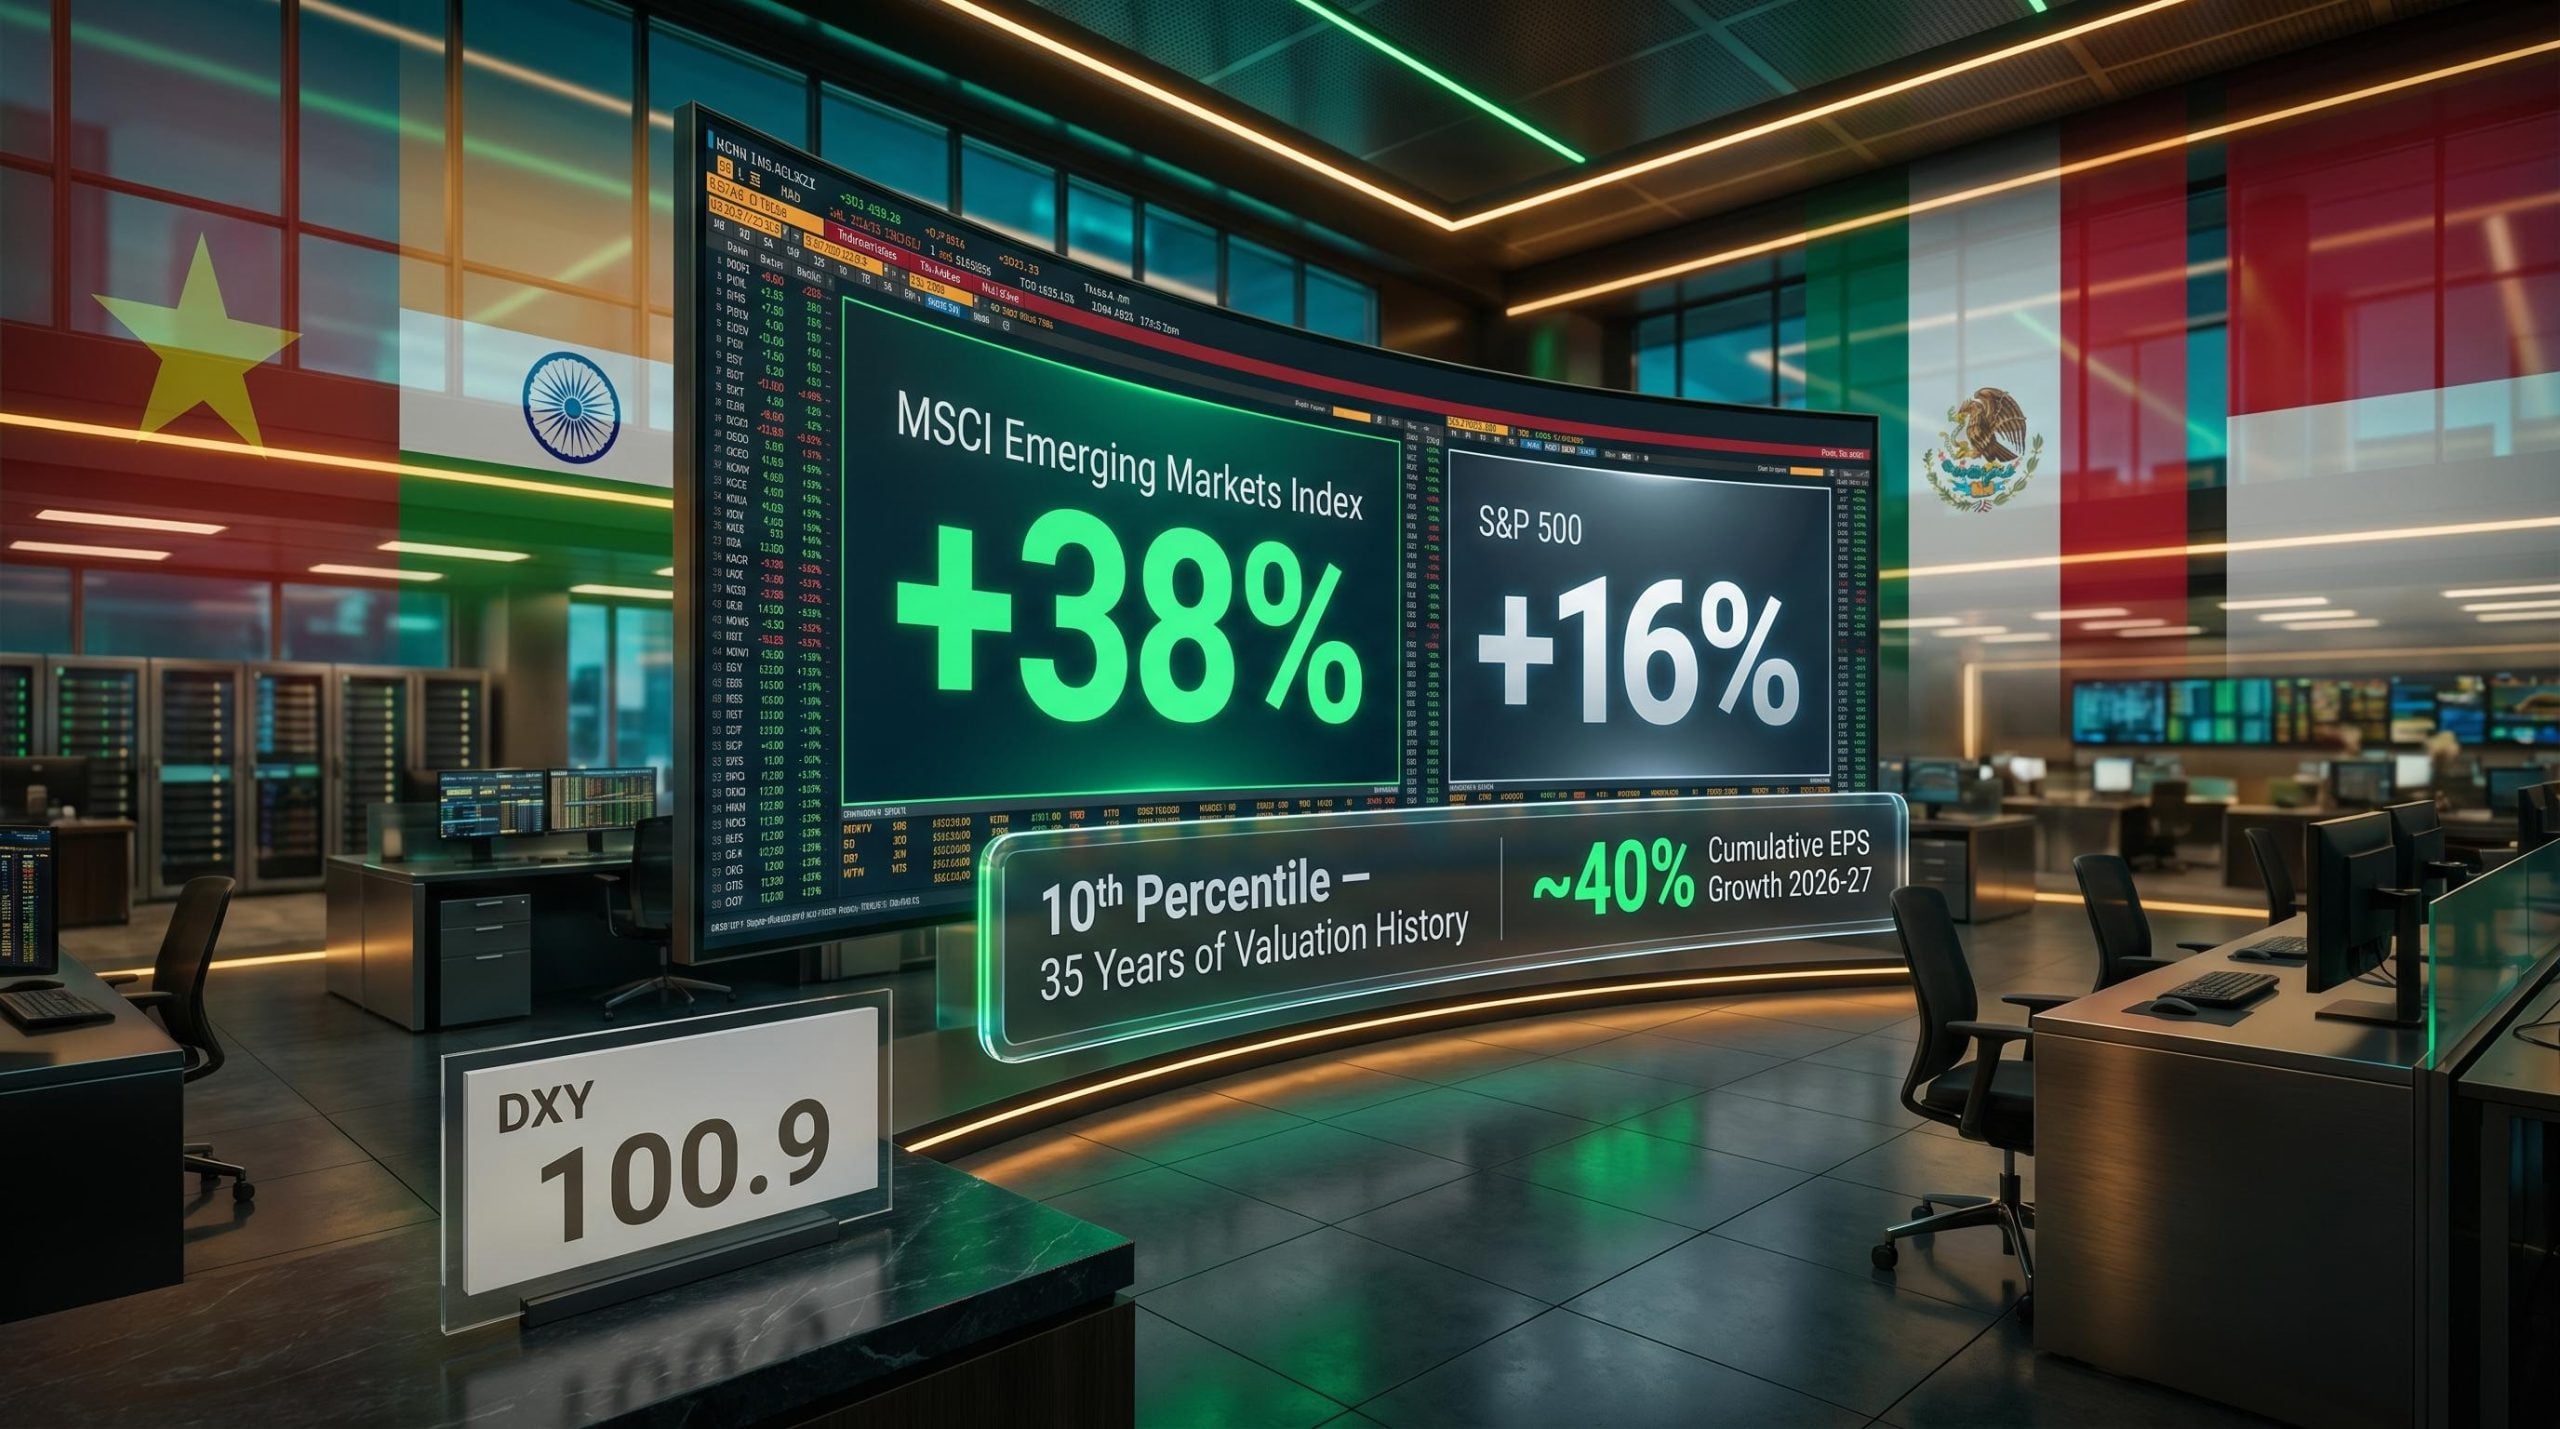
Three ASX-listed emerging market ETFs have returned between 9% and 16% year-to-date in 2026, while the ASX 200 has struggled to hold positive ground and recently touched a seven-week low. For Australian investors concentrated in domestic equities, the performance gap has become difficult to ignore.
The divergence is not accidental. Australia’s sharemarket leans heavily on financials and resources, two sectors that have lagged in a year where Asian technology, semiconductor manufacturing, and consumer growth have driven returns elsewhere. Three funds, iShares MSCI Emerging Markets ETF (IEM), VanEck MSCI Multifactor Emerging Markets Equity ETF (EMKT), and BetaShares MSCI Emerging Markets Complex ETF (BEMG), offer Australian investors access to that growth, but they do so in meaningfully different ways.
This guide explains what is driving the gap, how the three ETFs differ in construction and strategy, and how to evaluate which fund fits a given portfolio. The comparison matters more than usual: all three charge the same 0.69% p.a. management fee, so the decision comes down to index methodology, country weights, and risk tolerance.
The ASX 200 sat at approximately 8,600-8,700 in mid-May 2026, delivering flat to modestly positive returns for the year. That headline number masks a more uncomfortable picture: the index touched a seven-week low during the month, and the sectors responsible for the weakness are not cyclical laggards likely to snap back. They are the market’s structural pillars.
Australia’s largest index carries an outsized concentration in two areas: banks and mining companies. When those sectors stall, the entire market stalls with them. The structural disadvantages of that concentration are now visible:
The structural shift toward international ETFs is already visible in flow data: $6.9 billion moved into international equity ETFs across the Australian market in Q1 2026 alone, with international funds overtaking domestic funds as the most purchased ETF category on the Selfwealth by Syfe platform for the first time on record.
“The risk-reward now favours EM for new equity capital,” one portfolio manager told the Australian Financial Review in early 2026.
That assessment is not about chasing performance. It reflects a structural observation: the sectors lifting emerging market indices are the same sectors the ASX largely lacks. For investors whose portfolios mirror the domestic index, the question is whether that gap warrants a deliberate allocation shift.
Emerging markets are economies undergoing accelerated industrialisation that have not yet reached developed-market status. India, Brazil, Indonesia, and Vietnam are representative examples: countries where rising incomes, expanding infrastructure, and growing consumer demand create a growth profile distinct from the mature economies of the US, Europe, or Australia.
Three structural forces underpin the investment thesis. First, expanding middle classes across Asia, Latin America, and parts of Africa are driving consumer spending growth that mature economies cannot replicate. Second, infrastructure investment in transport, energy, and digital connectivity remains at an earlier stage, creating a longer runway for capital deployment. Third, the “China+1” supply-chain diversification trend, where multinational manufacturers shift production away from exclusive reliance on China, is channelling foreign direct investment into countries like India, Vietnam, and Indonesia.
India’s real GDP growth of approximately 6-7% illustrates the scale of the opportunity. That growth rate, sustained across a decade, supports earnings expansion across financials, consumer goods, and technology services.
The same characteristics that create growth also create volatility. Political instability, particularly in China, can shift sentiment across an entire index overnight. Currency fluctuations between the Australian dollar and emerging market currencies introduce a layer of return variability absent from domestic equities. Regulatory frameworks in developing economies tend to be less predictable than in Australia or the US.
During global risk-off episodes, emerging market equities historically experience amplified drawdowns relative to developed markets. Research from Livewire Markets notes that EM equities trade at materially lower price-to-book and forward price-to-earnings ratios than Australia’s large-cap banks and miners complex, reflecting both genuine value and the higher risk investors demand to hold them.
Geoeconomic fragmentation adds a layer of structural risk to any EM allocation that country-weight tables alone do not capture: the IMF warns that severe fragmentation could reduce global GDP by up to 7-8% long term, and the ‘China+1’ supply-chain shift that is channelling investment into India and Vietnam is itself a product of the industrial policy divergence now separating regional blocs.
The ASIC MoneySmart guidance on ETF risks identifies currency risk, liquidity risk, and tracking error as the primary considerations Australian retail investors should weigh when selecting an ETF, each of which applies with additional force to emerging market products relative to domestic equity funds.
All three ETFs charge the same management fee: 0.69% p.a. That identical pricing means the fee line on a comparison spreadsheet is a dead heat, and the real decision variables lie in what each fund actually owns and how it selects its holdings.
IEM is the plain-vanilla option. It passively replicates the MSCI Emerging Markets Index, a free-float-adjusted, market-capitalisation-weighted benchmark covering large and mid-cap companies across the developing world. With approximately $1.715 billion in funds under management as of May 2026 and the longest track record of the three, it offers the most liquidity and the most straightforward exposure.
EMKT starts from the same MSCI Emerging Markets universe but applies a four-factor screen to select and weight its holdings. Those four factors are:
The result is a concentrated portfolio designed to capture factor-driven excess returns, at the cost of higher tracking error relative to the broad index. VanEck, the fund’s issuer, frames the approach as targeting “structural growth at reasonable prices.”
BEMG is the newest of the three, with an inception date of 22 August 2025 and approximately $105.73 million in funds under management. BetaShares describes it as offering broad “complex” emerging market exposure, potentially including segments beyond the standard MSCI EM universe. It is not an ex-China product; rather, it aims to provide diversified access across a wider set of developing economies.
| ETF Ticker | Index Tracked | Strategy Type | AUM (May 2026) |
|---|---|---|---|
| IEM | MSCI Emerging Markets Index | Passive, market-cap-weighted | ~$1.715B |
| EMKT | MSCI EM Diversified Multiple-Factor Index | Multifactor (value, momentum, quality, low size) | Not confirmed |
| BEMG | MSCI Emerging Markets Complex ETF | Broad/complex EM basket | ~$105.73M |
The year-to-date numbers tell one story. The country and sector weights underneath them explain why.
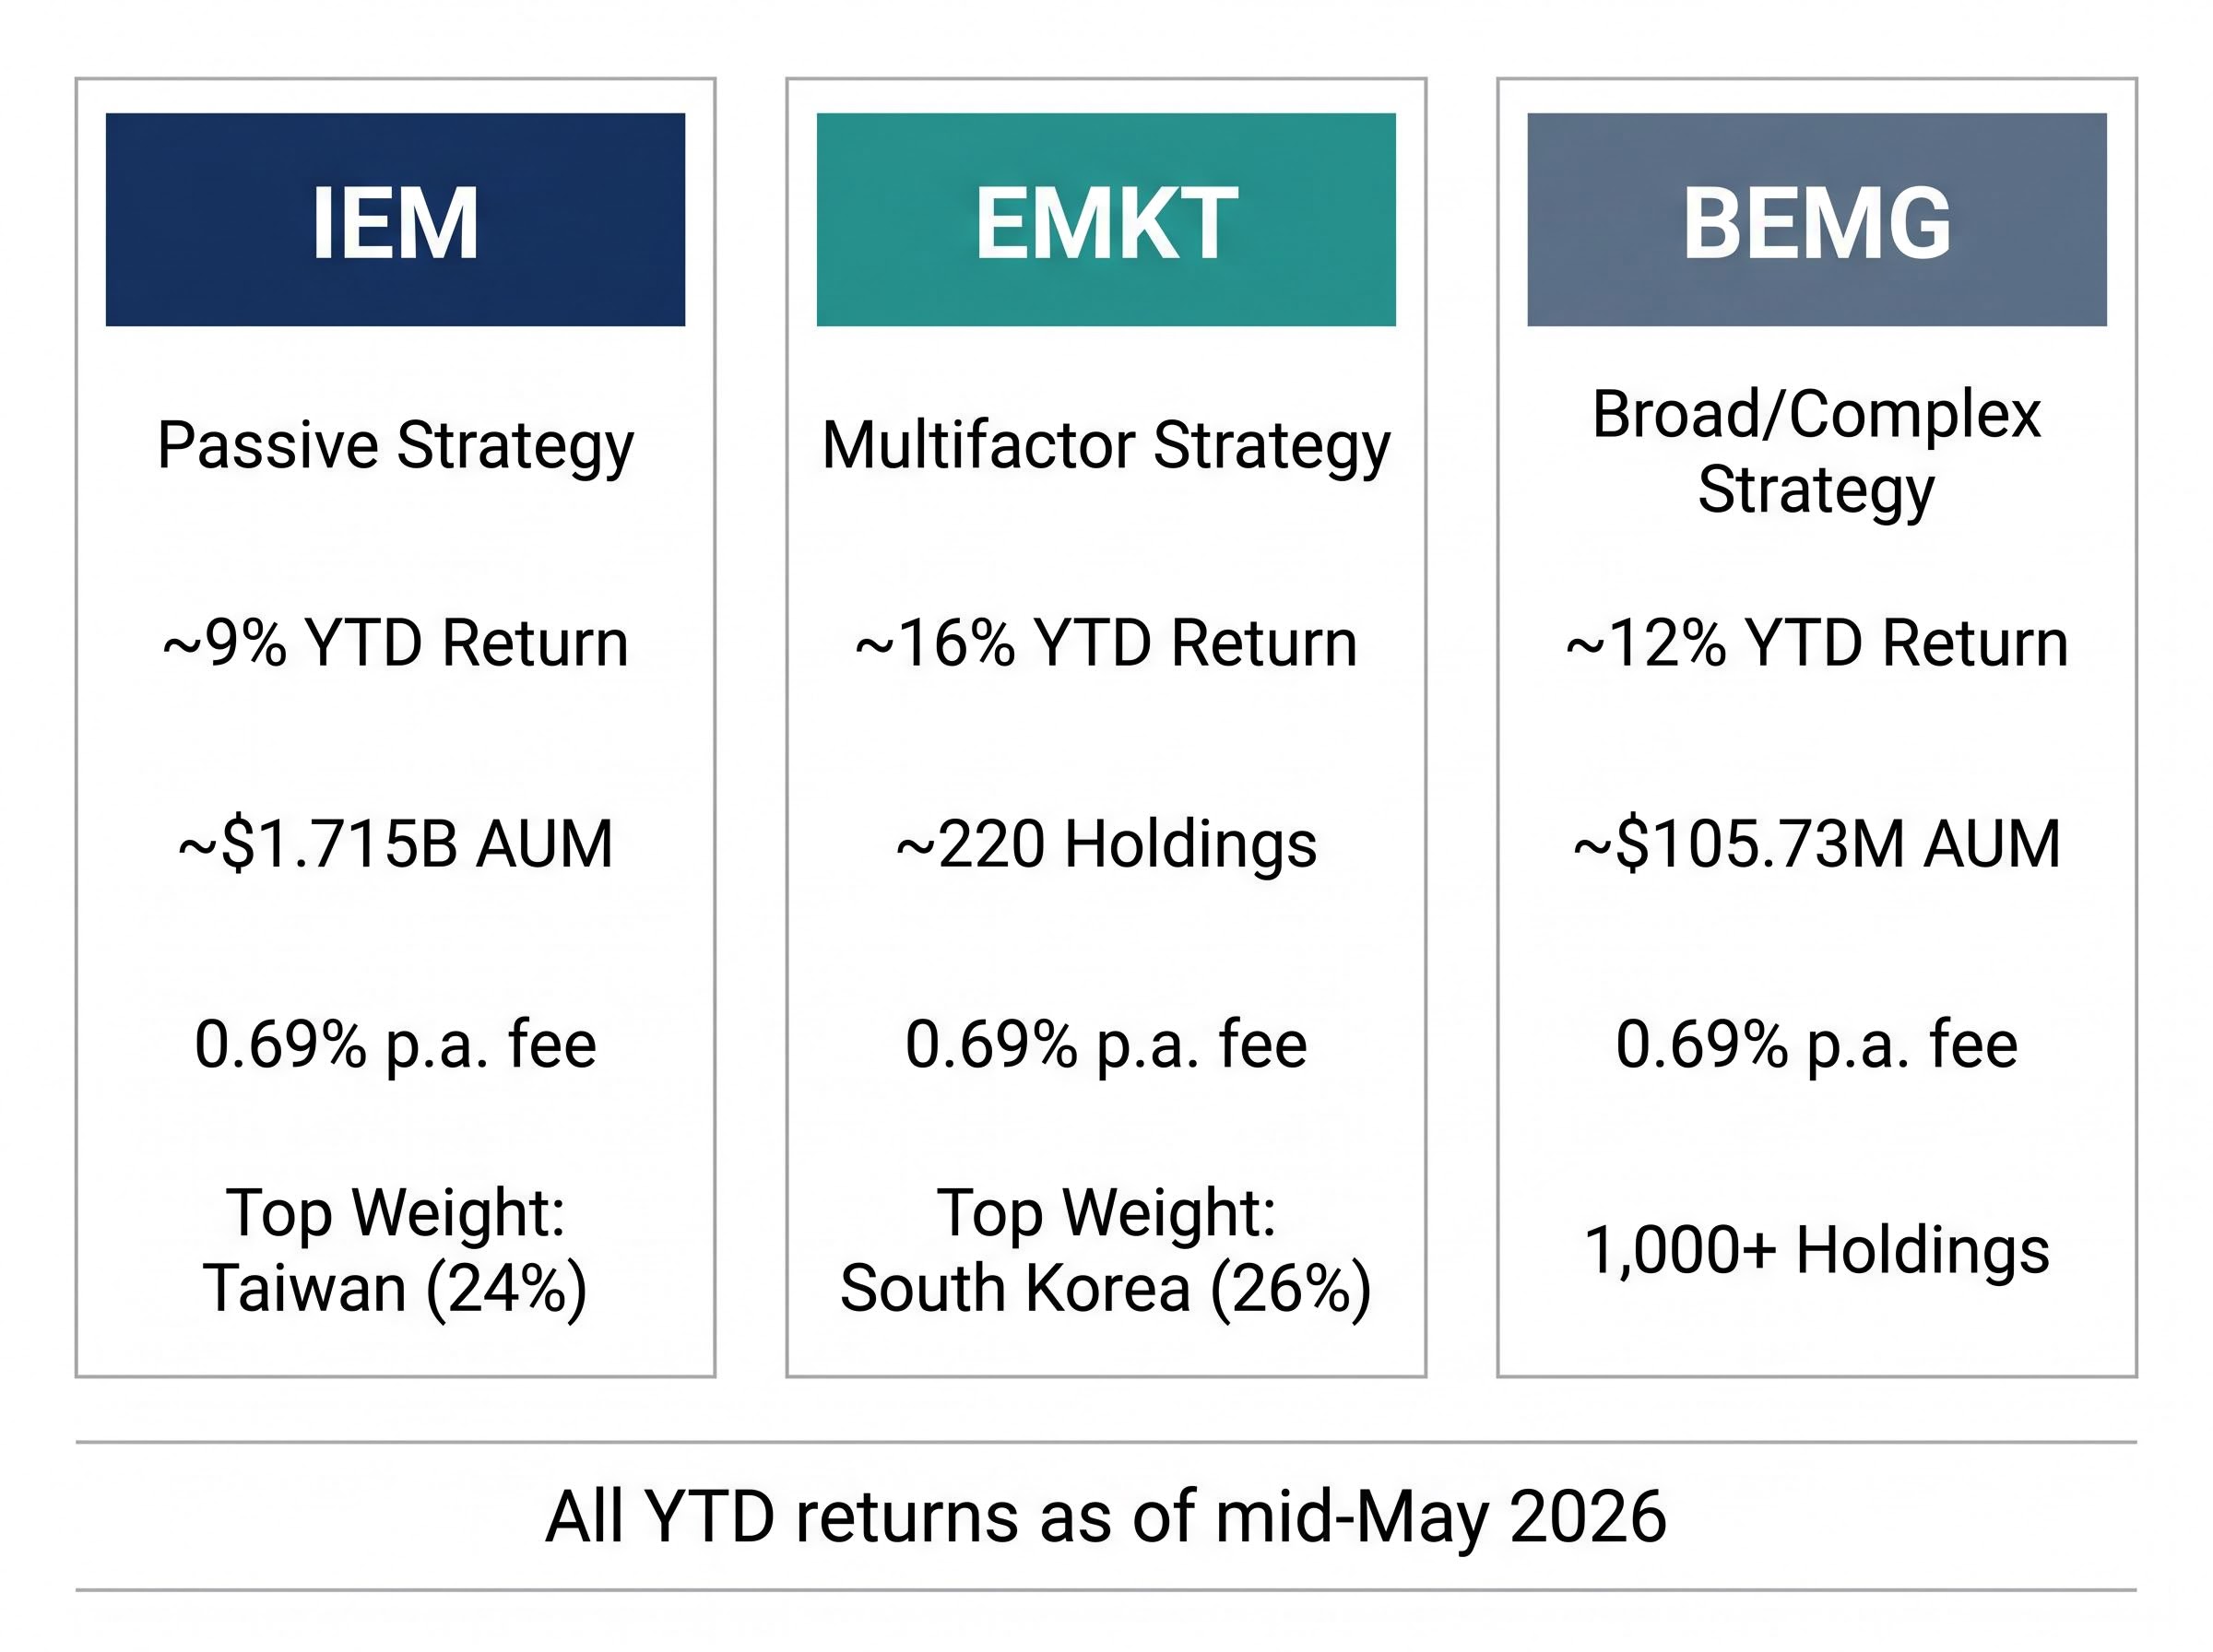
IEM has returned approximately 9% year-to-date as of mid-May 2026. Its broad market-cap approach spreads capital across Taiwan (24%), China (23%), and South Korea (18%), among others. That diversification delivered steady gains but diluted the impact of any single country’s rally. The fund captured the Taiwan semiconductor upcycle and Korea’s memory chip recovery, but its China allocation moderated returns as that market delivered stabilisation rather than outright strength.
EMKT has led the three funds with an approximate 16% year-to-date return and a 33% twelve-month gain. The outperformance traces directly to its multifactor construction. The fund’s quality and momentum screens overweighted Taiwan and Indian growth stocks while underweighting state-owned enterprises and weaker Chinese property names. Country weights of South Korea (26%), China (25%), and Taiwan (23%) across approximately 220 holdings concentrated the portfolio in the regions delivering the strongest earnings revisions. Technology stocks comprised roughly one-third of the portfolio.
VanEck has framed EMKT’s positioning as offering “structural growth at reasonable prices,” a characterisation supported by positive earnings revisions in Taiwan and Korea at a time when Australian earnings revisions have been flat to negative.
BEMG returned approximately 12% year-to-date, a strong result for a fund less than a year old with more than 1,000 holdings across more than 20 countries. Its broad construction captured the EM rally without a specific factor tilt, demonstrating that diversified emerging market exposure alone was sufficient to outperform the ASX in 2026.
| ETF | YTD Return (mid-May 2026) | Top Country Weight | Holdings Count | Key Sector Tilt |
|---|---|---|---|---|
| IEM | ~9% | Taiwan (24%) | Large-cap EM universe | Broad, market-cap-weighted |
| EMKT | ~16% | South Korea (26%) | ~220 | Technology (~one-third) |
| BEMG | ~12% | Broad EM | 1,000+ | Diversified complex EM |
The performance attribution matters because the drivers are identifiable and ongoing. The AI and semiconductor upcycle, anchored by TSMC in Taiwan, reflects multi-year capital expenditure commitments from global hyperscalers. Korea’s memory chip recovery is tied to DRAM and NAND price cycles now supported by AI-related server demand. India’s 6-7% GDP growth underpins a structural expansion in financials and consumer sectors. These are not one-quarter anomalies.
AI supply chain positioning is the single clearest explanation for why Taiwan and South Korea dominate the top country weights across all three funds: TSMC’s foundry role and Korean memory chip production place both markets at the centre of a $630 billion to $700 billion projected AI infrastructure investment cycle that is reshaping where global capital flows.
Morningstar has flagged EMKT’s higher tracking error as both a risk and an opportunity: the same factor tilts that drove 2026 outperformance could underperform in a different market regime.
The three funds share a fee, a broad asset class, and a positive 2026 return. Beyond that, they suit different investors. The choice comes down to two variables: how much tracking error is acceptable, and whether the goal is broad EM exposure or a concentrated factor tilt.
According to Livewire Markets, a strategic allocation of 5-15% of equity to emerging markets is a reasonable starting point for Australian investors who are overweight domestic equities. With all three funds charging 0.69% p.a., the fee is not a factor in the decision.
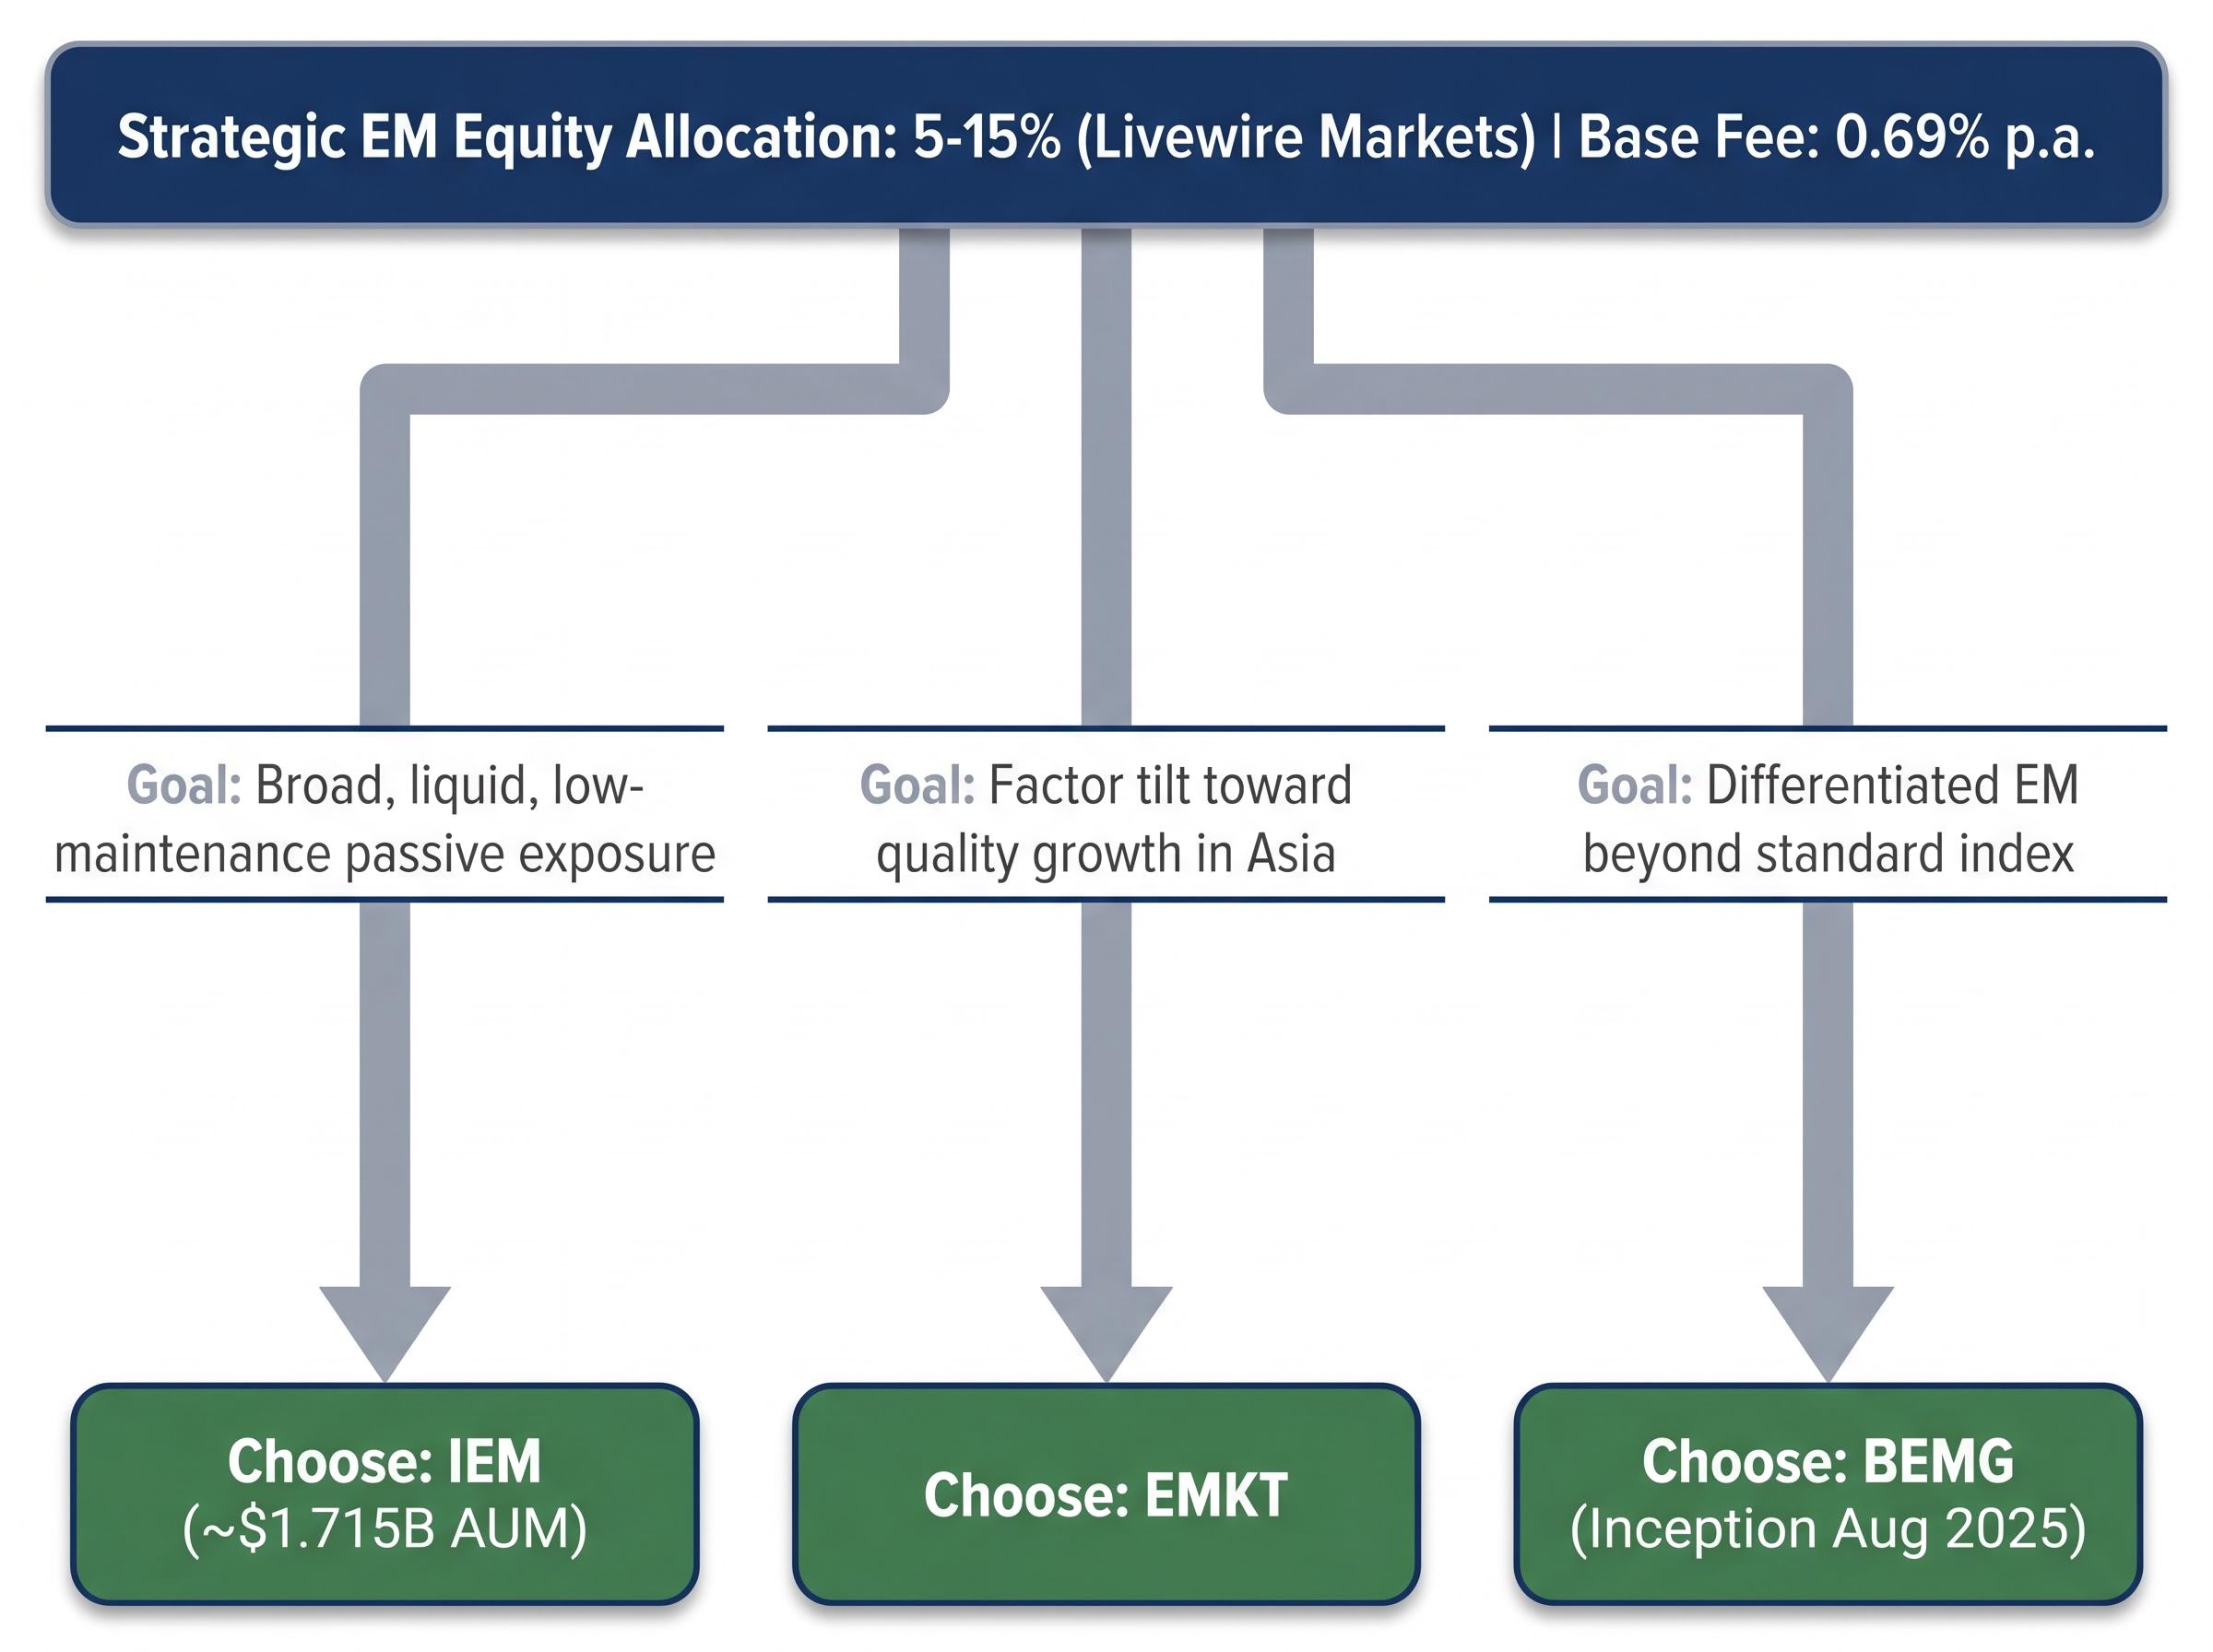
IEM is the default core allocation. Its approximately $1.715 billion in funds under management provides the deepest liquidity of the three on the ASX. The passive, market-cap-weighted approach delivers diversified EM exposure with minimal active risk. For investors making a first international allocation or seeking a “set and review” EM holding, IEM’s long track record and straightforward construction make it the simplest entry point.
EMKT suits investors who understand and accept factor-driven risk. The multifactor construction has delivered leading returns in 2026, but Morningstar’s caution on tracking error applies: this fund will deviate more from the broad EM index in both directions. EMKT’s overweights to Taiwan and India, and its underweights to weaker Chinese names, represent active positioning. Investors selecting EMKT should be comfortable with periods where those tilts work against them.
BEMG offers exposure to a broader or more complex set of emerging markets than the standard MSCI EM benchmark. Its newer track record (inception August 2025) and smaller fund size of approximately $105.73 million are considerations: liquidity is thinner, and historical analysis is limited. This fund may suit investors who already hold a core EM position and want a complementary allocation that captures segments of the developing world not fully represented in IEM or EMKT.
Investors exploring whether even higher-returning options exist alongside IEM, EMKT, and BEMG will find our full explainer on top-performing ASX ETFs in 2026, which profiles three funds returning between 21% and 60% year-to-date, examines the Taiwan semiconductor concentration risk common to all of them, and explains the beta and volatility trade-offs involved.
The 2026 returns are documented. Whether the conditions that produced them persist is a forward-looking question that depends on three macro variables:
Morningstar’s consistent recommendation across 2026 has been to treat emerging markets as a long-term strategic allocation rather than a tactical trade, noting that EM carries higher volatility and political risk than developed markets.
The Australian Financial Review has reported positive earnings revisions for Taiwan and Korea semiconductor sectors, while Australian revisions have tracked flat to negative. That earnings momentum gap is the near-term data point most likely to sustain or challenge the current performance divergence.
All three emerging market ETFs have meaningfully outpaced the flat ASX 200 in 2026, and the structural reasons, sector composition, valuation discounts, and macro tailwinds, are durable enough to warrant a strategic review of domestic-only portfolios. IEM offers breadth and liquidity for core EM exposure. EMKT delivers a factor-driven conviction position in Asian growth. BEMG provides differentiated newer exposure for investors seeking breadth beyond the standard index.
The practical next step is to assess current domestic concentration, consider whether a 5-15% EM allocation is appropriate for individual risk tolerance, and revisit the three macro variables, US rates, semiconductor demand, and China policy, before making an allocation decision.
Past performance does not guarantee future results, and emerging market equities carry higher volatility than the ASX. Financial projections are subject to market conditions and various risk factors.
This article is for informational purposes only and should not be considered financial advice. Investors should conduct their own research and consult with financial professionals before making investment decisions.
ASX emerging market ETFs are exchange-traded funds listed on the Australian Securities Exchange that provide exposure to equities in developing economies such as India, China, Taiwan, and South Korea. They track an underlying index of companies in those countries, allowing Australian investors to buy a single fund that holds hundreds of international stocks.
IEM passively tracks the MSCI Emerging Markets Index using a market-cap-weighted approach, EMKT applies a four-factor screen covering value, momentum, quality, and low size to select holdings from the same universe, and BEMG offers broader exposure across a wider set of developing economies with more than 1,000 holdings across more than 20 countries.
All three funds, IEM, EMKT, and BEMG, charge an identical management fee of 0.69% per annum, meaning the fee is not a differentiating factor and the decision between them comes down to index methodology, country weights, and risk tolerance.
According to Livewire Markets, a strategic allocation of 5-15% of equity exposure to emerging markets is a reasonable starting point for Australian investors who are currently overweight domestic equities.
The primary risks include currency fluctuations between the Australian dollar and emerging market currencies, political instability in countries like China, less predictable regulatory frameworks, and historically amplified drawdowns during global risk-off episodes compared to developed market equities.