Why AI Infrastructure, Not Chips, Is Where Durable Value Sits
30 mins ago

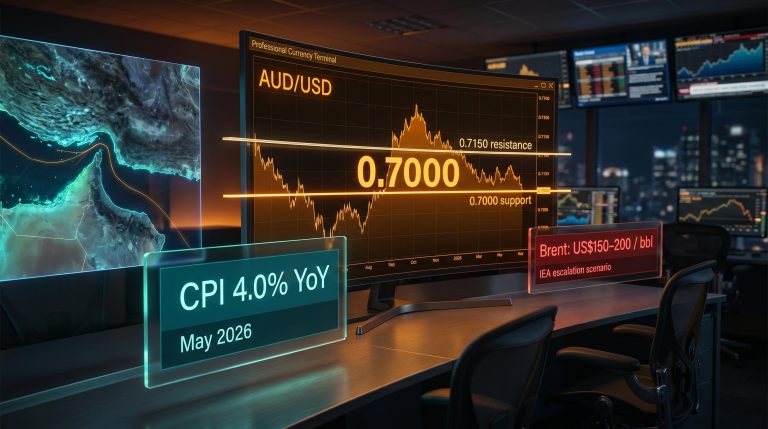
The SOXX ETF delivered a ~40.4% return in April 2026, its best month on record, pushing year-to-date performance to roughly 50% by early May 2026. That single data point tells a story about where international capital chose to land. While $86 billion in equity inflows swept through markets globally in April, the distribution was anything but even: US semiconductor equities and dollar-denominated assets captured a disproportionate share, Europe’s equity segments faced persistent structural headwinds, and emerging markets split along growth and geopolitical fault lines that defy a single narrative.
The result is a capital flow map for 2026 that looks less like a tide lifting all boats and more like a sorting mechanism, channelling money toward AI-adjacent infrastructure plays while draining it from regions where growth catalysts remain absent. What follows is a detailed breakdown of where that money is moving, the structural mechanics driving each regional outcome, and what this divergence means for portfolios built around international diversification.
The numbers are hard to overstate. SOXX, the benchmark US semiconductor ETF, posted a ~40.4% gain in April 2026 alone, its strongest single-month performance on record.
SOXX ETF: ~40.4% in April 2026 (best month on record), with year-to-date returns reaching approximately 50% as of early May 2026.
The driver was not broad US equity optimism. It was a specific, identifiable pull: AI-driven demand for NVIDIA, AMD, and the wider semiconductor complex acted as the magnetic centre drawing institutional and international buyers into a narrow slice of the US market. Of the $86 billion in total April inflows (predominantly institutional, according to Investing.com), a substantial share was directed at technology positions anchored by these names.
The granular institutional flow data from BofA’s weekly Flow Show report captures the same dynamic in sharper relief: US large caps absorbed $19.3 billion in a single week for a fifth consecutive inflow, while China recorded its largest equity exodus since January 2026, confirming the bifurcation this analysis describes is visible at the weekly transaction level, not just in quarterly aggregates.
The scale of the underlying commitment driving these inflows becomes clearer when examined at the source: the AI infrastructure investment cycle running through 2026 is projected to deploy between $630 billion and $700 billion in data centre and hardware spending, with approximately 75% directed at physical assets, a concentration of capital that directly translates into semiconductor revenue and equity demand.
The semiconductor surge created a secondary effect that extended beyond equity returns. International buying of US chip stocks generates demand for dollars, which reinforces dollar strength, which in turn makes dollar-denominated assets more attractive to currency-return-seeking investors. The loop is self-reinforcing:
The Federal Reserve’s decision to hold the federal funds rate at 3.5%-3.75% for a third consecutive meeting provided the rate-environment stability that anchors this loop. The Fed is not easing, but it is not tightening either, and that predictability has maintained the rate differential relative to the ECB’s 2.00% hold, keeping the dollar bid intact.
For investors assessing US equity exposure, the semiconductor trade is not merely a momentum story. It is a capital-flow-validated structural shift with currency dynamics that extend its duration. The question is whether the loop continues to compound or approaches the point where crowding invites a reversal.
The instinct might be to assume that money is flooding out of European funds. The reality is more nuanced, and the data demands honest treatment.
Morningstar reported that European open-end funds and ETFs recorded net inflows of €184.2 billion in Q1 2026, up from €154.3 billion in Q4 2025. At the aggregate level, money is still entering European vehicles.
The structural challenges, however, are real. They do not manifest as headline outflows from the region’s entire fund universe; they show up in sector-level and equity-specific pressure that the aggregate numbers obscure:
The ECB has maintained its deposit facility rate at 2.00% for six consecutive meetings as of 30 April 2026. This provides policy stability, but it also signals that the growth-constraining effects of the prior tightening cycle are still filtering through the economy. There is no stimulus catalyst on the horizon.
The ECB monetary policy statement of 30 April 2026 confirms the sixth consecutive hold at 2.00% and reiterates the Governing Council’s assessment that disinflation is proceeding as expected, language that underscores the absence of any near-term pivot that could catalyse a reassessment of European equity valuations.
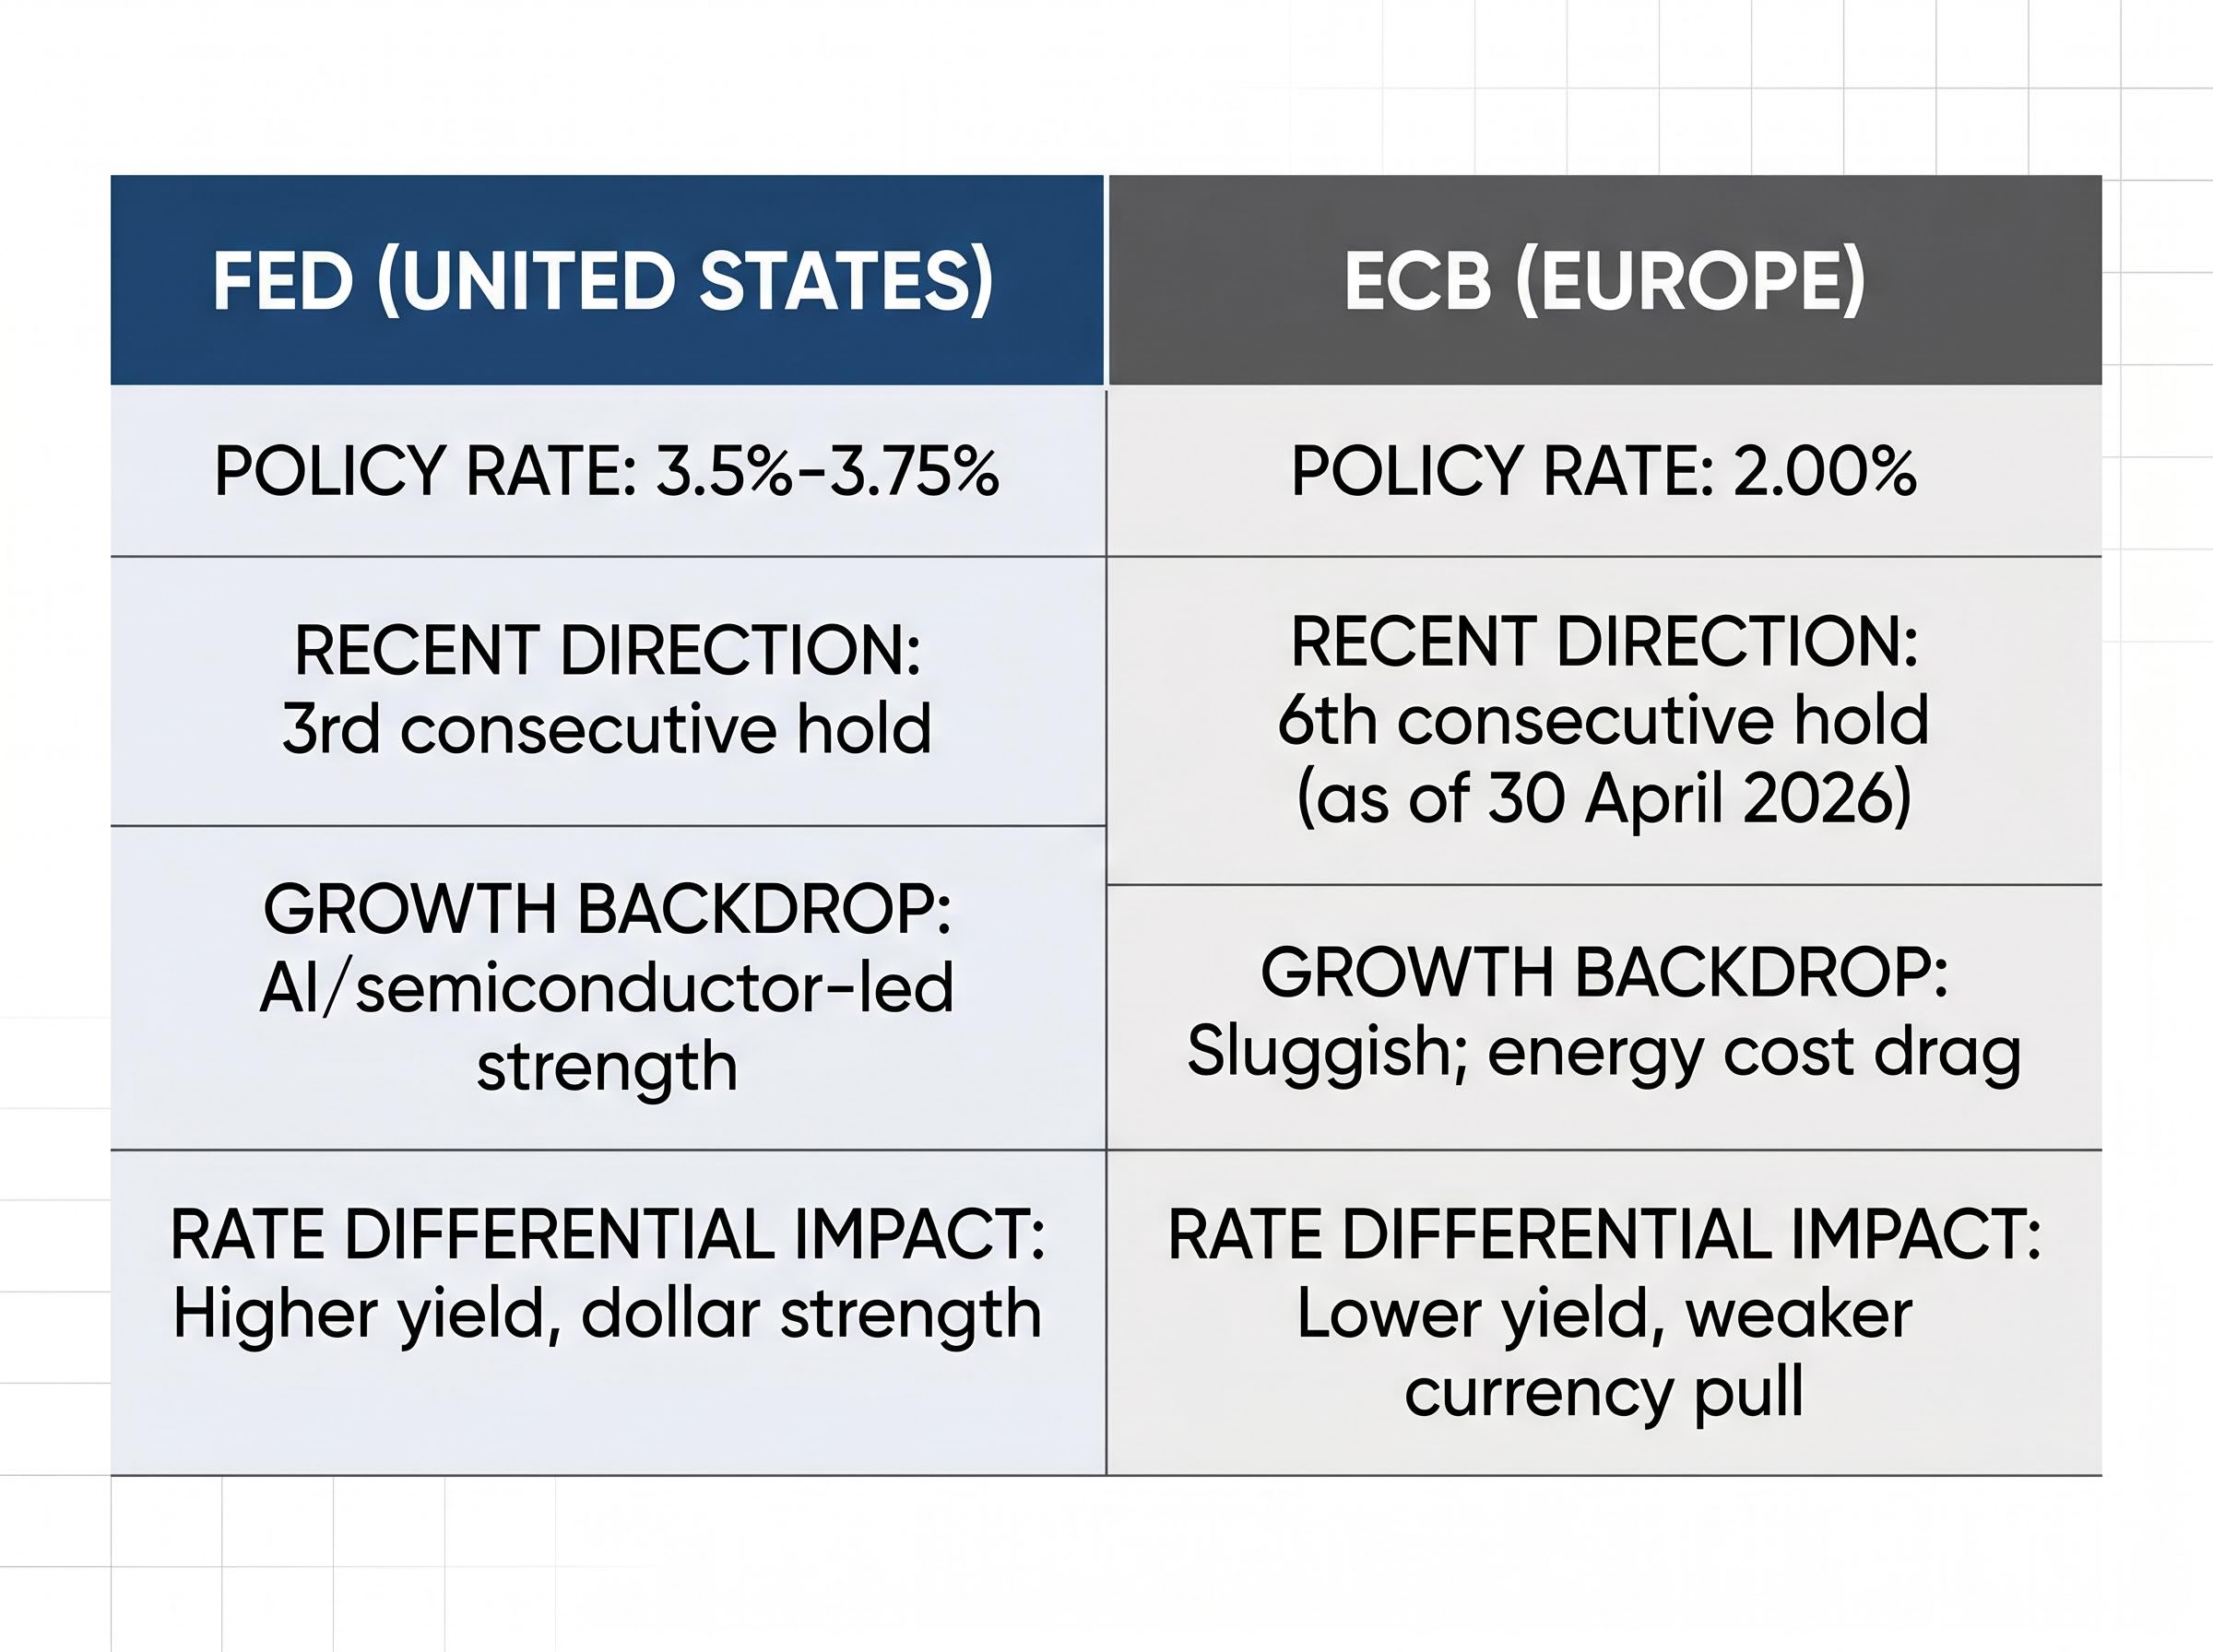
| Factor | ECB (Europe) | Fed (United States) |
|---|---|---|
| Policy Rate | 2.00% | 3.5%-3.75% |
| Recent Direction | 6th consecutive hold | 3rd consecutive hold |
| Growth Backdrop | Sluggish; energy cost drag | AI/semiconductor-led strength |
| Rate Differential Impact | Lower yield, weaker currency pull | Higher yield, dollar strength |
Investors with European allocations should distinguish between aggregate fund flow data and the equity-specific or sector-level pressure that may be depressing returns in particular segments. The headline numbers mask a more uncomfortable story beneath them, and granular per-sector breakdowns expected from EPFR Global and Morningstar later in Q2 will provide the clarity that current data lacks.
The eurozone services contraction captured in April 2026 PMI data, where the services index collapsed from 50.1 in March to 47.4, provides the leading indicator context that aggregate fund flow figures obscure: growth momentum in Europe’s largest economic segment is already running below neutral, well ahead of any Q2 fund flow reports.
Capital flows, in their simplest form, describe the movement of money across borders for investment purposes. This includes portfolio flows (purchases of equities, bonds, and funds), foreign direct investment into companies and infrastructure, and currency reserve adjustments by central banks.
The scale is enormous. Emerging market portfolio flows alone reached approximately $22 billion in February 2026, according to IIF data, and that represents a single month in a single segment of the global picture.
Five measurable variables determine where capital concentrates and where it retreats:
These five variables operate through two complementary forces. Pull factors draw capital toward regions with improving return prospects. Push factors accelerate capital away from regions facing growth headwinds or policy uncertainty.
Applied to the current environment: US semiconductor equities are pulling capital through a combination of AI-driven earnings growth, dollar strength, and rate-environment stability. European equity segments are pushing capital away through sluggish growth, elevated energy costs, and the absence of a near-term stimulus catalyst. Neither force operates in isolation; the pull of one region intensifies the push from another when capital is finite and must be allocated somewhere.
This framework provides a lens for interpreting the regional patterns discussed throughout this analysis, not as disconnected developments but as interrelated outcomes of the same measurable forces.
The aggregate numbers tell one story. IIF data shows EM portfolio flows slowing to approximately $22 billion in February 2026. That figure, treated as a single data point, suggests a cooling of interest. Treated as an average across dozens of countries, it obscures a fracture running through the EM universe.
The IIF Capital Flows Tracker provides the granular monthly data behind the $22 billion February 2026 figure, covering both debt and equity portfolio flows across individual emerging market economies, a level of disaggregation that the aggregate headline number alone cannot supply.
China met its 5% GDP growth target in 2025, but the 2026 trajectory is contingent on a household consumption recovery that has not yet materialised. Exports have been reoriented toward Asian trading partners amid ongoing US-China tensions, and domestic investment in real estate, infrastructure, and manufacturing remains subdued. Trade talks between the US and China in Paris in March 2026 produced a fragile truce, but decoupling risks persist. For foreign investors, the China allocation decision is as much a geopolitical judgment as an economic one.
South Korea presents a different picture. Its 2026 GDP growth forecast has been upgraded to 2.2%, and its semiconductor manufacturers sit within the AI-adjacent supply chains that are attracting institutional capital globally. Taiwan occupies a similar position, benefiting from its fabrication capacity even as it navigates the same US tariff environment affecting China.
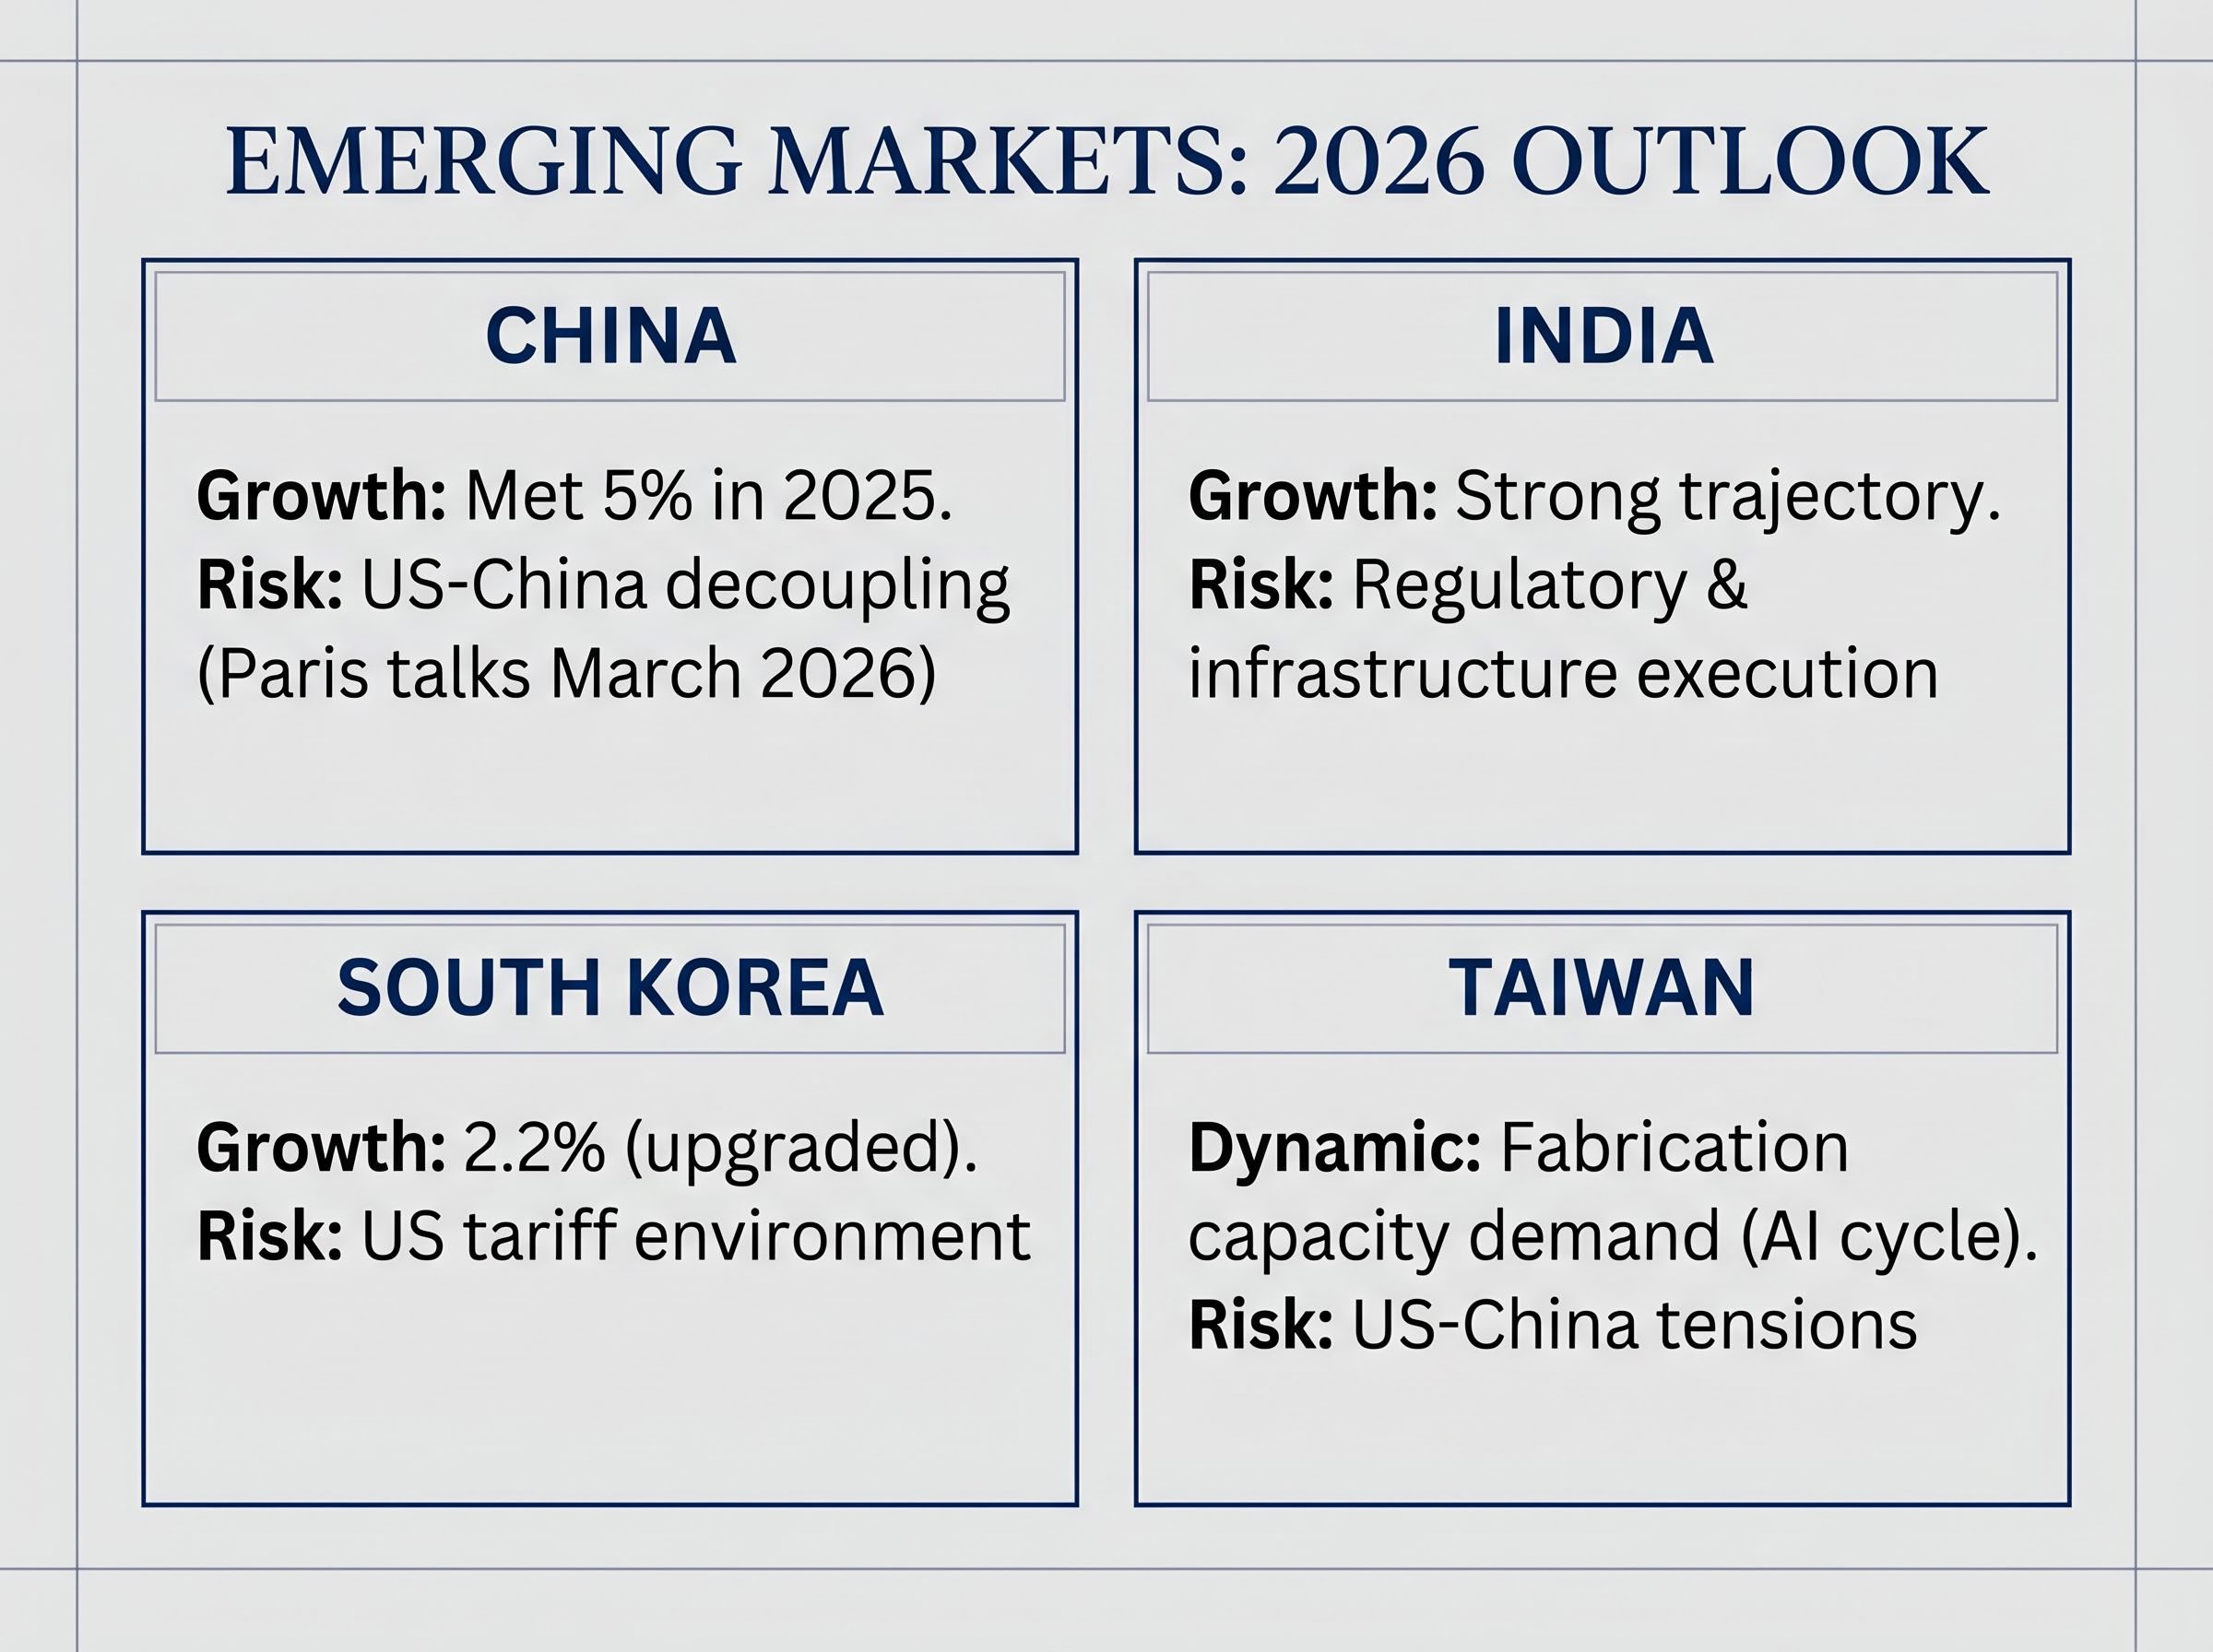
| Country/Region | 2026 Growth Outlook | Key Capital Flow Dynamic | Primary Risk Factor |
|---|---|---|---|
| China | Contingent on consumption recovery (met 5% in 2025) | Export reorientation; subdued domestic investment | US-China decoupling; tariff escalation |
| India | Strong growth trajectory | Growing capital interest; evolving regulatory framework | Regulatory and infrastructure execution |
| South Korea | 2.2% (upgraded) | AI-adjacent supply chain positioning | US tariff environment |
| Taiwan | Moderate (semiconductor-supported) | Fabrication capacity demand from global AI cycle | Geopolitical sensitivity; US-China tensions |
For globally diversified investors, treating emerging markets as a monolithic asset class in 2026 risks both missing the South Korea and Taiwan semiconductor-adjacent opportunity and underweighting the uncertainty around China’s consumption-dependent recovery.
The regional divergence described above is not arbitrary. It rests on an interlocking set of macro conditions that form a scaffold, and understanding that scaffold reveals something about how long the current pattern can persist.
$86 billion in total April 2026 market inflows, predominantly institutional, according to Investing.com. The scale of commitment signals conviction, not speculation.
Four conditions are holding the scaffold in place, and one risk threatens to destabilise it:
Bond markets, meanwhile, remain cautious. Inflationary pressures and sovereign debt concerns have pushed investors toward Treasury Inflation-Protected Securities (TIPS), which offer returns linked to inflation, over conventional bonds.
Three conditions would shift the current pattern. A material earnings miss from a major semiconductor name, particularly NVIDIA or AMD, would challenge the capital flow thesis at its source. A reversal in dollar strength, whether driven by a Fed policy shift or a loss of confidence in US fiscal trajectory, would break the currency feedback loop that amplifies returns for international holders. A European growth catalyst, such as a meaningful energy cost reversal or fiscal stimulus programme, would change the relative return calculus that currently favours the US.
None of these shifts appears imminent. But the point is not prediction; it is monitoring. Each variable is measurable, and each has identifiable trigger points.
The three-region picture, US semiconductor dominance, European structural drag, and EM bifurcation, points toward a coherent conclusion.
The 2026 capital flow pattern reflects a genuine structural realignment around AI infrastructure investment rather than a temporary sentiment swing.
This does not mean the pattern is permanent. Three variables will determine whether the divergence deepens, stabilises, or reverses:
Data limitations warrant acknowledgment. Per-country EM flow figures, sector-level European breakdowns, and precise international inflow data for individual semiconductor companies remain unconfirmed for Q1-Q2 2026. The directional picture is supported by the evidence available, but granular revisions are possible as EPFR Global and Morningstar release their Q2 reports.
This article is for informational purposes only and should not be considered financial advice. Investors should conduct their own research and consult with financial professionals before making investment decisions. Forward-looking statements regarding capital flow trends and market conditions are subject to change based on economic developments and policy decisions.
Capital flows in 2026 are sorting into identifiable winners, US semiconductors and AI-adjacent Asian markets, and laggards, Europe’s structurally constrained equity segments and China’s consumption-dependent recovery. The forces driving this sorting are durable: rate differentials, AI infrastructure demand, and currency dynamics are structural, not noise.
The analytical boundaries matter, though. Per-country and per-sector flow data for Q1-Q2 2026 remains unconfirmed in several regions, meaning the directional thesis is strong but precise positioning claims require Q2 data validation from EPFR Global and Morningstar before they can be treated as settled.
The flow map is a tool for assessing where structural tailwinds and headwinds currently sit, not a trading signal. Its value lies in informing portfolio construction decisions about regional weighting over a multi-quarter horizon, with the understanding that the ink on this map has not yet dried.
Global capital flows describe the movement of money across borders for investment purposes, including purchases of equities, bonds, and funds. They matter because they reveal which regions and sectors are attracting institutional conviction, helping investors assess where structural tailwinds and headwinds are building over a multi-quarter horizon.
AI-driven demand for companies like NVIDIA and AMD has made US semiconductor equities the primary destination for institutional capital, with the SOXX ETF gaining approximately 40.4% in April 2026 alone. This is reinforced by a dollar feedback loop where international buying of chip stocks strengthens the US dollar, which in turn amplifies returns for foreign holders and draws further inflows.
No, European open-end funds and ETFs still recorded net inflows of 184.2 billion euros in Q1 2026 according to Morningstar, but structural challenges including sluggish growth, elevated energy costs, and the absence of a near-term stimulus catalyst are creating sector-level and equity-specific pressure that aggregate figures obscure.
Investors should avoid treating emerging markets as a single asset class, since South Korea and Taiwan are attracting capital due to AI-adjacent semiconductor supply chain positioning while China faces uncertainty tied to a household consumption recovery that has not yet materialised. A country-by-country assessment that accounts for both growth outlook and geopolitical risk is essential.
Three key shifts could alter the current pattern: a material earnings miss from a major semiconductor company like NVIDIA or AMD, a reversal in US dollar strength driven by a Federal Reserve policy change or fiscal confidence shock, or a meaningful European growth catalyst such as an energy cost reversal or fiscal stimulus programme.