
The world’s largest economies committed hundreds of billions of dollars in 2024 alone to subsidising semiconductors, batteries, and green manufacturing within their own borders, while simultaneously raising barriers to imports from rivals. For any investor whose portfolio was built for a globalised world of integrated supply chains and converging trade policy, that structural shift demands attention. In February 2025, IMF First Deputy Managing Director Gita Gopinath warned that geoeconomic fragmentation is “no longer a tail risk but a central scenario.” The policy response across the U.S., EU, China, India, and Japan has not been to negotiate a shared framework but to build separately viable industrial ecosystems. This article maps how those ecosystems are forming, what the performance and concentration data reveal about current investor positioning, and what a fragmentation-aware approach to geopolitical investing actually looks like in practice.
The world just chose industrial policy over free trade
Within the same two-year window, five major economies launched industrial policy programmes targeting an almost identical set of strategic sectors. The scale is difficult to overstate.
| Economy | Key Policy | Committed Capital (Approx.) | Primary Sectors Targeted |
|---|---|---|---|
| United States | CHIPS Act; IRA | $8.5bn-$11bn (Intel alone); $1.2-$1.7tn IRA over a decade | Semiconductors, EVs, clean energy |
| European Union | TCTF; NZIA; CRMA | $92bn in approved national-level green-tech aid | Green tech, batteries, critical minerals |
| China | “New Productive Forces” push | 1 trillion yuan (≈$140bn) in special bonds (2024) | Advanced manufacturing, EVs, solar |
| India | PLI programme; semiconductor support | $24bn PLI across 14 sectors; $9bn chip fabs | Electronics, semiconductors, batteries |
| Japan | Semiconductor subsidies | $4.9bn additional for TSMC Kumamoto plant | Semiconductors, supply-chain security |
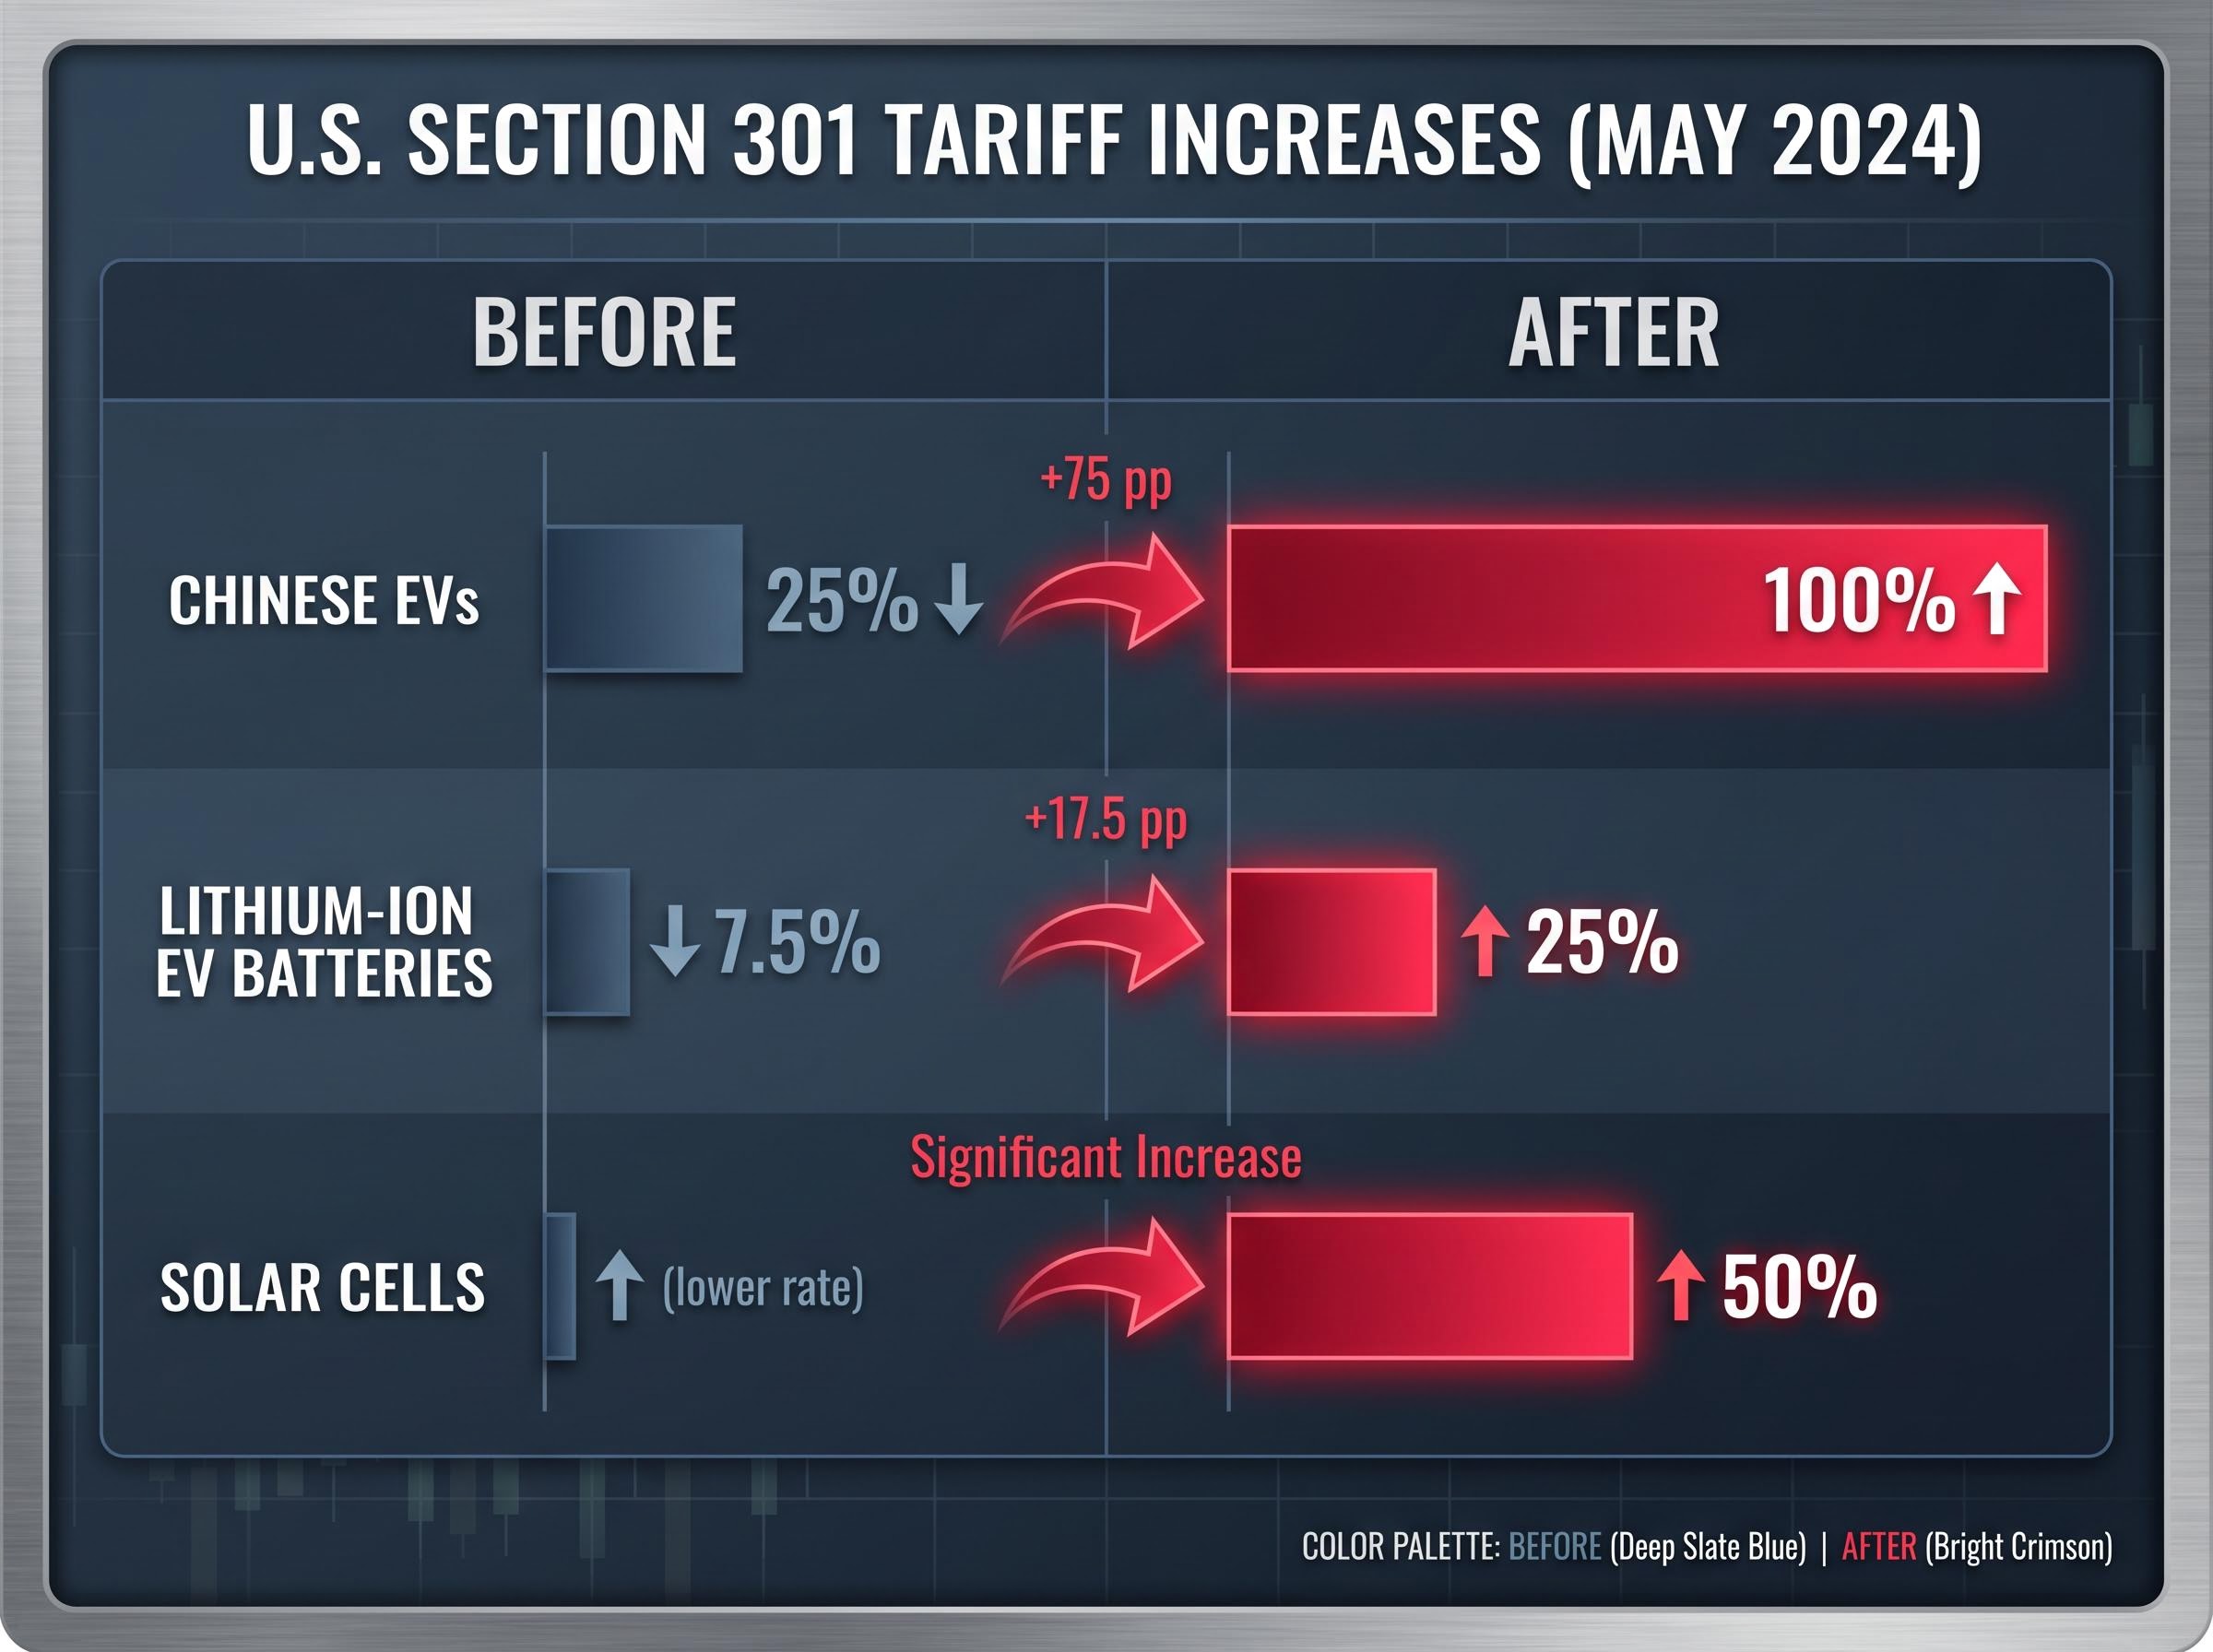
On top of the subsidies, the U.S. imposed steep tariff increases in May 2024 under Section 301:
- Chinese EVs raised to 100% (from 25%)
- Lithium-ion EV batteries raised to 25% (from 7.5%)
- Solar cells raised to 50%
The EU followed with provisional additional duties of 17-38% on Chinese EVs. These are not bilateral disputes. They are independent expressions of the same structural logic: nations spending to reduce economic vulnerabilities. Bridgewater’s Karen Karniol-Tambour has described this domestic-champion industrial policy as inherently inflationary, reinforcing regional economic separation. The sectors at the centre of this competition, semiconductors, EVs, batteries, and green technology, are precisely the sectors dominating forward-looking equity thematics, making this directly relevant to how portfolios are constructed.
The policy competition now unfolding across the US, EU, China, and India represents a return to modern mercantilism, a structural regime in which states compete for control over semiconductors, AI compute, and critical minerals rather than for trade surplus in manufactured goods, and the investment implications run well beyond the sectors receiving direct subsidy.
When big ASX news breaks, our subscribers know first
How fragmentation creates separately investable regional blocs
Subsidies and local-content rules do something specific to the investment landscape: they ring-fence companies and sectors within a bloc. A semiconductor manufacturer receiving billions in U.S. CHIPS Act funding builds capacity tied to North American supply chains and allied export networks. A battery plant established under India’s PLI programme serves domestic demand and friend-shoring partners. Revenue, supply chains, and risk exposures increasingly belong to a particular economic ecosystem rather than a global one.
The CHIPS Act funding programme administered through NIST sets out the domestic-content requirements, national-security guardrails, and investment conditions attached to awards, meaning recipients cannot freely redirect subsidised capacity toward non-allied export markets.
What “bloc-level exposure” actually means for a portfolio
A U.S.-listed company deriving 60% of revenues from China faces a geopolitical risk profile that its index weight alone does not capture. Supply-chain dependencies and payment-system affiliations are becoming as important as domicile of listing. MSCI research published in 2025 found that portfolios optimised only for sector and factor diversification can still exhibit high concentration in specific geopolitical blocs, a blind spot that traditional allocation frameworks were not designed to detect.
BlackRock CEO Larry Fink argued in his March 2025 annual letter that regional thematics, North American re-industrialisation, India and ASEAN as China-plus-one alternatives, may now matter more than the traditional emerging-market versus developed-market distinction. Mohamed El-Erian, writing in the Financial Times in January 2025, described the formation of “multi-aligned blocs” where historical correlations may underestimate the risk of simultaneous drawdowns across multiple markets.
“Geoeconomic fragmentation is no longer a tail risk but a central scenario.” — Gita Gopinath, IMF First Deputy Managing Director, February 2025
Understanding that blocs now carry structurally distinct economic drivers is the conceptual pivot separating a fragmentation-aware portfolio from one that holds a global index and assumes correlations will remain stable.
What investors actually hold today, and why it is a problem
The gap between the world the data describes and the portfolio most investors actually hold is wide, and it is not a quirk limited to unsophisticated retail accounts.
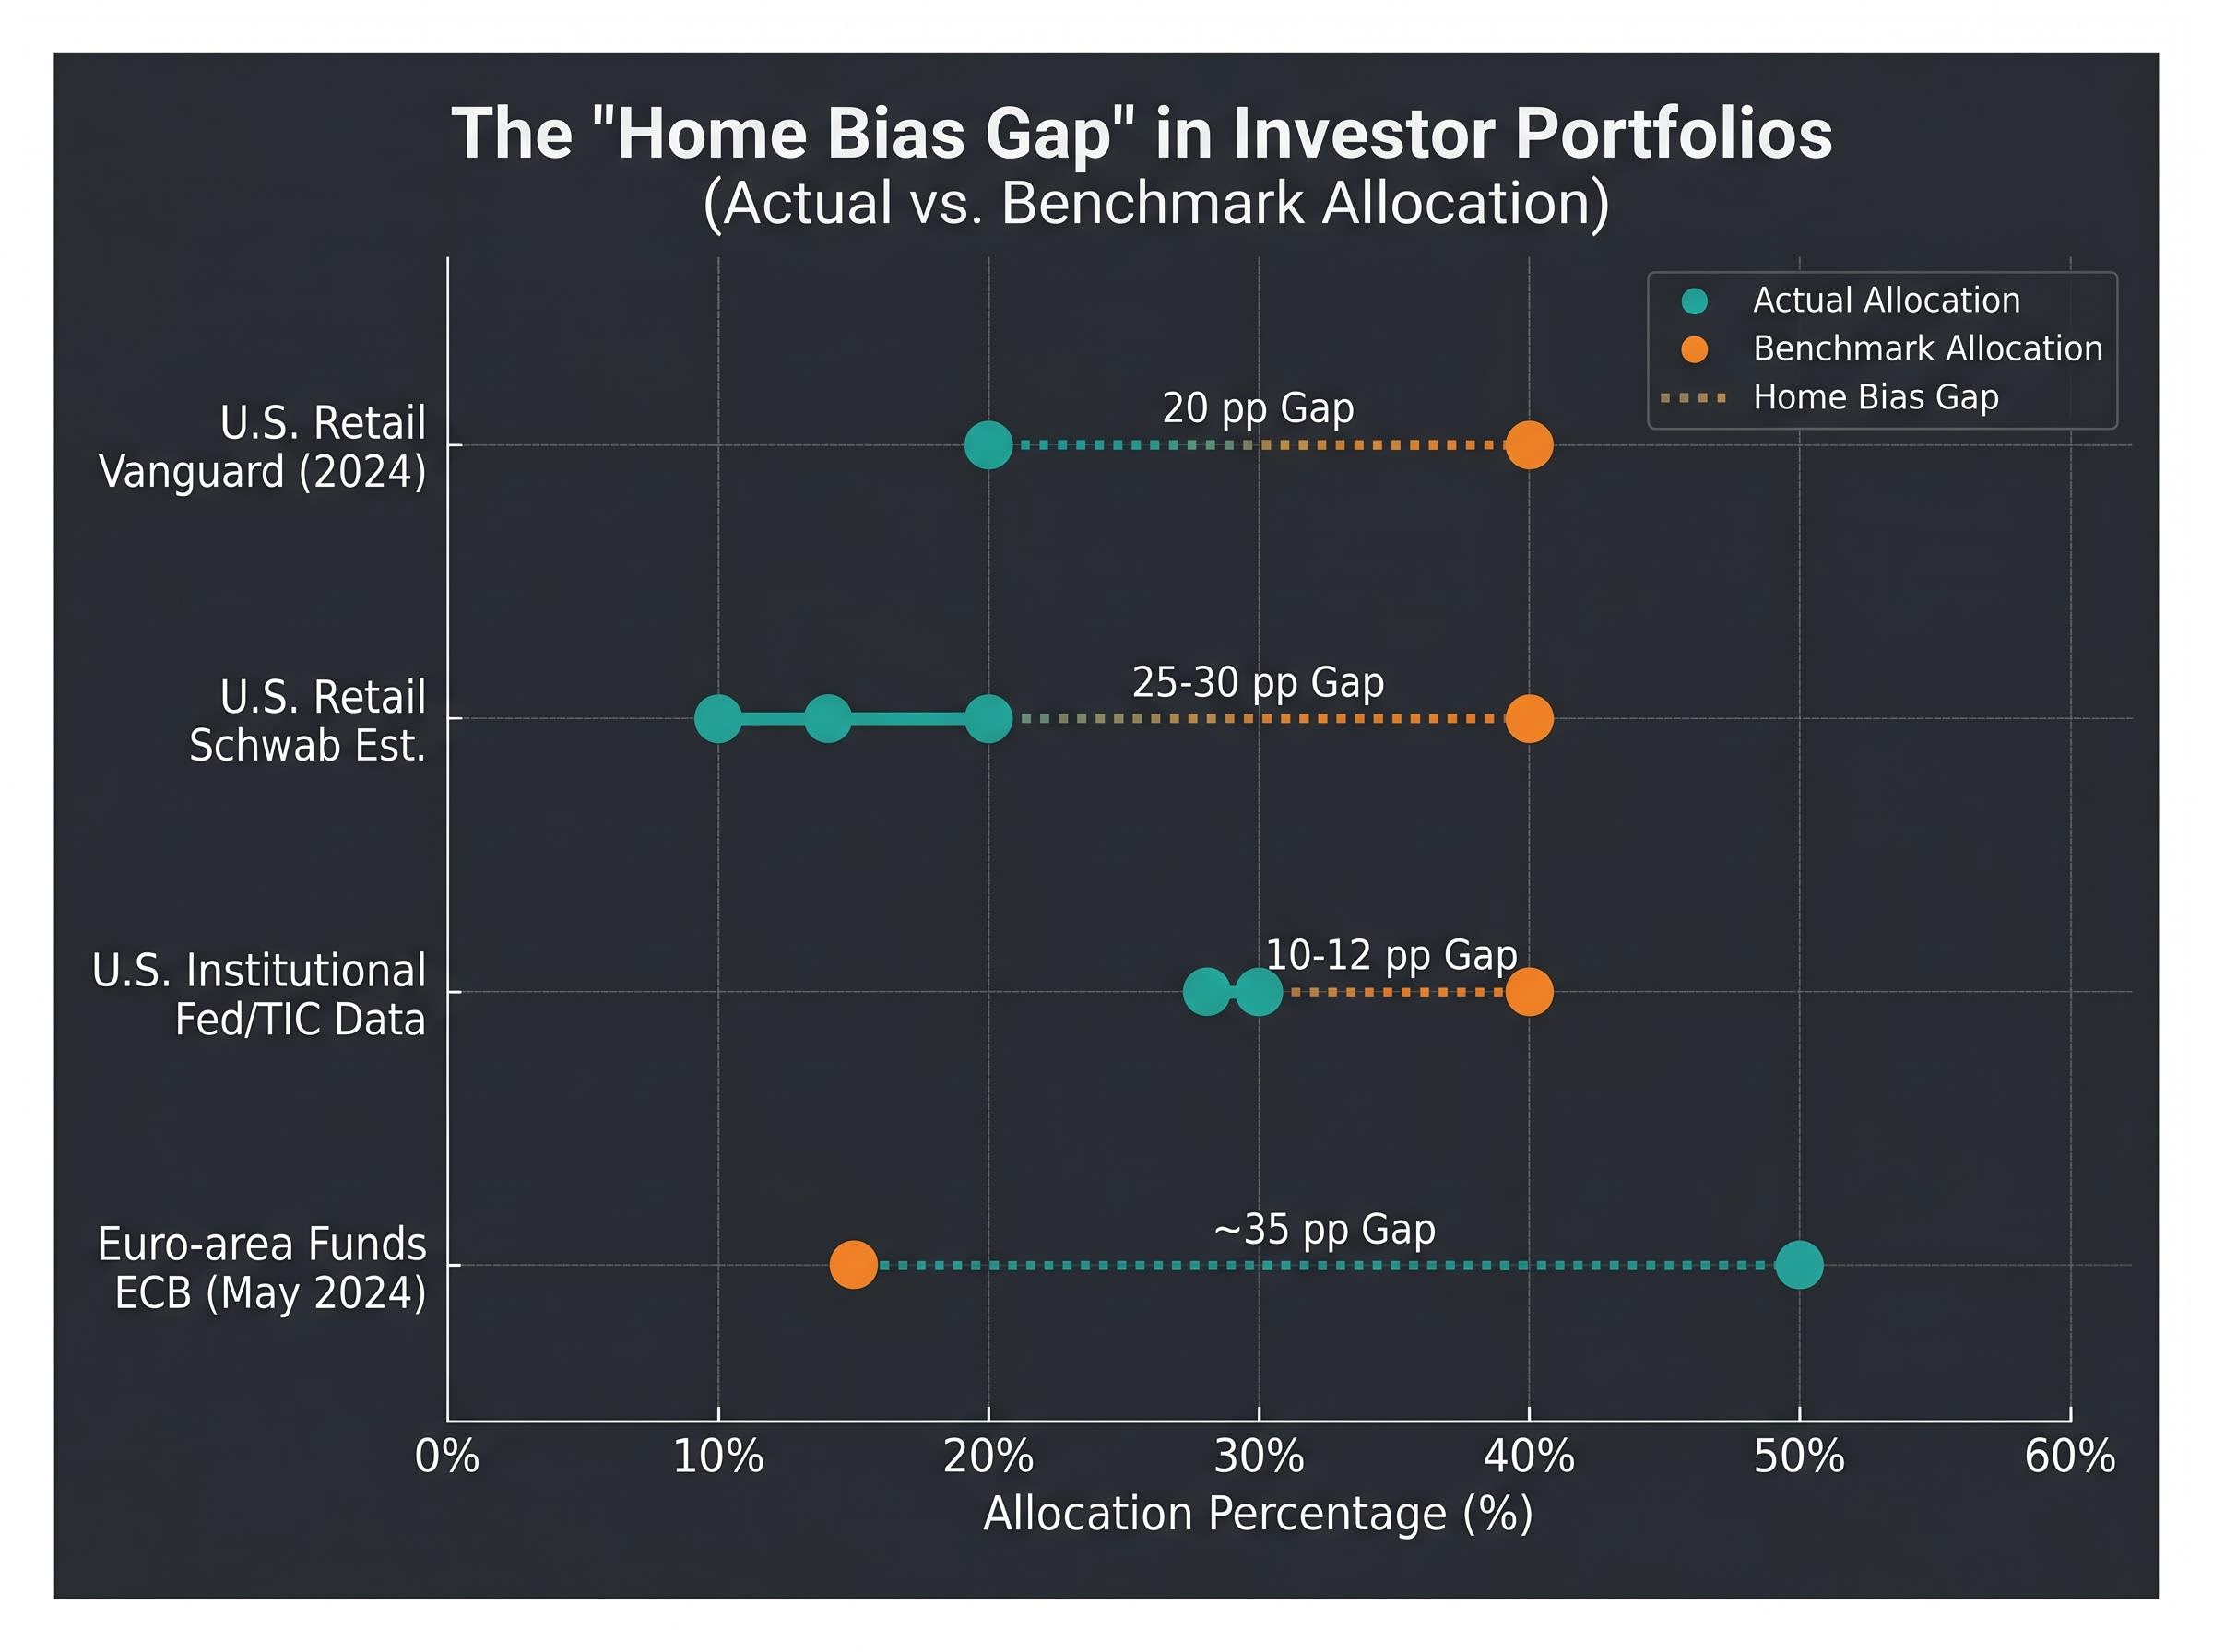
| Investor Segment | Typical International Allocation | Global-Cap Weight Benchmark | Implied Home Bias Gap |
|---|---|---|---|
| U.S. retail (Vanguard 2024) | ~20% | ~40% | 20 percentage points |
| U.S. retail (Schwab estimate) | 10-15% | ~40% | 25-30 percentage points |
| U.S. institutional (Fed/TIC data) | ~28-30% | ~40% | 10-12 percentage points |
| Euro-area funds (ECB May 2024) | ~50% domestic | ~15% euro-area global cap | ~35 percentage points |
OECD data from 2024 shows domestic equities still account for roughly 60-70% of total equity holdings for large pension funds in advanced economies. The Vanguard “How America Invests 2024” report, based on millions of accounts, places the median U.S. retail portfolio at approximately 20% international exposure. Charles Schwab research puts many retail investors at just 10-15%.
Bridgewater’s Karen Karniol-Tambour, speaking at the Milken Institute, identified widespread concentration in U.S. equities as a key portfolio vulnerability, alongside structural underweighting of real assets.
These portfolios were built for converging globalisation. In a world of diverging industrial policy, that default positioning carries concentration risk that did not exist at this magnitude before.
Regional return divergence is already showing up in the data
The structural argument for cross-regional exposure is one thing. The trailing 12-month equity returns, as of early May 2026, make the cost of geographic concentration measurable.
| Region / Index | Approx. 12-Month Return | Primary Driver(s) |
|---|---|---|
| MSCI Emerging Markets | +31-42% | Broad EM participation; India, Taiwan, Brazil, Middle East |
| CSI 300 (China) | +24-28% | Recovery from prior weakness; policy stimulus |
| S&P 500 (U.S.) | +23% | Mega-cap tech and AI |
| Nifty 50 (India) | +22-24% | Domestic earnings growth; foreign inflows |
| MSCI EAFE (Developed ex-U.S.) | +17% | Broad recovery; trailing U.S. but more robust than expected |
The Euro Stoxx 50 returned approximately +7-9%, lagging other regions. But the broader picture resists a simple narrative. China posted a meaningful recovery. Emerging markets substantially outperformed. India kept pace with the U.S.
No single bloc dominated unconditionally. That is precisely the point: if returns can diverge this significantly across regions within a single year, the cost of systematic underexposure to any one bloc is real and measurable, not theoretical.
The structural trade realignment underway is already producing measurable divergences beyond equity returns: three major trade agreements ratified since late 2025 each explicitly exclude the United States, the US Dollar Index has fallen 5.1% year-to-date through May 2026, and international ETFs absorbed $26.3 billion in net inflows between January and April 2026 as capital repositioned toward the emerging blocs.
Understanding fragmentation risk: the economic cost of a divided world
Fragmentation does not create cost-free diversification. The same forces building distinct regional investment ecosystems also generate quantifiable economic losses and new categories of risk.
Market reactions to geopolitical shocks have historically been more muted than headline risk suggests, with the S&P 500 closing near record levels even as a drone strike disrupted 1.7 million barrels per day of Kazakh crude in April 2026; the nuance is that fragmentation changes the baseline, not by making individual events more damaging, but by compressing the structural buffers that historically allowed markets to absorb localised disruptions.
The macro cost estimates converge on a clear signal:
- IMF: Severe fragmentation could reduce global GDP by up to 7-8% long term; mild scenarios project 0.2-1% losses
- World Bank: Long-term global output 1.5-2.5% below baseline under escalating trade restrictions
- OECD: Global real income losses of 1.5-4.5% if trade splits into two blocs
- WTO: Global welfare could fall by 5% in the long run
- Goldman Sachs: 0.4 percentage points per year shaved off global trade growth; global GDP approximately 1.5% below baseline by 2035
These are not marginal adjustments. Under the IMF’s severe scenario, the output loss approaches the combined size of the German and Japanese economies.
Jurisdictional risk as a new portfolio variable
Beyond the macro drag, fragmentation introduces a risk dimension that pre-fragmentation frameworks did not prominently feature: jurisdictional risk. Sanctions exposure, capital controls, and legal jurisdiction now require explicit monitoring rather than background assumptions.
Revenue geography and supply-chain affiliations can expose investors to jurisdictional risk even through holdings in nominally domestic companies. Mohamed El-Erian, writing in the Financial Times in January 2025, recommended greater liquidity buffers, more differentiated emerging-market exposure, and direct attention to jurisdictional risk as part of portfolio construction.
Fragmentation is not a free lunch of regional diversification: the same forces creating new investable blocs are creating new categories of systemic risk that require explicit measurement.
The fragmentation era does not reward passivity
The analytical arc of this argument moves through four stages: the formation of distinct regional blocs backed by hundreds of billions in industrial policy; the demonstrated cost of home bias; performance divergence already visible in the data; and the dual nature of fragmentation as both opportunity and risk. Together, they constitute a case for treating cross-regional exposure as a strategic consideration rather than an optional allocation layer.
The expert consensus from the IMF, BlackRock, MSCI, and Bridgewater points toward a reframing of diversification. The primary portfolio dimensions in a fragmented world are not country and sector labels. They are:
- Revenue geography: Where companies actually earn, not where they list
- Supply-chain affiliations: Which bloc’s industrial ecosystem a company depends on
- Policy-regime exposure: Which subsidies, tariffs, and regulatory frameworks shape a company’s competitive position
- Jurisdictional risk: Which sanctions, capital controls, and legal systems apply to a holding’s operations
Larry Fink noted in March 2025 that new sources of diversification would come from policy regimes rather than geography alone. A fragmentation-aware approach requires more active monitoring and more nuanced exposure decisions than a passive global-cap-weighted index provides. The question is not whether fragmentation is real. The question is how systematically a portfolio’s existing exposures reflect the world as it is actually organised.
For investors wanting to translate these structural observations into concrete portfolio decisions, our dedicated guide to geopolitical investing strategy covers gold allocation targets, rebalancing cadence under volatility, defence sector exposure, and a five-component resilience checklist that functions before, during, and after geopolitical shocks.
This article is for informational purposes only and should not be considered financial advice. Investors should conduct their own research and consult with financial professionals before making investment decisions.
Past performance does not guarantee future results. Financial projections are subject to market conditions and various risk factors.
Readers seeking further analysis of industrial-policy themes, regional equity outlooks, or portfolio construction frameworks can explore related coverage on the StockWire X platform.