
What NDQ Gives Australian Investors That the ASX Cannot
1 hr ago

At ANZ’s current share price of approximately $35.52, a sector-adjusted price-to-earnings (PE) calculation produces an estimated value that sits almost exactly in line with the market price. Whether that alignment signals fair value or masks a deeper story depends entirely on how the PE ratio is constructed, what inputs feed it, and how seriously its limitations are taken.
PE ratios remain the most widely cited valuation shorthand on the ASX, yet most retail investors either apply them to bank stocks in ways that produce misleading conclusions or skip the method entirely because the mechanics feel opaque. ANZ is an ideal teaching vehicle: it is one of the most actively traded ASX-listed securities, its financials are publicly available, and it sits inside a peer group where relative PE comparisons carry genuine analytical weight.
By the end of this guide, the reader will understand exactly how a PE-based valuation is constructed for a major bank stock, will have walked through the live ANZ calculation step by step, and will know how to interpret the output alongside the limitations that any serious analyst would flag.
Most investors encounter the PE ratio and treat it as a scorecard: low means cheap, high means expensive. That framing is incomplete for any stock and actively misleading for banks.
The PE ratio expresses how many dollars the market is willing to pay for each dollar of annual earnings. It is a measure of market sentiment and growth expectation as much as it is a measure of value. A bank trading at 18x earnings is not inherently “cheaper” than one at 27x; the higher multiple may reflect stronger returns on equity, a more durable earnings mix, or a brand premium that the market has consistently been willing to pay.
PE Ratio = Share Price ÷ Earnings Per Share (EPS)
For banks in particular, PE is most informative when read against sector peers rather than in isolation. Sector-wide earnings drivers, including interest rates, credit cycles, and regulatory capital requirements, affect all major banks simultaneously. A PE of 18x means one thing if the peer group averages 18x and something quite different if the average sits at 24x.
One distinction matters before proceeding:
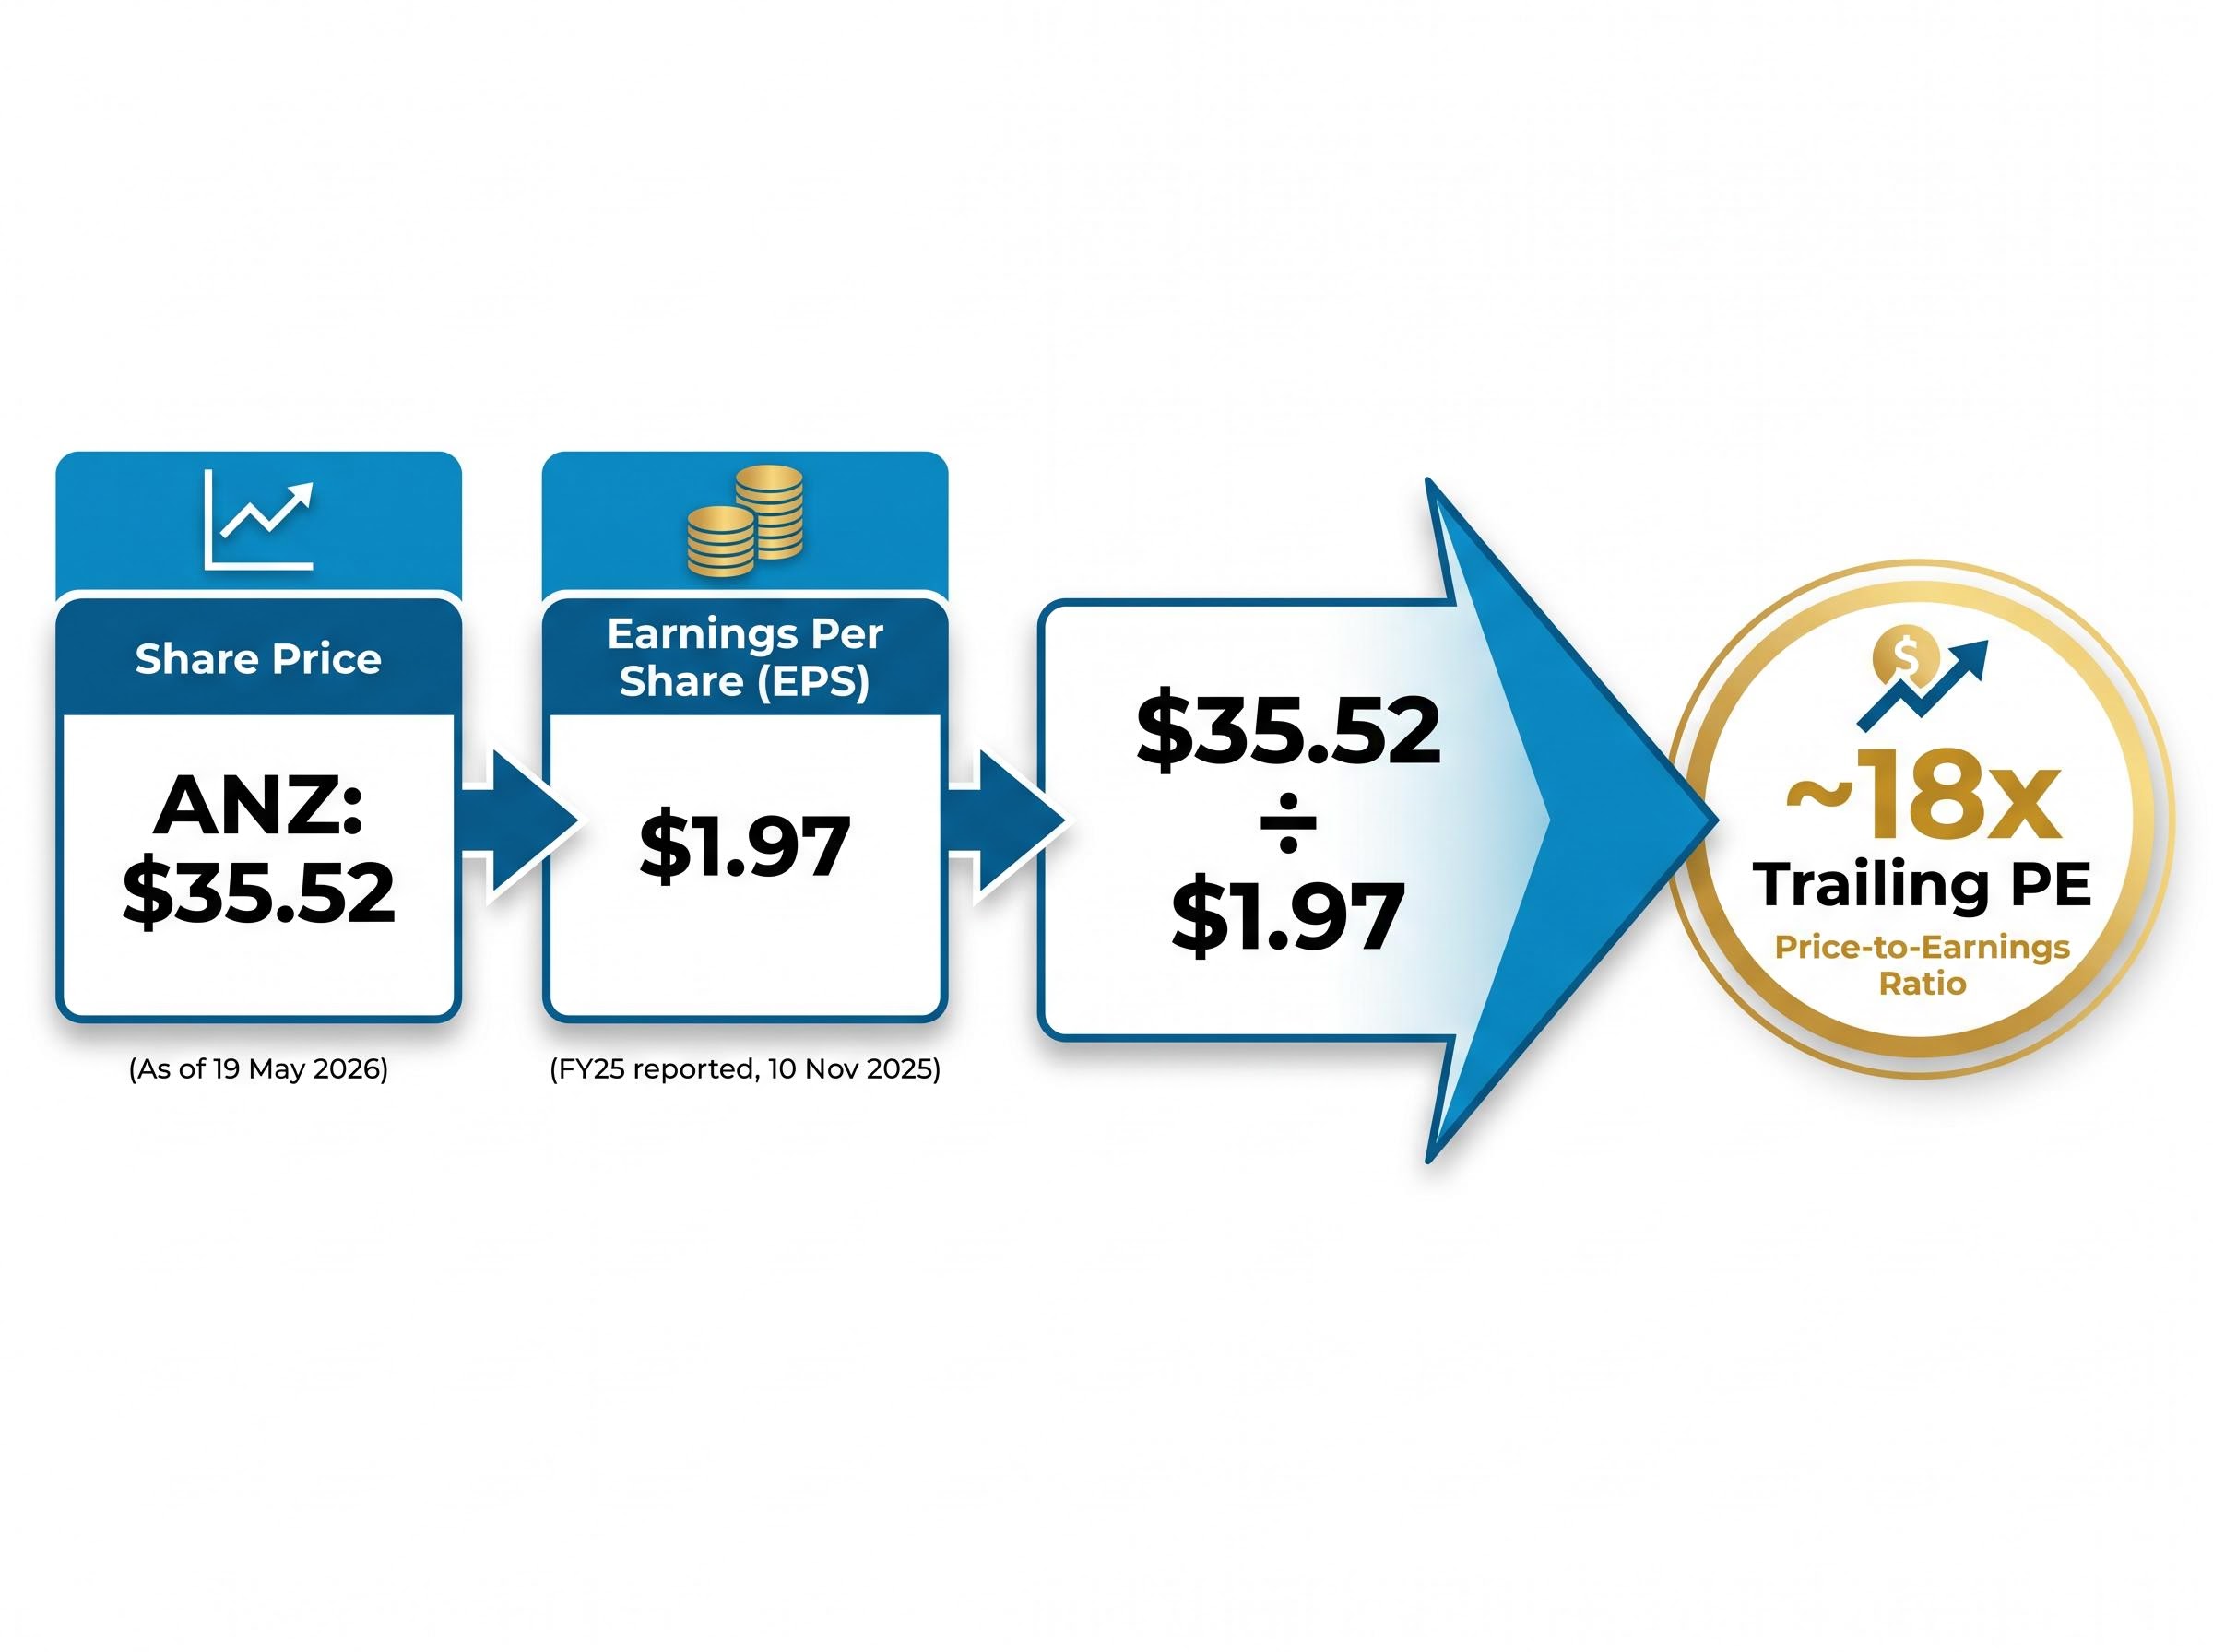
This guide uses trailing PE throughout. At ANZ’s current share price of approximately $35.52 and trailing EPS of approximately $1.97 (from FY25 results released 10 November 2025), the resulting trailing PE sits at approximately 18x. That number, on its own, says very little. The next section builds the calculation from scratch so the reader understands exactly where it comes from.
Two inputs are needed: the current share price and the most recent annual earnings per share. Each requires a deliberate choice about source and timing.
Share prices are available in real time from the ASX website, Yahoo Finance (using the ticker ANZ.AX), or any Australian brokerage platform. The figure used here, $35.52, reflects the price as of 19 May 2026.
EPS is less straightforward. The appropriate figure is the trailing twelve-month (TTM) reported EPS from the company’s most recent full-year results. ANZ’s FY25 results, released 10 November 2025, reported EPS of approximately $1.97. Using an outdated figure, say from FY24 or FY23, would distort the output because earnings shift materially year to year as provisions, write-backs, and one-off charges move through the income statement.
A further distinction exists between reported EPS and adjusted (or cash) EPS. One-off items such as remediation costs or restructuring charges can inflate or deflate reported earnings in a given year. For transparency and reproducibility, this guide uses the reported FY25 EPS of $1.97. Readers should verify the latest figure at the time of use via ASX company announcements, Yahoo Finance, or GuruFocus.
The process has three steps:
At $35.52 and EPS of $1.97, ANZ’s trailing PE is approximately 18x as of May 2026.
That same three-step process can be applied immediately to Commonwealth Bank, NAB, or Westpac using the same publicly available data sources. The calculation is identical; only the inputs change.
Applying the same PE ratio framework to NAB using FY24 cash EPS of $2.292 and a sector-average multiple of 18x produces an implied fair value of approximately $41.27 against a then-current price of $37.37, a useful illustration of how the same three-step method generates different signals for different banks depending on where each stock sits relative to the peer average.
A PE of 18x is a number. What turns it into information is context: where does ANZ sit relative to the other three major banks?
| Bank | Current share price (approx.) | Trailing EPS (approx.) | Trailing PE (approx.) |
|---|---|---|---|
| CBA | Refer to live data | Refer to live data | 26-28x |
| ANZ | $35.52 | $1.97 | ~18x |
| NAB | Refer to live data | Refer to live data | ~17-18x |
| WBC | Refer to live data | Refer to live data | ~17-18x |
The pattern is clear. CBA trades at a significant premium to the other three banks, while ANZ, NAB, and WBC cluster together in the 17-18x range. The sector average PE currently sits near or slightly above 18x as of mid-May 2026.
CBA’s premium does not mean the other three are undervalued. It reflects specific structural advantages: higher return on equity, a more favourably weighted earnings mix, and a retail brand strength that the market has consistently rewarded with a richer multiple. Treating CBA’s 26-28x PE as a benchmark that ANZ should converge toward would be an analytical error.
The sector-adjusted valuation calculation multiplies ANZ’s current EPS by the sector-average PE. Using the current trailing figures: $1.97 × 18x = approximately $35.46.
The RBA’s May 2026 cash rate decision confirmed the cash rate target at 4.35%, a level that compresses net interest margin expansion for all four major banks and anchors the earnings assumptions feeding every PE and DDM calculation in this guide.
Sector-adjusted implied value for ANZ: approximately $35.46, based on trailing EPS of $1.97 and a sector-average PE of approximately 18x.
That figure sits within cents of the current market price of $35.52. On a PE basis, ANZ appears to be trading broadly in line with its peer group average. The RBA cash rate, held at 4.35% as confirmed at the 6 May 2026 Board decision, is the backdrop against which these multiples exist; a shift in rate expectations would move net interest margins and, with them, the “E” that underpins every ratio in the table above.
The calculation above produced a tidy result. That tidiness is part of the problem.
PE ratios offer a snapshot. For banks, snapshots can be deceptive. Three specific limitations deserve attention:
CET1 ratio benchmarks across the sector reveal material capital position differences that a PE multiple will never surface; Bank of Queensland’s CET1 of 11.18% sits above its own management target range while its ROE of 6.4% runs roughly four percentage points below the sector average, a combination that illustrates exactly why price-to-book and ROE must be read together rather than treated as separate overlays.
The RBA cash rate trajectory matters directly to bank earnings because net interest margins, credit demand, and provisioning cycles all move with the policy rate; futures markets were pricing one further 25 basis point hike by December 2026 as of mid-May, which would compress the earnings assumptions underpinning every PE multiple in the table above.
ANZ pays fully franked dividends, and for many Australian retail holders the stock functions as an income investment first. PE says nothing about dividend sustainability, payout ratios, or the franking credit benefit that Australian tax residents receive. Income-focused investors need additional tools.
A reader who understands these limits will not over-anchor on the sector-adjusted estimate from the previous section. That discipline separates informed analysis from acting on a single number.
PE is one panel in a larger analytical dashboard. The following metrics address the specific blind spots identified above.
| Metric | What it measures | Why it matters for bank stocks |
|---|---|---|
| PE ratio | Price relative to earnings | Quick relative comparison against peers and historical range |
| Price-to-book (P/B) | Price relative to net asset value per share | Captures balance-sheet strength that PE ignores; standard in global bank analysis |
| Return on equity (ROE) | Profit generated per dollar of shareholder equity | Determines whether a P/B premium is justified; the link between earnings power and capital |
| Dividend yield (with franking) | Annual dividend as a percentage of share price, adjusted for franking credits | Directly addresses total-return calculation for Australian tax residents |
| Dividend Discount Model (DDM) | Intrinsic value based on expected future dividends discounted to present value | Natural complement to PE for income stocks; captures dividend sustainability and growth |
Price-to-book and ROE work as a pair. P/B shows whether the market is paying a premium or discount to the bank’s equity base. ROE shows whether that premium is justified by the returns the bank generates on its capital. A bank with high ROE and a high P/B multiple is being priced consistently; a bank with low ROE and a high P/B may be overvalued on a balance-sheet basis.

The Dividend Discount Model (DDM) is particularly relevant for ANZ. With a most recent full-year dividend of $1.66 per share and a history of fully franked payouts, yield-based analysis addresses the questions that matter most to income-focused holders: is the dividend safe, is it growing, and what does the franking credit add to total return?
DDM blended estimate: Approximately $35.10 using a $1.66 base dividend, or approximately $35.74 using $1.69. DDM outputs are highly sensitive to discount rate and growth assumptions, with tested scenarios ranging from approximately $18.78 to $84.50, which is precisely why a blended or averaged approach is used rather than a single-point estimate.
Qualitative overlays matter too. Unemployment trends (published monthly by the Australian Bureau of Statistics) and residential property price movements (tracked by CoreLogic and ABS quarterly indexes) feed directly into credit quality assumptions for any bank. These data points sit outside any formula but directly affect the earnings and dividends that formulas attempt to value.
The worked example above used ANZ as the teaching vehicle. The framework itself is transferable to any ASX-listed bank stock. Apply it this weekend using the following steps:
The single most important insight from this framework is relative, not absolute. The PE of any individual bank means far less than how it compares to the current peer group average. A stock trading at 15x in a 18x sector tells a different story from the same stock at 15x in a 22x sector.
Quantitative outputs from PE and DDM models are starting points for further qualitative research, not conclusions. Macro conditions, management strategy, regulatory changes, and competitive dynamics all shape whether a valuation gap closes, widens, or persists. Thorough investment analysis on a bank stock involves substantial qualitative work beyond any single model.
Sector-relative PE comparison gives ANZ investors a structured, reproducible estimate of whether the stock looks broadly expensive or inexpensive relative to peers. At the current figures, trailing PE of approximately 18x against a sector average of approximately 18x and a sector-adjusted implied value of roughly $35.46, ANZ does not appear dramatically mispriced on a PE basis.
That alignment may be the beginning of the story rather than the end of it. The complementary metrics covered in this guide, P/B, ROE, DDM, and dividend yield, may tell a more differentiated story about balance-sheet strength, income sustainability, and total return.
The next step is practical: apply the same framework to CBA, NAB, and WBC using the sources identified, compare the outputs, and use the results as one input into a fuller investment thesis.
For readers wanting to move beyond quantitative models entirely, our deep-dive into macro and qualitative overlays for bank valuation examines how RBA rate path data, CoreLogic property trends, APRA arrears statistics, and each bank’s strategic execution track record interact with PE and DDM outputs, using Westpac as the worked example to show how the same stock can look cheap or fairly priced depending on which inputs are stressed.
This article is for informational purposes only and should not be considered financial advice. Investors should conduct their own research and consult with financial professionals before making investment decisions.
A PE ratio (price-to-earnings ratio) measures how many dollars the market pays for each dollar of annual earnings, calculated by dividing the share price by earnings per share. For ANZ, dividing the current share price of approximately $35.52 by FY25 reported EPS of $1.97 produces a trailing PE of approximately 18x.
ANZ trades at approximately 18x trailing earnings, in line with NAB and Westpac which also cluster in the 17-18x range, while CBA commands a significantly higher premium of 26-28x due to its stronger return on equity and retail brand strength.
Multiply ANZ's trailing EPS by the sector-average PE multiple; using FY25 EPS of $1.97 and a sector-average PE of approximately 18x produces a sector-adjusted implied value of approximately $35.46, which is within cents of ANZ's current market price of $35.52.
The PE ratio ignores balance-sheet strength (such as the CET1 capital ratio), is distorted by one-off provisioning charges in any given year, and does not capture dividend sustainability or the impact of RBA interest rate changes on net interest margins.
Investors should complement the PE ratio with price-to-book (P/B), return on equity (ROE), dividend yield adjusted for franking credits, and a Dividend Discount Model (DDM) to address the balance-sheet and income blind spots that PE cannot capture.