
What NDQ Gives Australian Investors That the ASX Cannot
2 hrs ago

A stock trading at $35.52 and a model that produces values anywhere from $18.78 to $84.50 for the same company, depending on which inputs are selected. That is the Dividend Discount Model in practice, and understanding why that range exists is the whole point.
ANZ is one of Australia’s most widely held bank stocks, and dividend income sits at the centre of how many Australian investors evaluate it. The Dividend Discount Model (DDM) is one of the oldest equity valuation frameworks in use, and bank stocks are the category where it applies most naturally. With ANZ’s 2026 interim dividend confirmed at 83 cents per share and the RBA cash rate at 4.35%, the assumptions that feed a DDM carry real weight right now.
What follows explains how the DDM works from the ground up, walks through a full ANZ-specific worked example using current dividend data, shows how varying the inputs produces a wide range of estimated values, and explains why the model is a starting point rather than a verdict.
The DDM rests on a single premise: a company’s value equals the present value of all the dividends it will ever pay. That assumption holds most cleanly when dividends are predictable, recurring, and represent a genuine return of earnings rather than an occasional gesture.
Banks fit that description better than almost any other sector on the ASX. The major Australian banks collectively account for roughly one-third of the domestic equity market by capitalisation, and dividend income is central to how investors approach them. ANZ is among the most actively traded securities on the exchange, with a share price of approximately $35.52 as of mid-May 2026.
Australian banks, REITs, utilities, and infrastructure companies sit at the top of the list of ASX sectors suited to dividend valuation precisely because regulatory frameworks and mandated distribution requirements keep payout behaviour within a predictable band, the condition the Gordon Growth Model most needs to hold.
The contrast with growth companies is where the model’s logic sharpens.
Why the DDM suits banks:
Why the DDM suits growth stocks less well:
Understanding this structural difference prevents indiscriminate application. The DDM’s logic holds where the underlying assumption, stable distributable earnings, reflects reality.
The formula itself is deceptively simple. Before any symbols, here is what it says in plain language: a stock’s fair value equals next year’s expected dividend, divided by the gap between the return an investor requires and the rate at which dividends are expected to grow forever.
The Gordon Growth Model: Value = D ÷ (r – g) Where D = forward annual dividend, r = discount rate (cost of equity), g = long-term dividend growth rate.
Three inputs. One output. The judgment lives entirely in the inputs.
The origins of the dividend discount model trace to John Burr Williams in 1938, a direct response to the speculative excesses of the 1920s bull market, and the institutional framework he established remains embedded in the CFA curriculum and active sell-side practice today.
The formula is simple. The judgment is in the inputs. Readers who understand these mechanics can interrogate any valuation they encounter rather than treating the output as authoritative.
Start with the dividend. ANZ’s 2026 interim dividend is 83 cents per share, partially franked at 75%, announced on 1 May 2026. The mechanical heuristic for annualising is straightforward: double the most recent interim. That produces $1.66 per share.
Apply the Gordon Growth Model using a mid-range discount rate of 7.73% and a 3% growth assumption as the base case:
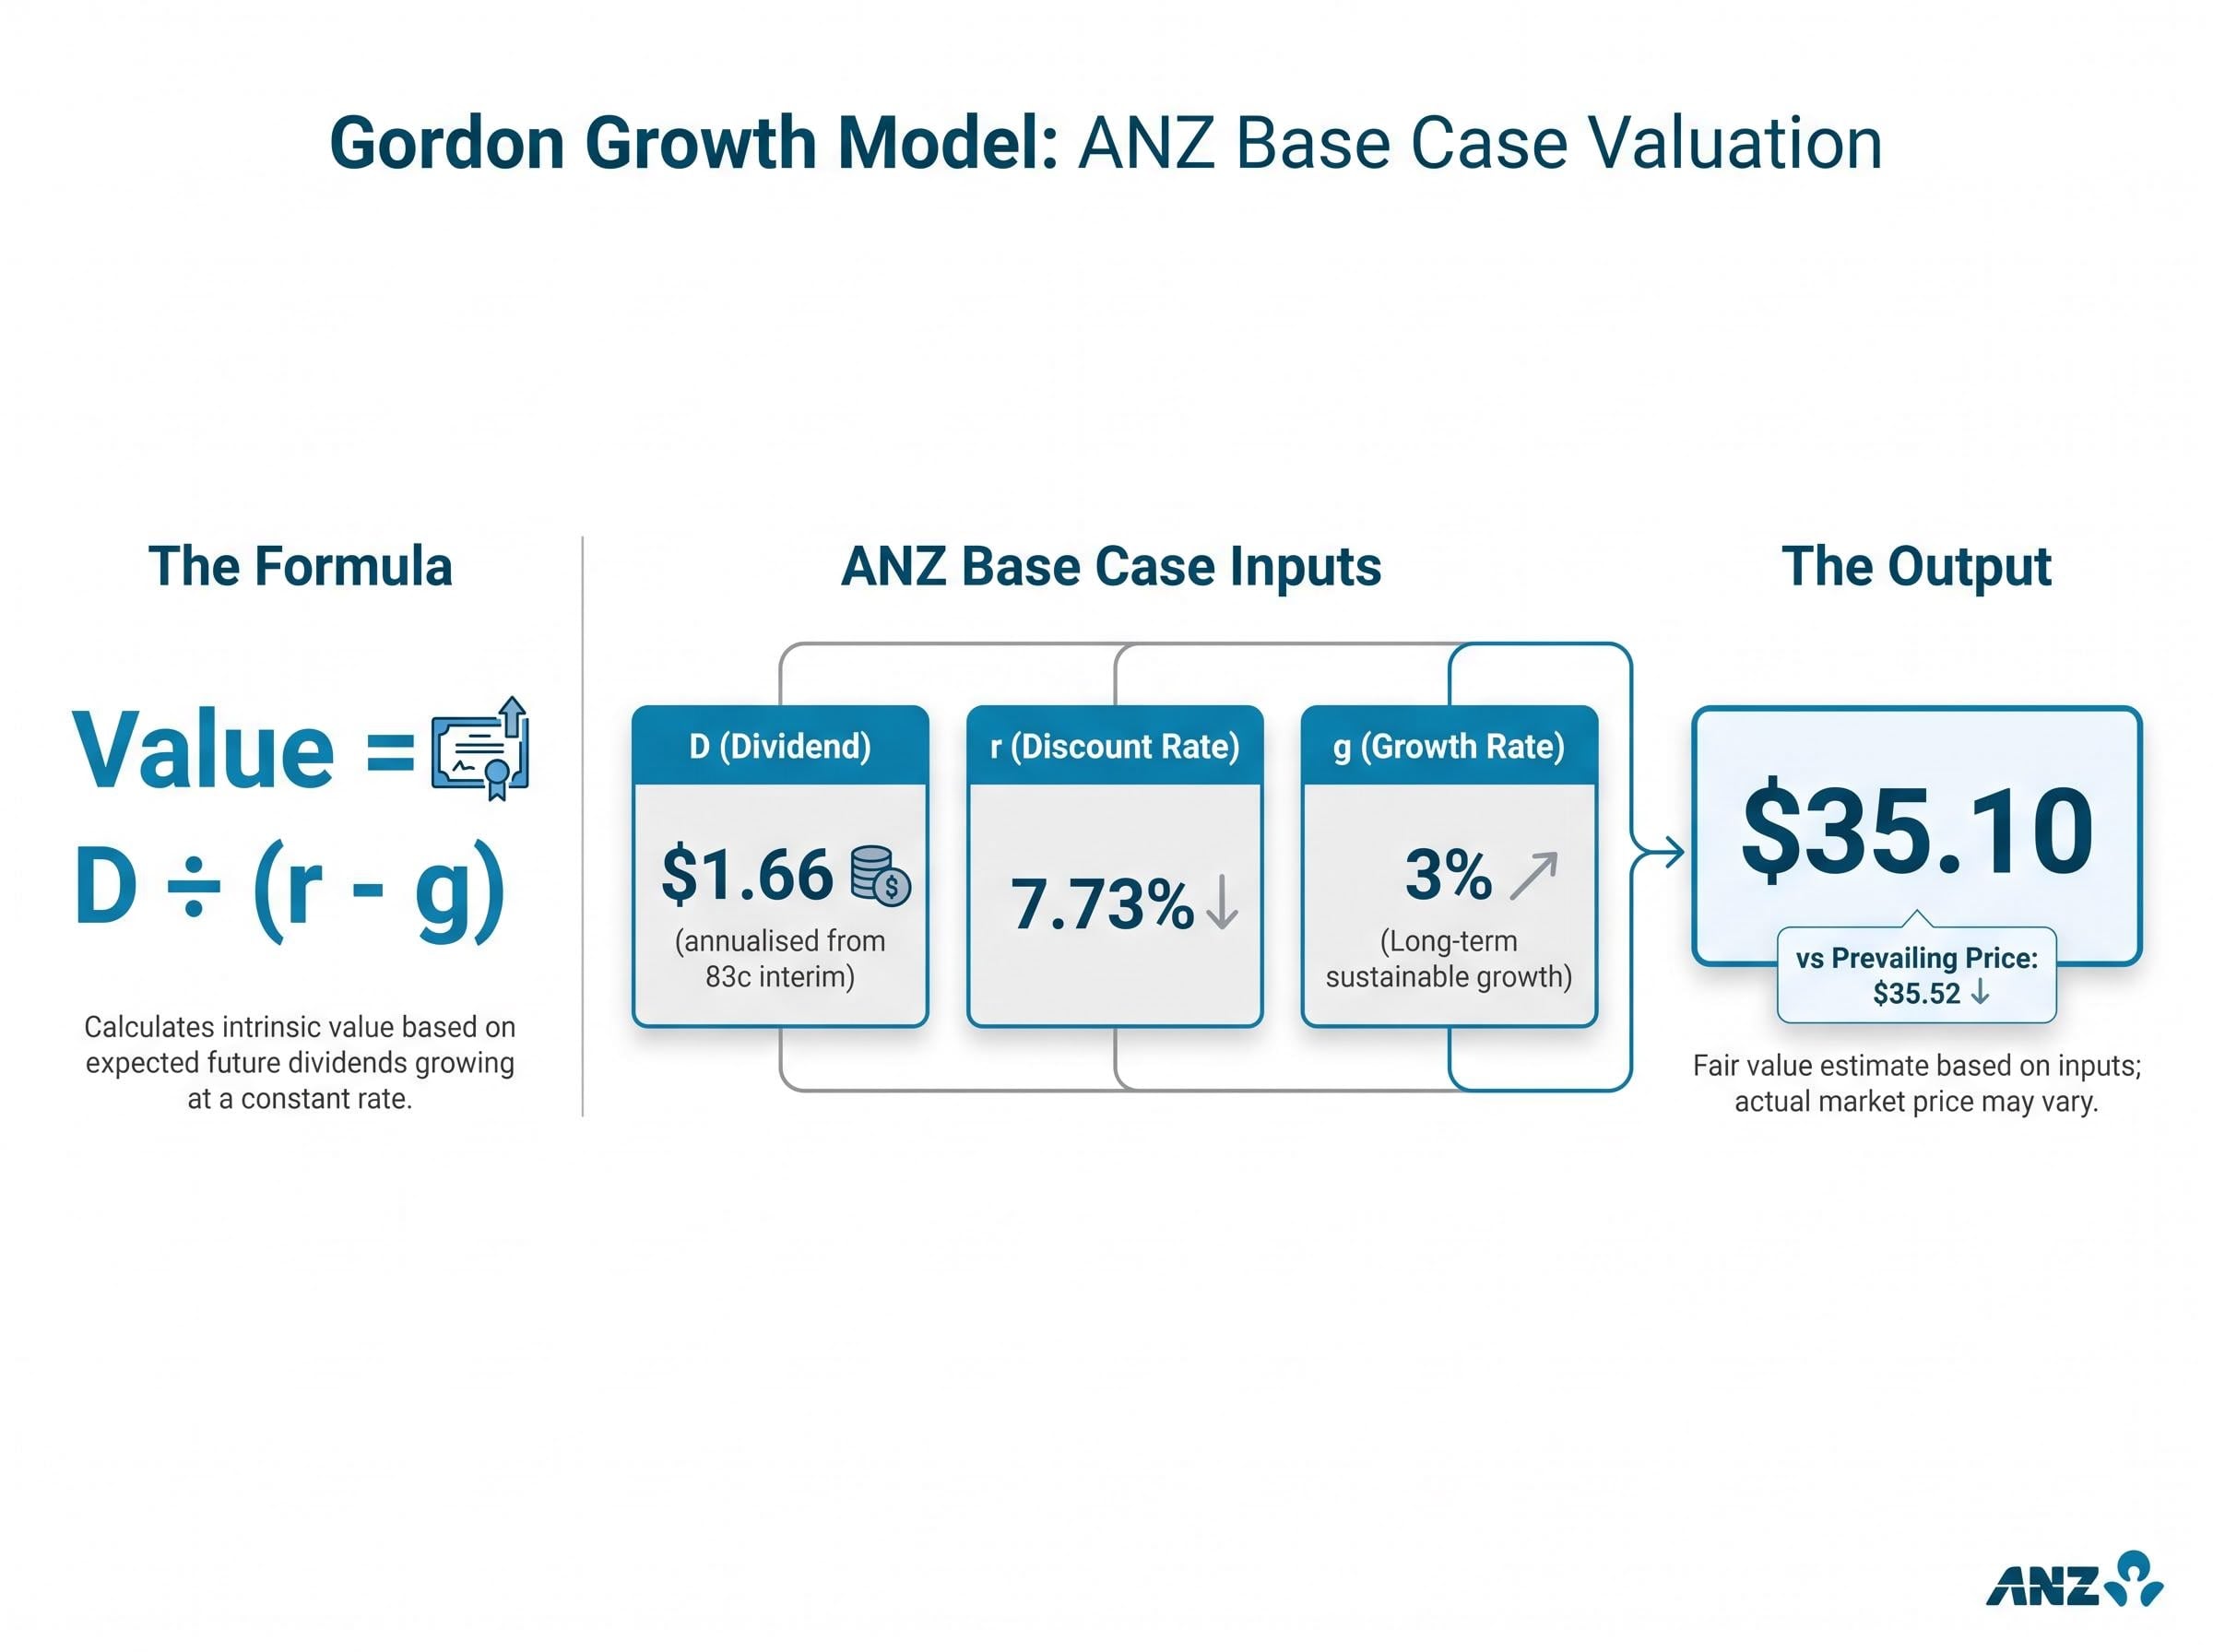
Value = $1.66 ÷ (0.0773 – 0.03) = $1.66 ÷ 0.0473 ≈ $35.10
That output sits just below ANZ’s prevailing share price of $35.52. The illustrative run-rate forward yield on $1.66 is approximately 4.7% before franking adjustment, while actual trailing yield reported by market platforms sat at approximately 4.58% as of 19 May 2026.
| Dividend Input | Discount Rate | Growth Rate | DDM Value |
|---|---|---|---|
| $1.66 | 7.73% | 3% | $35.10 |
| $1.69 | 7.73% | 3% | $35.74 |
A three-cent difference in the annual dividend input, from $1.66 to $1.69, shifts the modelled fair value by roughly $0.64. That sensitivity matters because mechanically doubling the most recent interim is a heuristic, not a forecast. Using reported analyst consensus or the most recent full-year dividend paid is an equally valid approach.
The 75% partial franking on the 2026 interim also warrants attention. Investors calculating a grossed-up yield need to account for the reduced franking credit relative to a fully franked dividend. A fully franked 83-cent interim would carry a higher grossed-up value than one franked at 75%, and that distinction feeds directly into income-focused valuation assessments.
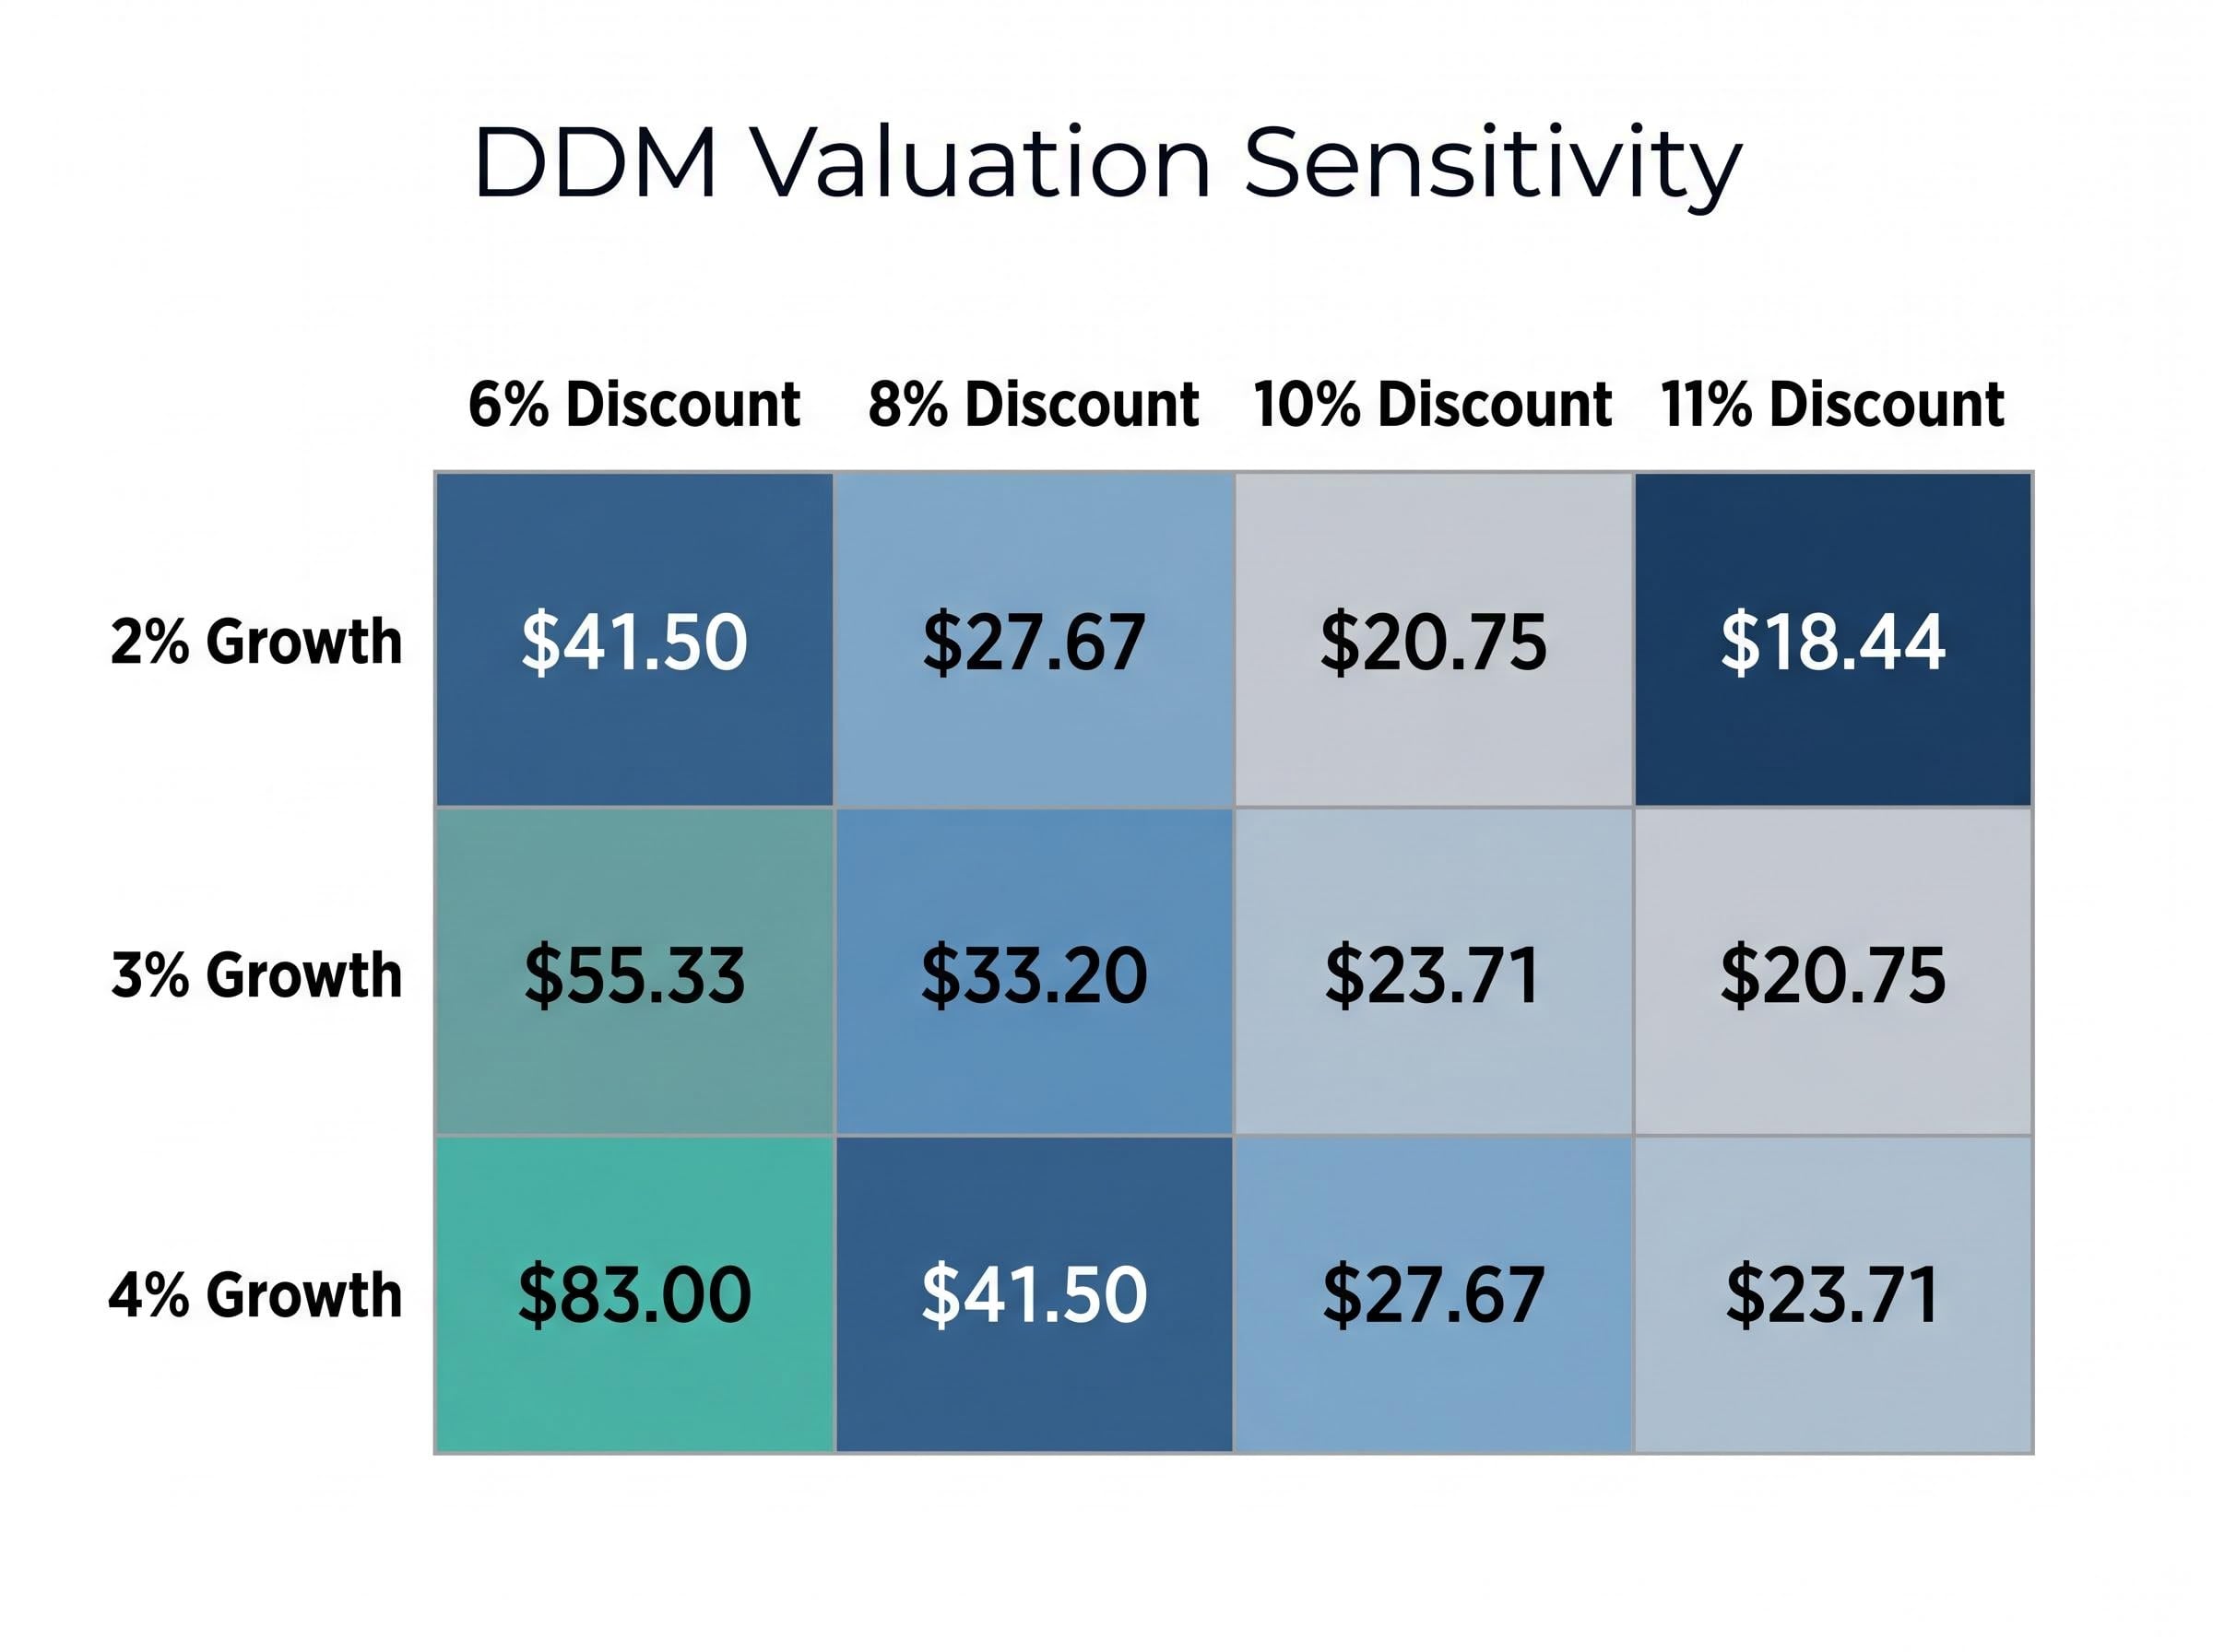
The base case produced a tidy number close to the market price. Now stretch the inputs and watch what happens.
| Growth Rate | 6% Discount | 8% Discount | 10% Discount | 11% Discount |
|---|---|---|---|---|
| 2% | $41.50 | $27.67 | $20.75 | $18.44 |
| 3% | $55.33 | $33.20 | $23.71 | $20.75 |
| 4% | $83.00 | $41.50 | $27.67 | $23.71 |
The range spans from approximately $18.78 at the most conservative end (11% discount rate, 2% growth) to approximately $84.50 at the most aggressive (6% discount rate, 4% growth). That is a spread of more than four to one, for the same stock using the same formula.
Small adjustments of plus or minus 0.5-1 percentage point to either the cost of equity or the long-term dividend growth rate can move DDM fair values for banks by 10-20%.
The mathematical reason is straightforward. As the discount rate and growth rate approach each other, the denominator in the formula (r minus g) shrinks toward zero. A smaller denominator produces a larger quotient, and the valuation accelerates upward. At a 6% discount rate and 4% growth, the denominator is just 0.02, which is why the output explodes to $83.
ANZ payout ratios are clustering in the 60-70% of cash earnings range, viewed by analysts as sustainable. That range supports a moderate growth assumption, but “moderate” still leaves room for meaningful valuation swings.
Averaging across a range of plausible scenarios is a disciplined response to this input uncertainty. It represents a spectrum of reasonable views rather than a single assumed future. Professional analysts use the DDM this way: not as a point estimate, but as a probability-weighted range of outcomes.
The Gordon Growth Model assumes dividends grow at a constant rate forever. ANZ’s dividend path is shaped by forces that a fixed growth rate cannot capture: APRA capital requirements, credit cycle conditions, competitive margin pressure in mortgages and deposits, and management decisions on buybacks versus distributions.
The current context introduces specific uncertainties. The RBA cash rate is at 4.35% effective 6 May 2026, following a 25 basis point increase. Mortgage competition is intense. ANZ’s 2026 interim was only 75% franked rather than fully franked. Cash earnings growth consensus sits at low single digits over the next one to two years, reflecting net interest margin headwinds and moderate credit growth.
The RBA’s May 2026 cash rate decision raised the target rate by 25 basis points to 4.35%, a move that feeds directly into the risk-free rate component of the cost of equity used in DDM calculations and affects the net interest margin environment in which ANZ operates.
ANZ CET1 ratios remain above APRA’s “unquestionably strong” benchmark, supporting ongoing capital management capacity. But the model cannot encode APRA’s next policy decision, a spike in unemployment, or a shift in residential property prices. Thorough qualitative analysis on a bank stock may involve upwards of 100 hours of research before any financial modelling begins.
Professional investors typically use the DDM as a cross-check or a yield-plus-growth narrative tool rather than as the primary basis for target prices. PE multiples, price-to-book, and excess return frameworks lead the analysis for most Australian bank analysts.
Key qualitative research areas that should accompany any DDM analysis of a bank stock:
Complementary valuation frameworks strengthen the analytical foundation. PE multiples provide a market-relative check on earnings pricing. The price-to-book ratio, assessed relative to return on equity, captures whether a bank is creating or destroying value above its cost of capital. Excess return or residual income models frame bank value as equity capital plus the present value of future returns above the cost of equity.
Using the PE ratio alongside the DDM creates a triangulation point: when both methods converge on a similar valuation level, as they can for mature ASX banks with stable earnings, that convergence carries more analytical weight than either model’s output in isolation.
Blending DDM with these comparable methods gives a triangulated view rather than dependence on a single model’s assumptions.
The DDM is most useful as a framework for stress-testing assumptions about dividend sustainability and required returns, not as a standalone price target. The formula forces investors to state their beliefs about the future explicitly: what return they need, what growth they expect, and what they think the company will pay.
The ANZ example brings that principle to life. The blended DDM estimate of approximately $35.10-$35.74 sits close to the prevailing share price of $35.52, which suggests the market is roughly pricing in a moderate growth and moderate risk scenario, not an extreme one. That observation is itself useful information.
Placing the ANZ model output within its ASX-wide dividend yield context sharpens the interpretation: the ASX 200 yield stood at approximately 3.3% in late 2025, meaningfully below its 10-year historical average of 4.3%, which suggests the moderate growth scenario implied by ANZ’s current price is not an outlier but broadly consistent with how the market is pricing income stocks across the exchange.
The model’s output is a lens, not a verdict. The wide scenario range from $18.78 to $84.50 is not a flaw; it is the model telling the user exactly how much the valuation depends on their assumptions.
One concrete next step: identify which assumption in the model generates the most uncertainty, whether that is the growth rate, the discount rate, or the dividend itself, and research that specific question further. That is where the real analytical work begins.
This article is for informational purposes only and should not be considered financial advice. Investors should conduct their own research and consult with financial professionals before making investment decisions. Past performance does not guarantee future results. Financial projections are subject to market conditions and various risk factors.
The Dividend Discount Model (DDM) estimates a stock's fair value as the present value of all future dividends it will pay. For ANZ, it is particularly relevant because the bank has a long, predictable dividend history, making the model's core assumption of stable distributable earnings a reasonable fit.
ANZ's 2026 interim dividend is 83 cents per share, partially franked at 75%. A common approach is to double the interim to produce an annualised estimate of $1.66 per share, which is then used as the dividend input in the Gordon Growth Model formula.
The DDM output is highly sensitive to the discount rate and growth rate inputs; as those two figures move closer together, the denominator in the formula shrinks and the estimated value rises sharply. Using a 6% discount rate with 4% growth produces a value near $84.50, while an 11% discount rate with 2% growth produces a value near $18.78 for the same stock.
Sell-side analysts typically model the cost of equity for major Australian banks at 10-11%, derived from a risk-free rate of around 4-4.5% based on 10-year Australian government bond yields, an equity risk premium of 5-5.5%, and a bank beta of approximately 1.0-1.1. Morningstar Australia generally uses a range of 9-11% for ASX large caps.
The Gordon Growth Model assumes dividends grow at a constant rate forever, which cannot capture real-world variables such as APRA capital requirements, credit cycle shifts, changes in franking levels, or RBA rate decisions. Analysts typically use the DDM as a cross-check alongside PE multiples, price-to-book ratios, and excess return frameworks rather than as a standalone valuation tool.