
Why Most Wealth-Building Strategies Aren’t Built for You
8 hrs ago

NAB shares were trading at $37.37 in May 2026, but a PE-based calculation puts a sector-adjusted value of $41.27 on the stock. That gap is either an opportunity or a mirage. The method used to produce that number is the same one professional analysts apply every day to ASX-listed banks, and it takes fewer than five minutes once the inputs are in hand.
Australian major banks collectively represent roughly 30% of the ASX by market capitalisation, making them impossible to ignore for domestic investors. Yet bank shares are among the most misunderstood to value: their earnings are cyclical, their balance sheets are leveraged, and headline profit numbers can obscure as much as they reveal. A clear, repeatable method for producing a first-pass valuation estimate is the starting point for any serious analysis.
This guide walks through the price-to-earnings (PE) ratio valuation method step by step, using NAB as a live worked example with verified FY24 data. It explains how to compare that estimate to NAB’s current market price, sets out precisely what the resulting number does and does not tell an investor, and introduces the complementary metrics that experienced analysts use to cross-check the result.
When an investor looks at a share price and wonders whether it is cheap or expensive, they are already asking a PE question without knowing it. The PE ratio answers that question directly: it measures how many dollars the market is willing to pay for each dollar of a company’s annual profit. A PE of 16x means investors are paying $16 for every $1 of earnings.
The formula is straightforward.
PE Ratio = Share Price ÷ Earnings Per Share (EPS)
The denominator, earnings per share, is where bank valuations diverge from other sectors. Australian bank analysts use cash EPS rather than statutory EPS for peer comparisons. The distinction matters:
PE comparisons work differently for banks than for companies in other sectors. Banks are leveraged by nature, their earnings fluctuate with credit cycles and interest rate environments, and provisioning decisions (the amount set aside for potential loan losses) can shift reported profit significantly from one year to the next. Using cash EPS as the starting point ensures like-for-like comparisons across the big four.
The calculation requires two inputs and one division. Each input comes from a specific, publicly available source, so the reader can replicate the method for any ASX-listed bank.
| Input | Value |
|---|---|
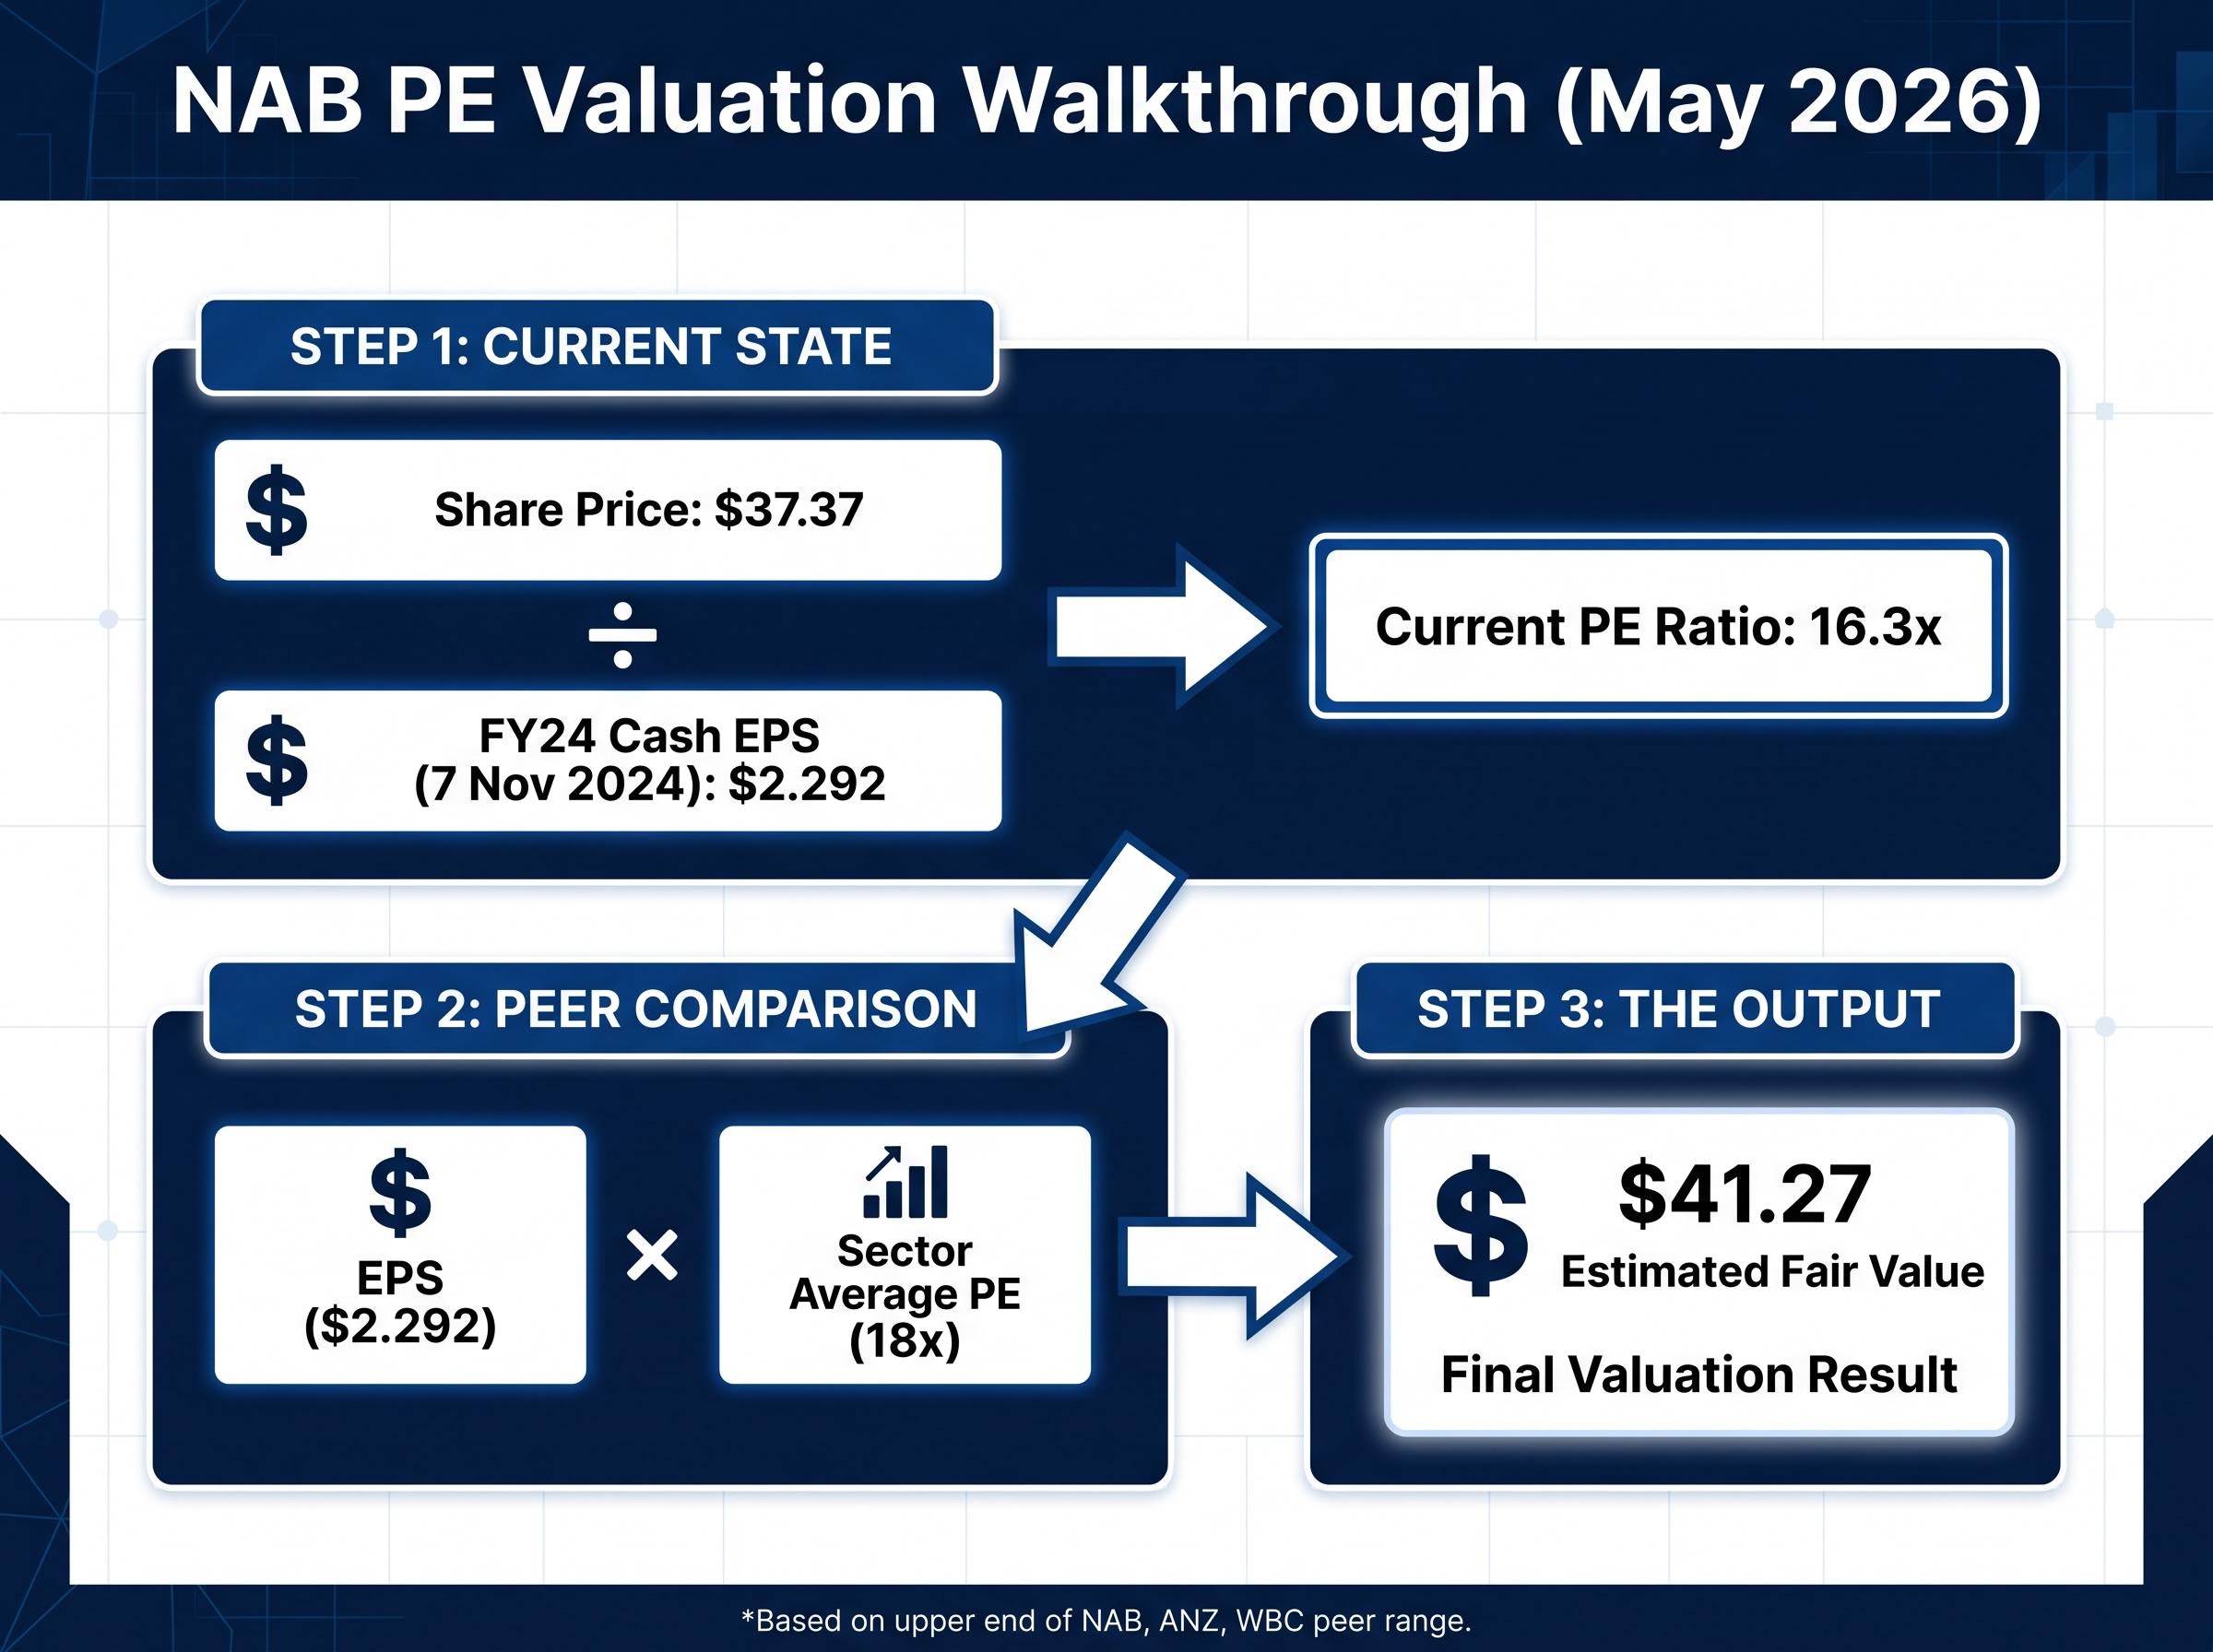
| NAB FY24 Cash EPS | $2.292 |
| NAB Share Price (analysis date) | $37.37 |
| Calculated PE Ratio | ~16.3x |
That 16.3x multiple tells the investor that the market is paying approximately $16.30 for every dollar of NAB’s annual cash earnings. The number on its own, however, means little without a reference point. A PE of 16.3x could be expensive in a sector where peers trade at 12x, or cheap in a sector where the average sits at 20x.
The next step transforms this single number into a valuation estimate by comparing it to what the market typically pays for earnings across the big four.
A PE ratio becomes an analytical tool when it is measured against what the market pays for comparable earnings elsewhere. If NAB’s earnings are similar in quality and risk to those of its big-four peers, the market should price them at a similar multiple. Any gap between NAB’s PE and the sector average is the starting point for a buy or sell thesis.
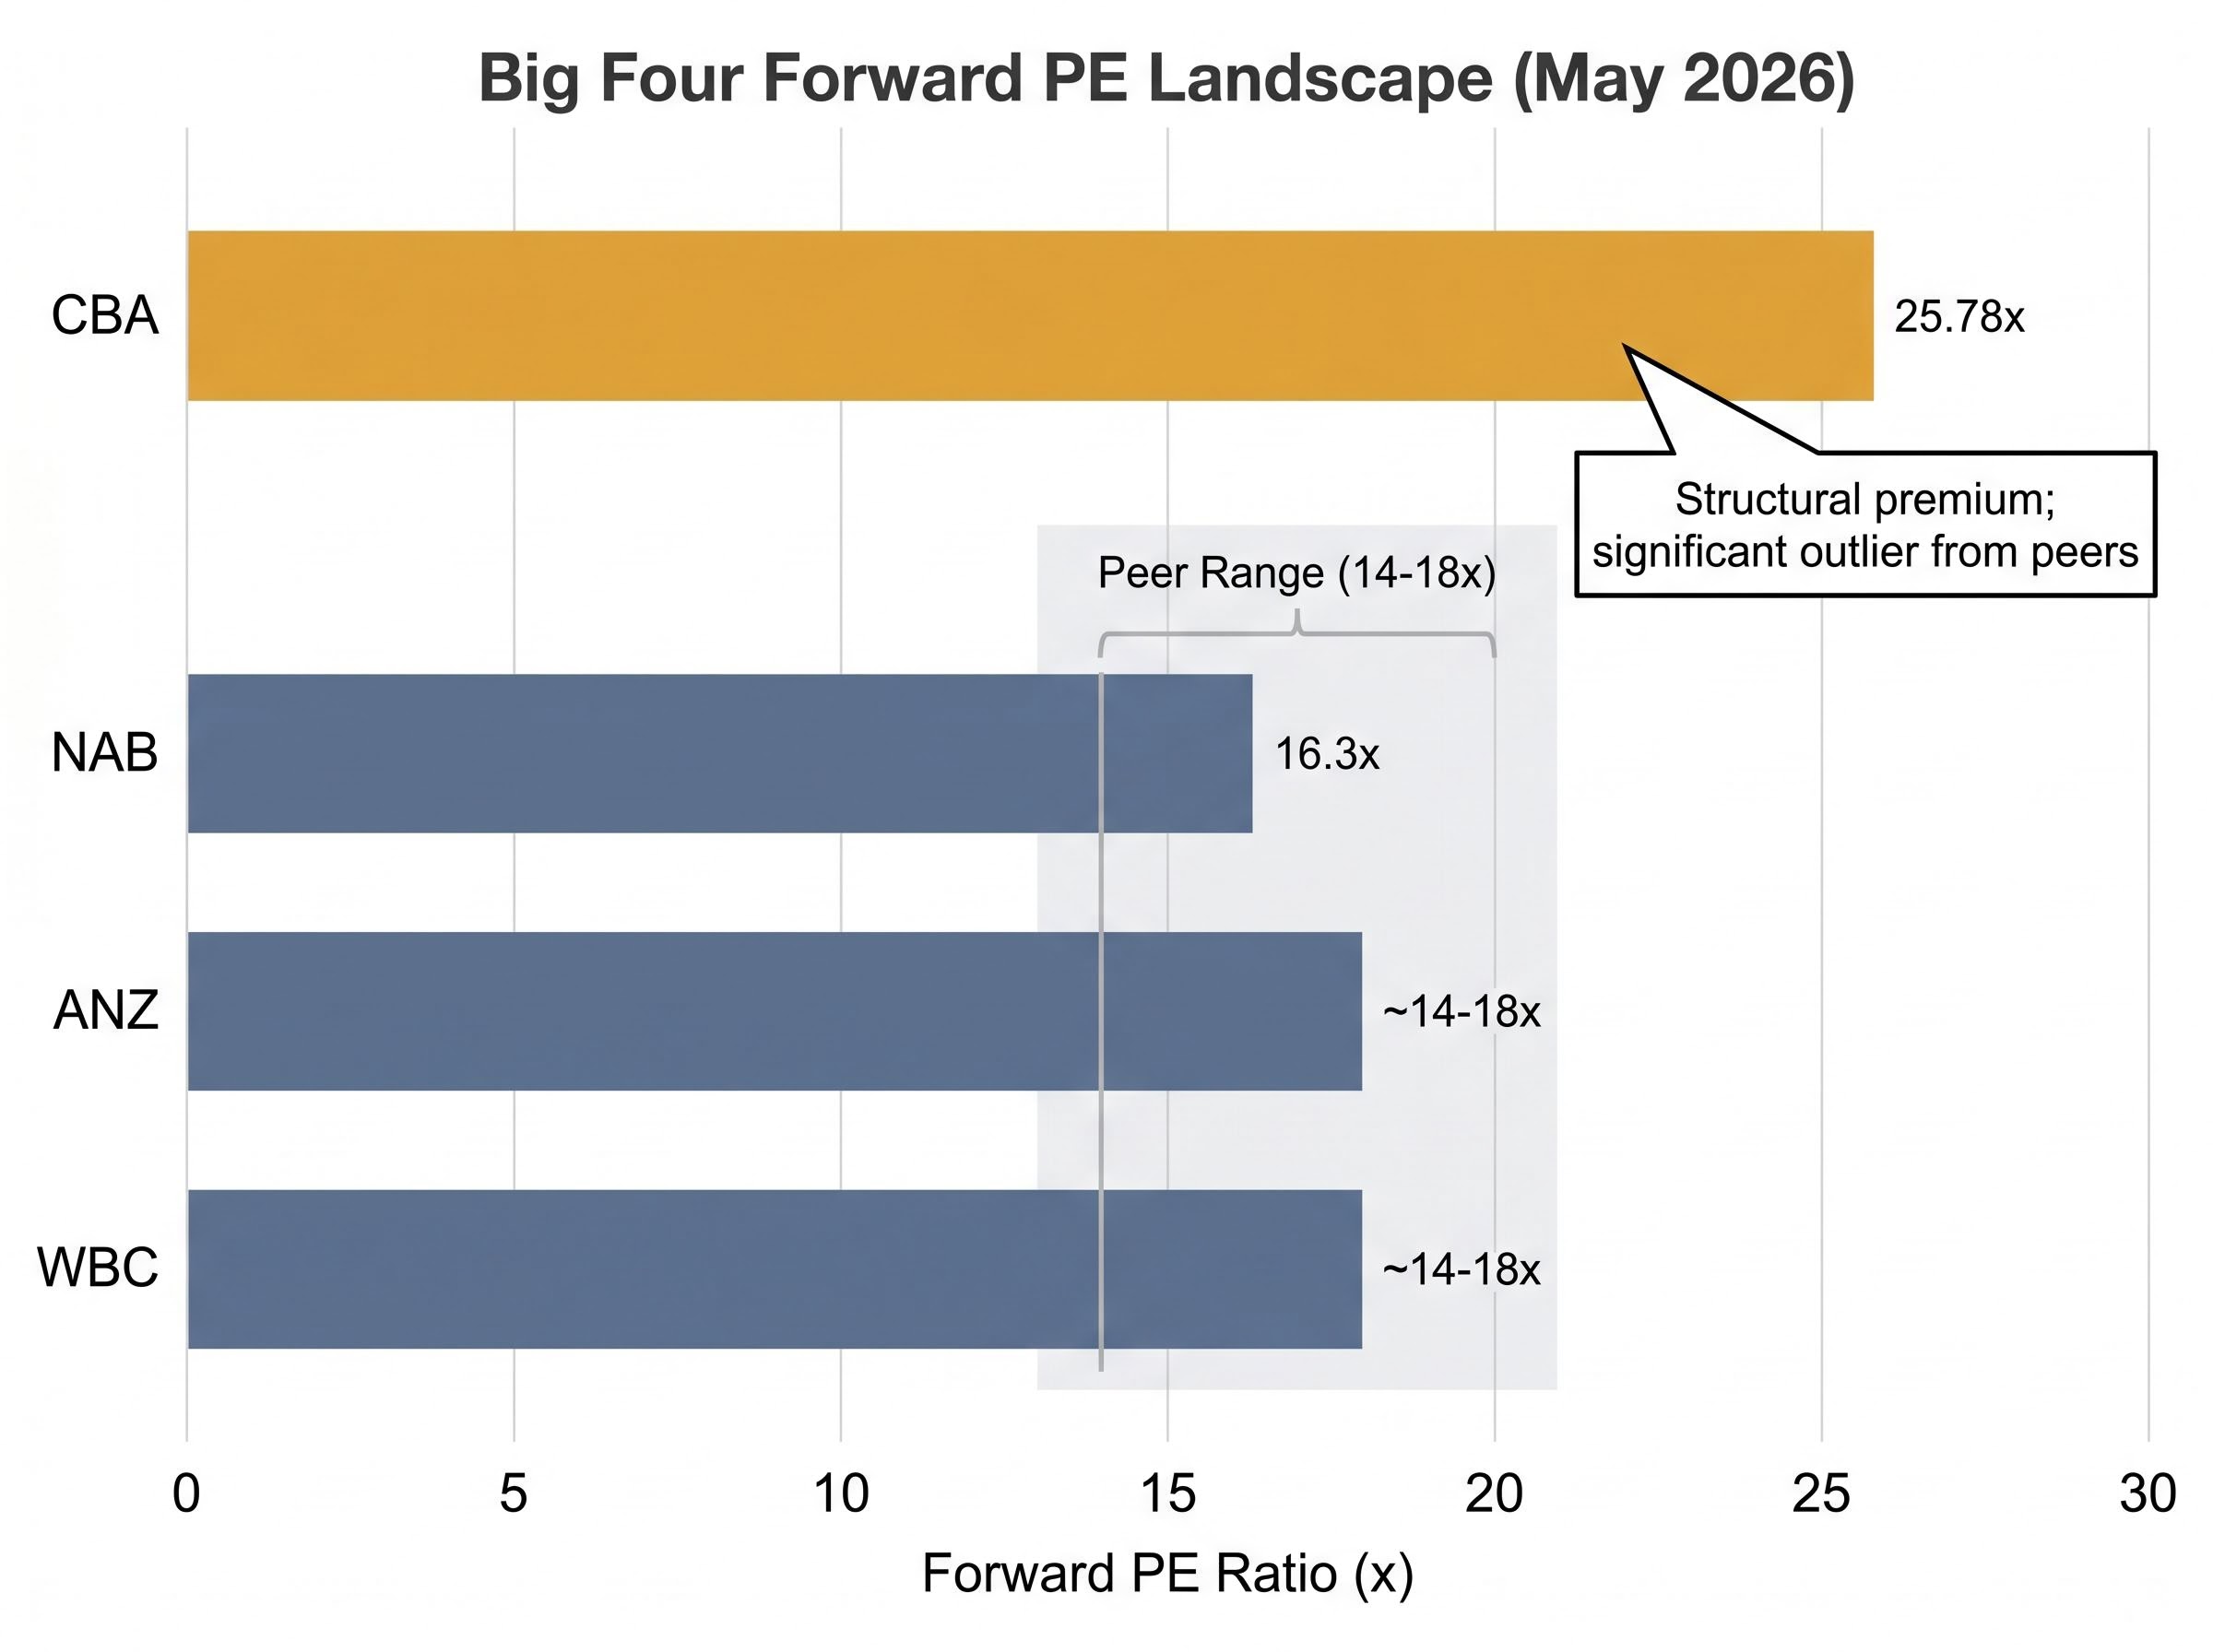
The big-four PE landscape as of May 2026 reveals a significant disparity.
| Bank | Approximate Forward PE | Key Note |
|---|---|---|
| CBA | ~25.78x | Structural premium; significant outlier from peers |
| NAB | ~16.3x | Within peer range |
| ANZ | ~14-18x | Within peer range |
| WBC | ~14-18x | Within peer range |
CBA commands a forward PE of approximately 25.78x, reflecting its superior return on equity (ROE), its position as Australia’s dominant retail digital banking franchise, and consistent market share leadership. This premium is not simply optimism; it reflects genuine franchise advantages.
CBA’s valuation premium relative to peers is not a simple market sentiment artifact: its return on equity of approximately 13.1% sits materially above the sector average of around 9.35%, and its CET1 ratio of 12.3% provides roughly $10 billion in capital buffer, both of which offer quantitative grounding for why the market prices CBA’s earnings more expensively than NAB, ANZ, or WBC.
Including CBA in a raw sector average, however, produces a misleadingly high benchmark. A more conservative peer group of NAB, ANZ, and WBC gives a truer like-for-like comparison. The choice of sector PE anchor matters: using 18x versus a lower peer-only average can shift the estimated fair value by several dollars per share.
The worked example uses a sector-average PE of 18x, consistent with the upper end of the NAB, ANZ, and WBC peer range.
Estimated Fair Value = EPS × Sector Average PE
$2.292 × 18 = approximately $41.26
The source calculation that produced the $41.27 estimate used an EPS figure of $2.26 rather than the verified $2.292, yielding a near-identical result. Both inputs place NAB’s estimated fair value above its $37.37 market price, suggesting NAB may be trading at a discount to what the sector average PE implies its earnings are worth.
For context, UBS held a Buy rating on NAB with a $47 price target as of January 2026. Macquarie held a Hold rating with a $42 price target in early May 2026. VanEck commentary noted NAB offers an attractive franked dividend yield at a lower PE than peers.
The estimate communicates something specific: on an earnings-multiple basis, NAB appears to be trading at a discount to what the sector typically pays for comparable bank earnings. That is a meaningful starting observation for further analysis.
It is not a price target. The PE method has structural limitations that are particularly pronounced for bank shares:
The PE ratio blind spots are well-documented across professional investment literature: the multiple ignores capital structure, breaks down entirely for loss-making periods, and treats two firms with identical earnings but radically different balance sheets as equivalent investments.
The regulatory and macroeconomic backdrop adds further layers the PE method cannot reflect. The RBA raised the cash rate to 4.35% on 6 May 2026, continuing a rising rate environment that generally expands net interest margins (NIMs), a positive earnings tailwind for banks. APRA announced consultations on enhancements to bank capital and liquidity frameworks in March 2026, with big-four CET1 ratios sitting at approximately 11-12% as of 1H 2026. Basel IV implementation is compressing ROE toward approximately 10% across the sector. Commercial real estate exposure remains a specific risk for NAB given its larger business banking book.
APRA’s capital and liquidity reform roadmap, published in March 2026, sets out the finalisation of Basel III implementation alongside targeted amendments increasing risk sensitivity in credit risk weights, the regulatory framework that is compressing big-four ROE toward approximately 10% and reshaping the earnings base that PE-based valuations depend on.
A bank trading at 1.5x book value with 10% ROE implies a roughly 6.7% earnings yield, a useful cross-check on the PE result.
Knowing where a valuation method’s blind spots are is as valuable as knowing how to run the calculation, because it prevents an investor from treating a $41.27 estimate as a guarantee rather than a starting hypothesis.
This article is for informational purposes only and should not be considered financial advice. Investors should conduct their own research and consult with financial professionals before making investment decisions.
Each metric in a bank analyst’s toolkit measures something the others miss. PE captures the earnings multiple. The methods below close the gaps PE leaves open.
Price-to-Book Value (PBV) anchors the share price to the underlying asset base rather than reported earnings, making it more stable across credit cycles. Australian banks typically trade at 1-2x book value. NAB’s PBV of approximately 1.4x signals broadly fair value when considered alongside its PE. PBV below 1x can indicate either deep value or genuine fundamental concerns.
The Dividend Discount Model (DDM) is particularly relevant for ASX bank investors. NAB’s full-year dividend of $1.69 per share is fully franked. Franking credits represent company tax already paid on behalf of shareholders, so for eligible Australian resident investors, the grossed-up dividend value rises to approximately $2.44 per share. This is economically real income that a PE analysis overlooks entirely.
A DDM central estimate using NAB’s cash dividend and blended assumptions produces a valuation of approximately $35.74-$36.16. Incorporating the grossed-up dividend lifts that estimate to $51.66. The gap illustrates how significant franking credits are to total return.
The DDM’s sensitivity to assumptions, however, demands caution. The scenario range spans from $19.00 (using an 11% required return and 2% growth) to $85.50 (using a 6% required return and 4% growth). Single-scenario DDM outputs must be treated as one data point, not a verdict.
For investors wanting to build out the DDM component in full, our dedicated guide to the Dividend Discount Model for ASX bank shares walks through the sensitivity analysis with a worked NAB example, demonstrating how including franking credits in the grossed-up dividend calculation lifts the central DDM estimate from approximately $35.74 to $51.66 and why the 19-scenario range from $19 to $85 should frame any single-output DDM reading.
A practical multi-metric screen brings these methods together into a repeatable framework for evaluating any big-four bank share.
| Metric | What It Measures | NAB Approximate Figure | Threshold to Watch |
|---|---|---|---|
| Forward PE | Price paid per dollar of earnings | ~16.3x | Below 18x |
| PBV | Price relative to net asset base | ~1.4x | Below 1.5x |
| Gross Dividend Yield | Total yield including franking credits | ~6.5%+ | Above 6% |
| CET1 Ratio | Capital buffer strength | ~11-12% | Above 11% |
| ROE | Return generated on shareholder equity | ~10% | Above 10% |
Each additional metric closes a gap that PE alone leaves open. PBV guards against balance sheet deterioration being masked by stable earnings. DDM captures the compounding value of franking credits. The ROE screen tests whether earnings quality justifies the multiple.
The NAB worked example produces a transferable process. The same sequence applies to any ASX-listed bank:
Peer-relative PE analysis produces different conclusions depending on which bank sits at the centre of the comparison: WBC’s trailing PE of approximately 19.2x sits above the big-four peer average and implies a modest premium over an implied fair value of around $34.56 when the same sector-average PE method applied to NAB is turned toward Westpac’s FY24 earnings.
Before acting on the estimate, cross-check the result against complementary metrics:
NAB’s $41.27 estimate versus its $37.37 market price does not constitute a buy recommendation. It is a hypothesis to test against further analysis.
The PE ratio method produced a $41.27 estimate against NAB’s $37.37 market price. That gap is a signal worth investigating, not a verdict to act on.
The value of learning this method lies in applying it consistently across the big four rather than anchoring on one number from one calculation. Each bank’s cash EPS, peer-relative PE, and sector context will produce a different estimate, and the variation between those estimates often reveals more than any single figure.
The complementary methods and the practical five-metric screen outlined above are the natural next step after a PE-based first pass. A PE ratio identifies where to look. PBV, DDM, gross dividend yield, CET1, and ROE together determine whether what it found is worth acting on.
Past performance does not guarantee future results. Financial projections are subject to market conditions and various risk factors.
The PE ratio method values a bank share by dividing its current share price by its earnings per share (EPS), then comparing that multiple to what the market pays for similar bank earnings. If a bank's PE is below the sector average, its shares may be trading at a discount to implied fair value.
Cash EPS strips out one-off items unrelated to recurring banking operations, such as hedging volatility, software amortisation, and fair value adjustments, making it a more reliable basis for comparing earnings across the big four banks like NAB, CBA, ANZ, and WBC.
Multiply NAB's FY24 cash EPS of $2.292 by a sector-average PE of 18x (the upper end of the NAB, ANZ, and WBC peer range) to produce an estimated fair value of approximately $41.27, then compare that figure to the current market price of $37.37.
CBA trades at a forward PE of approximately 25.78x due to structural advantages including superior return on equity and dominant retail digital banking, which would inflate the sector average and produce a misleadingly high fair value estimate for NAB, ANZ, or WBC.
Experienced analysts cross-check PE results using price-to-book value (PBV), the dividend discount model (DDM) incorporating grossed-up franking credits, gross dividend yield, CET1 capital ratio, and return on equity (ROE) relative to cost of equity.


