
Westpac trades at a price-to-earnings ratio of roughly 18.7x. The sector average sits at approximately 18x. Run the arithmetic through a peer-adjusted model, and the implied price target lands at $34.12, a modest discount to the current share price of $35.84. By those numbers alone, the stock looks close to fair value, and many investors would move on to the next screen.
That single calculation, however, tells an investor almost nothing about what will actually drive returns from here. Australian bank shares, including the ASX’s four major lenders, remain among the most widely held equities in the country, prized for fully franked dividends and perceived stability. Yet the tools retail investors reach for first, PE ratios and dividend discount models, rest on assumptions that can unravel when the credit cycle turns, when the Reserve Bank of Australia (RBA) surprises, or when a bank’s strategy fails to deliver. With the RBA cash rate at 4.35% following a third hike in 2026, those assumptions are more fragile than they have been in years.
This guide explains what PE ratios and dividend discount models (DDM) can and cannot do, what macroeconomic and qualitative factors must sit alongside any model output, and how to think about franking credits properly. By the end, readers will have a practical framework for analysing any ASX bank stock rather than anchoring on a single number.
What PE ratios actually tell you about bank shares (and what they miss)
A PE ratio divides the share price by earnings per share, producing a multiple that can be compared against a sector average to flag relative cheapness or expensiveness. For Westpac, the inputs are straightforward: FY24 earnings per share of $1.92, a share price of $35.84, and a resulting PE of approximately 18.7x.
Compared to the sector average of roughly 18x, Westpac’s multiple suggests the stock trades at a slight premium. Applying the sector average to Westpac’s earnings produces an adjusted price target of $34.12. Data from GuruFocus, Yahoo Finance, and WiseSheets confirms the trailing PE sits in a range of 17.66x to 19.32x as of May 2026, depending on the source and the precise earnings window used.
| Metric | WBC | Sector Average |
|---|---|---|
| Earnings Per Share (FY24) | $1.92 | — |
| Share Price | $35.84 | — |
| Trailing PE | ~18.7x | ~18x |
| Sector-Adjusted Target | $34.12 | — |
The table looks clean. The problem is what it leaves out.
The three things PE cannot see
Loan-loss provision variability is the first blind spot. Credit charges are lumpy; they stay low when the economy is strong and spike during downturns. A PE calculated on benign-cycle earnings uses a denominator that may overstate sustainable profitability. A bank that looks cheap on today’s PE can become expensive quickly once credit losses normalise.
Regulatory capital constraints are the second. APRA requires Australian banks to hold prescribed levels of capital, which limits how much of reported earnings can be returned to shareholders. PE ignores this entirely, treating a dollar of earnings at a capital-constrained bank the same as a dollar at an unconstrained one.
One-off distortions are the third. Remediation costs, legal provisions, and write-backs inflate or deflate reported earnings without reflecting true recurring profitability. A PE built on a year that included a large write-back flatters the multiple; a PE built on a remediation year punishes it. Neither tells the investor what normalised earnings actually look like.
The deeper problem is structural: PE ratios mislead bank investors precisely because the earnings denominator is most flattering at the point in the cycle when underlying credit risk is highest, compressing provisioning charges and inflating reported profitability in ways that a single trailing multiple cannot reveal.
When big ASX news breaks, our subscribers know first
Why dividend discount models are more fragile than they appear
Banks pay dividends. They pay them regularly. For that reason, DDM feels like a natural fit: take the anticipated annual dividend, divide by the gap between the discount rate and the assumed dividend growth rate, and the model returns an implied fair value. Averaging across several scenarios can smooth the result.
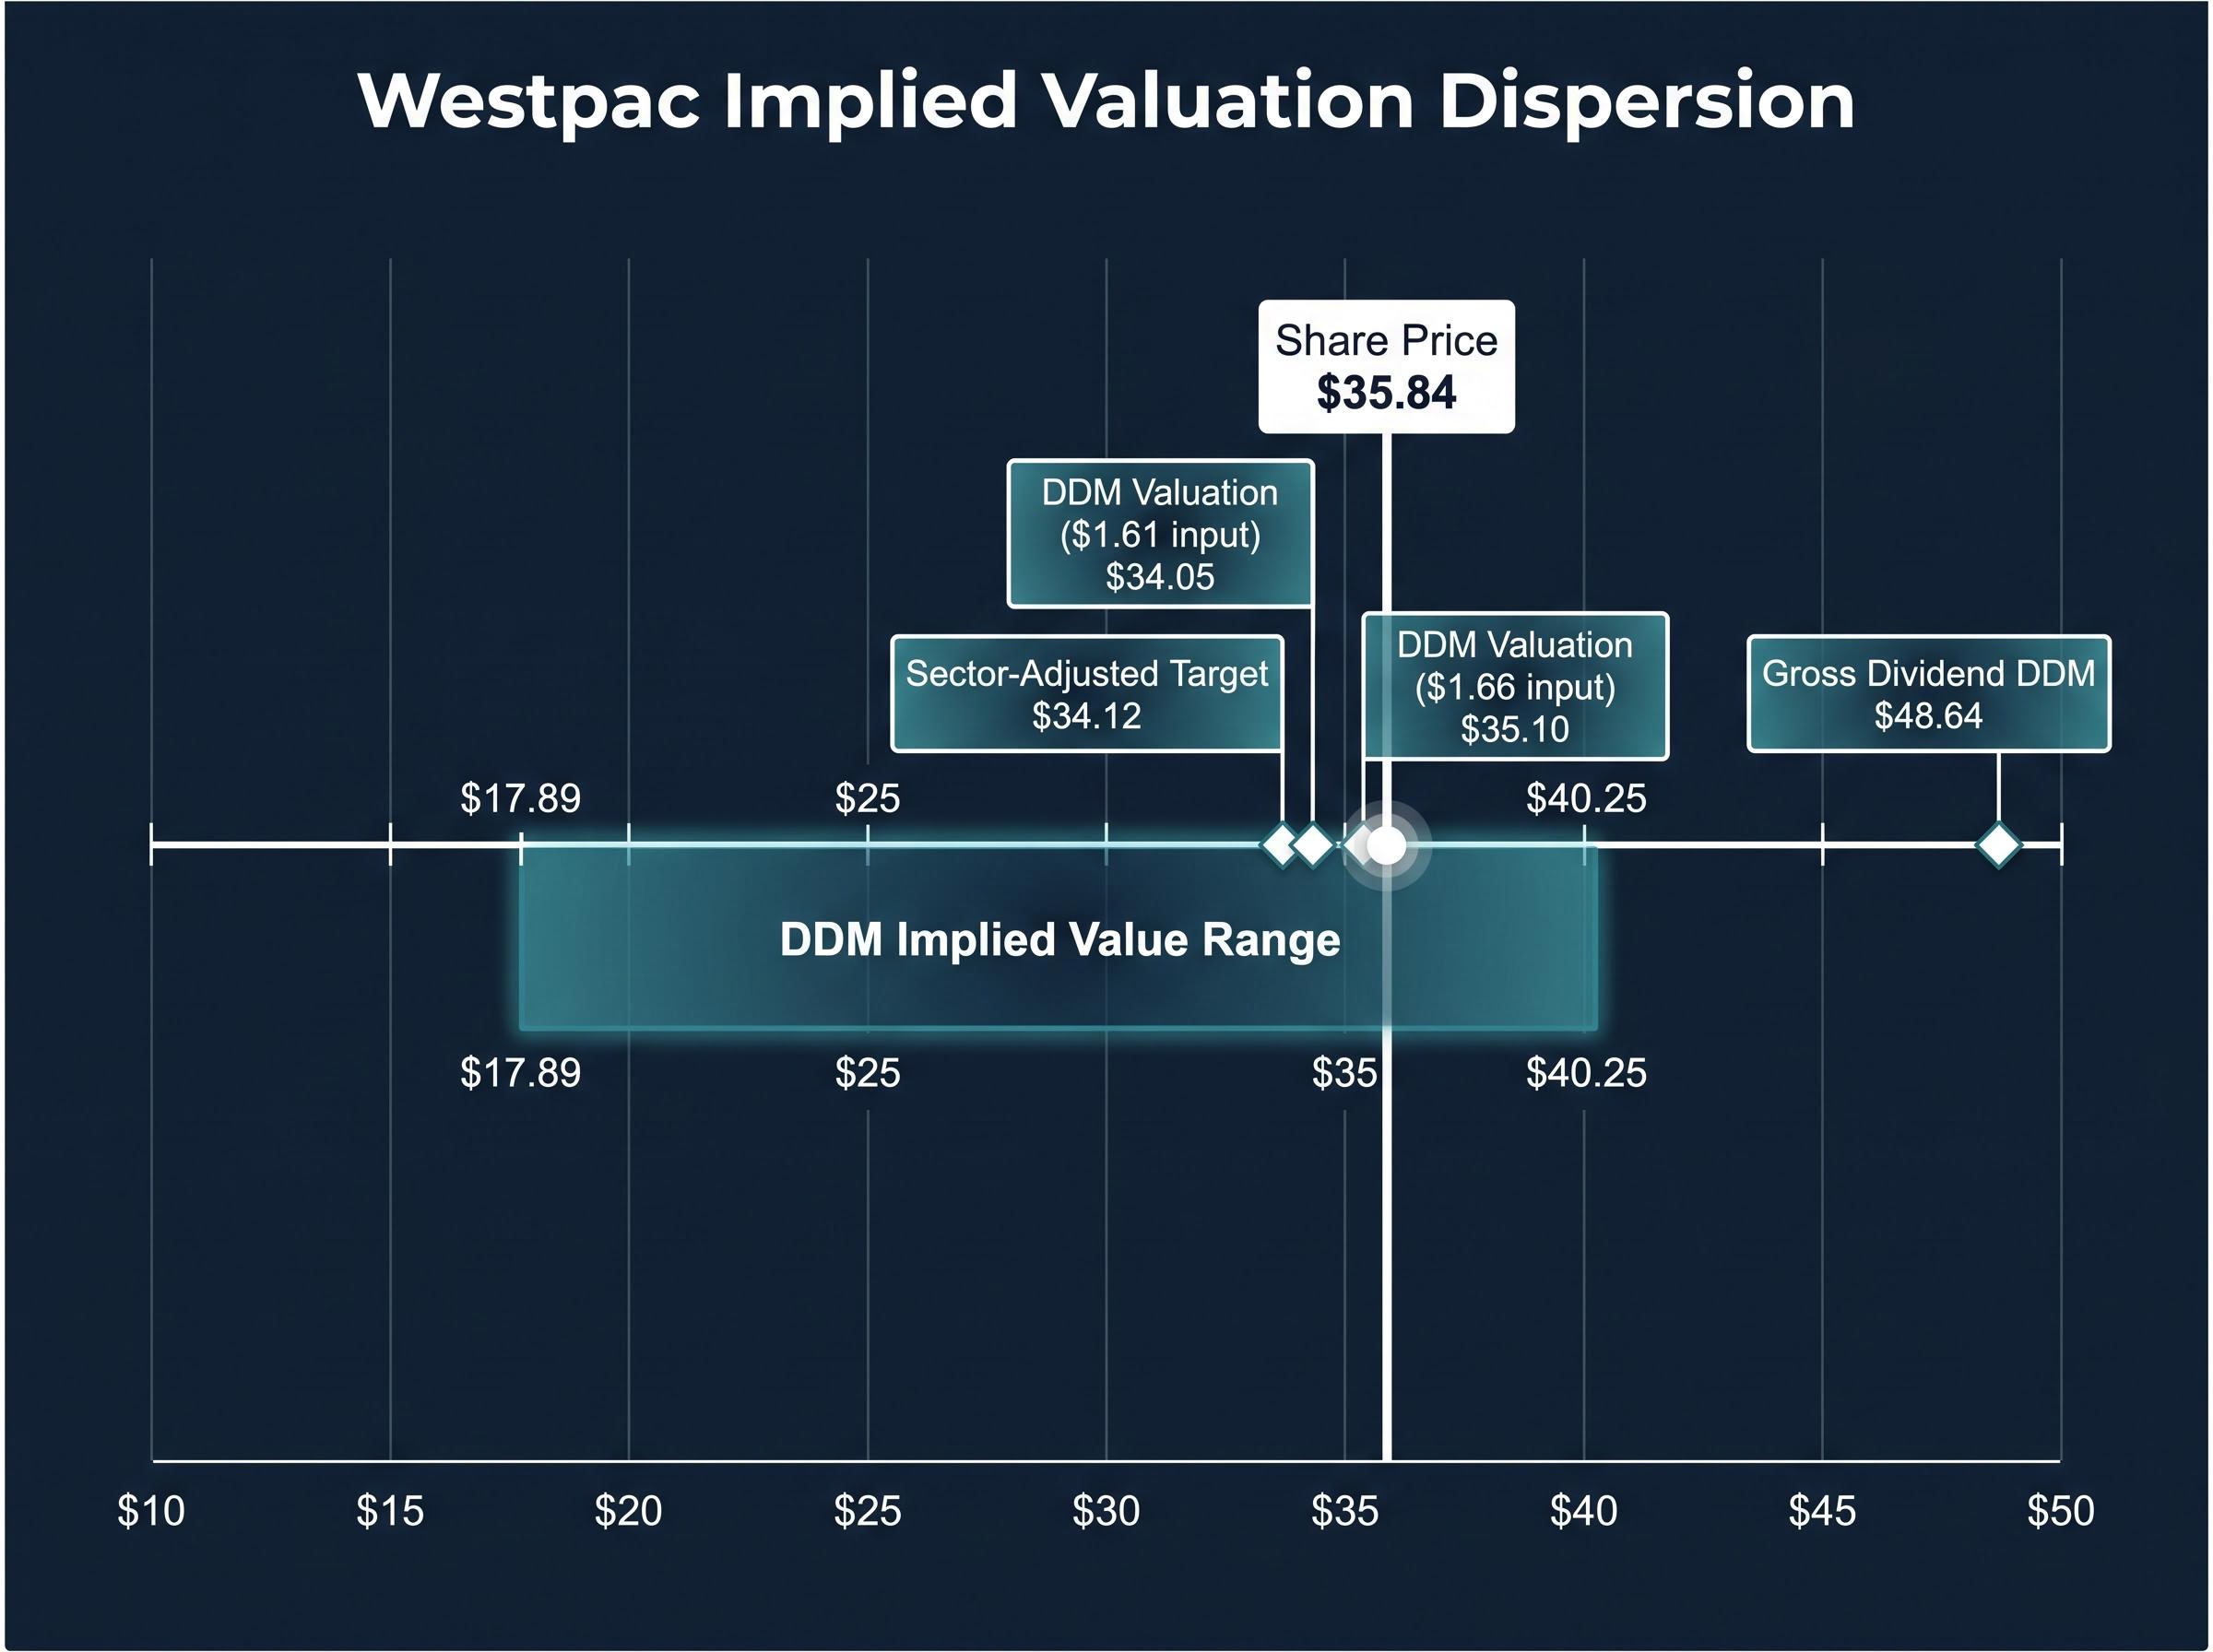
For Westpac, the base dividend input is $1.66 per share (with an alternative figure of $1.61 depending on the source). The central DDM valuation using $1.66 comes to approximately $35.10; using $1.61, it falls to roughly $34.05. Those figures sit close to the current share price and might suggest the stock is fairly valued.
The same Westpac dividend input of $1.66 per share produces implied valuations ranging from $17.89 (at an 11% discount rate and 2% growth assumption) to $40.25 (at lower rate and growth combinations). A swing of more than $20 on assumptions made before the model is even opened.
That range exposes the model’s fragility. Four structural limitations compound the problem:
- Pro-cyclical dividends. When arrears rise or capital rules tighten, banks cut dividends faster than DDM models anticipate, causing the model to overvalue banks at cycle peaks.
- Sensitivity to small assumption changes. A half-percentage-point shift in the discount rate or growth rate can move the output by several dollars, yet neither input can be estimated with that precision.
- Payout ratio instability. Banks adjust payout ratios in response to regulatory cycles, buyback programmes, and capital management strategies. A DDM that treats today’s payout ratio as permanent will misprice the dividend stream.
- Failure to capture non-dividend value creation. Banks investing heavily in digital platforms and technology may suppress near-term dividends while building long-run franchise value. A DDM focused solely on cash dividends can undervalue these reinvestment decisions.
When franking credits are included, the gross dividend rises to $2.30 per share, producing a DDM valuation of $48.64. The gap between that figure and the cash-only DDM output illustrates how much the model’s answer depends on which dividend definition the investor selects.
The macroeconomic layer no model bakes in automatically
Neither PE nor DDM automatically updates when the RBA moves, when property prices shift, or when unemployment ticks higher. These variables feed into bank earnings through distinct channels, and each one can move the share price before any analyst revises a published target.
The scale of this sensitivity illustrates why macro assumptions drive bank valuations more than most investors appreciate: a single NAB model built with reasonable inputs produces a share price range from $19.00 to $85.50 depending entirely on the growth and discount rate assumptions selected before the spreadsheet is opened.
- RBA cash rate environment: The May 2026 hike to 4.35%, the third of the year, directly affects net interest margins and the rate-path assumptions embedded in every bank earnings model. When actual RBA decisions diverge from consensus, bank shares move sharply, regardless of what static valuation models imply.
- Residential property prices: CoreLogic data shows national dwelling values rose approximately 8.6% across full-year 2025, but the pace has moderated to roughly 0.3% month-on-month as of April 2026. Still-solid prices support loss-given-default assumptions by keeping collateral values elevated, but slowing growth is insufficient to offset volume pressure from high mortgage rates and intense refinancing competition.
- Labour market and consumer confidence: The Westpac-Melbourne Institute Consumer Sentiment Index remained below its long-run average through 2024, described by Westpac as consistent with recession-like pessimism despite the absence of a technical recession. Weak sentiment dampens demand for new credit, increases the propensity to repay debt faster, and makes households more sensitive to further RBA tightening.
What rising arrears signal before analysts update their models
Mortgage arrears have been rising from very low post-pandemic bases, according to the RBA Financial Stability Review and APRA monthly banking statistics. The pattern is consistent: arrears increase before formal credit charge upgrades appear in analyst models, causing share prices to de-rate ahead of published target revisions.
The RBA Financial Stability Review published in March 2026 documents the precise arrears trajectory the article references, confirming that mortgage stress has been rising from post-pandemic lows across Australian households while overall bank sector capital buffers remain above regulatory minimums.
For investors monitoring bank valuations directly, APRA monthly banking statistics and the RBA Financial Stability Review are the primary data sources to watch. A bank trading below its sector-average PE may not be cheap if arrears data suggests credit charges are about to reset higher.
Reading a bank’s growth strategy as a valuation input
Quantitative models capture what a bank has earned. They say little about what a bank is building. Each of the four major ASX banks is pursuing a distinct strategy, and each one carries valuation implications that sit outside the PE and DDM frameworks.
| Bank | Core Strategy Focus | Key Valuation Implication |
|---|---|---|
| CBA | Digital ecosystem: CommBank app, data analytics, adjacent payment services | Premium PE may already price in digital leadership; downside risk if execution falters |
| WBC | Simplify and digitise: platform consolidation, automated lending | Discount to CBA requires sustained execution evidence to narrow |
| NAB | Business banking franchise; above-system lending growth when confidence is strong | Higher earnings cyclicality; more exposed if the business cycle turns |
| ANZ | Suncorp acquisition (completed July 2024); institutional banking and technology modernisation | Uncertainty discount removed; integration execution risk now the key variable |
These strategic choices affect capital requirements, risk mix, and long-run earnings power in ways that neither PE nor DDM captures. CBA’s heavy technology investment underpins its premium multiple, but some analysts argue the market has already fully priced that leadership in. WBC’s simplification programme needs evidence that technology spending is lifting return on equity before the discount to CBA narrows materially. NAB’s business lending skew offers above-system growth when confidence is strong but amplifies earnings volatility. ANZ’s completed Suncorp integration is tracking ahead of synergy expectations as of May 2026, but the execution risks of a large bank merger remain.
Investors should read ASX investor day presentations and strategy updates alongside quantitative models. Growth strategy is not a supplement to be skimmed after the numbers are done; it is a valuation input of comparable weight.
Franking credits and what the gross yield really means for Australian investors
Most Australian bank dividends are fully franked, and as of May 2026, the four major banks continue to attach full franking credits to their distributions. For many investors, the relevant yield is the grossed-up figure, not the headline cash yield.
The calculation follows three steps:
- Identify the cash dividend yield on the stock (for example, 5%).
- Divide by one minus the corporate tax rate: 5% ÷ (1 – 0.30) = 5% ÷ 0.70.
- The result is the grossed-up yield: 7.14%.
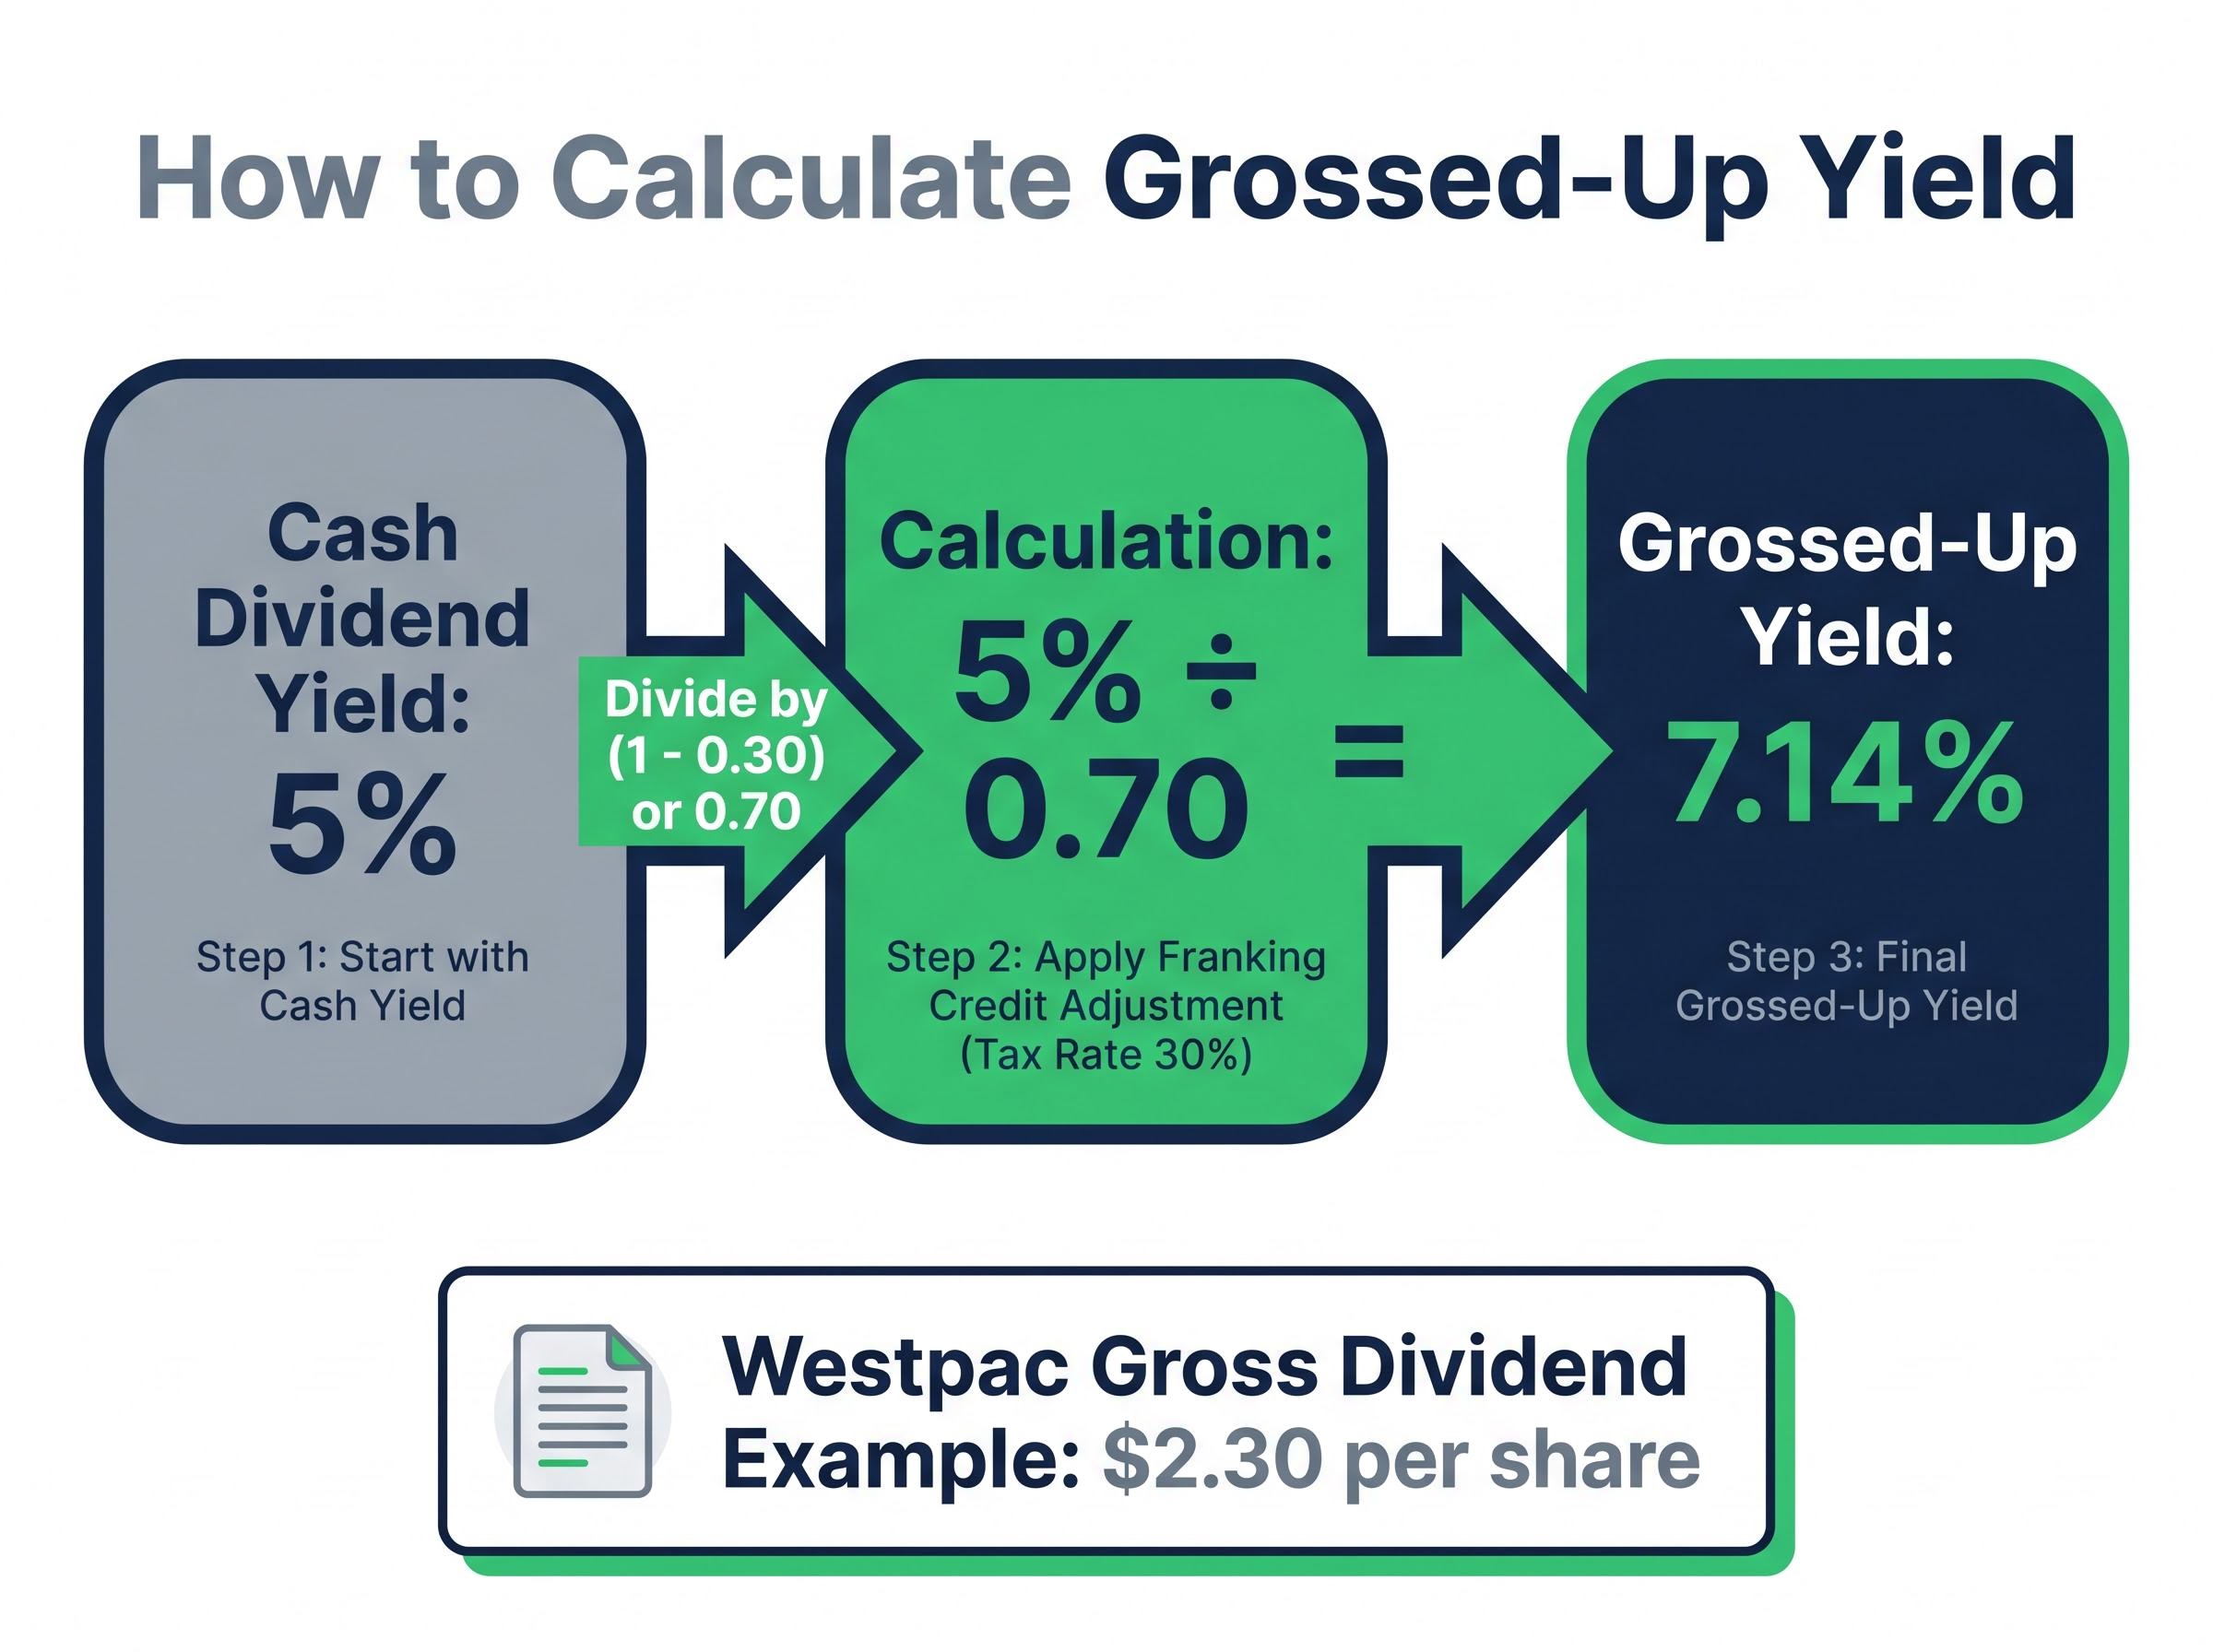
A 5% fully franked cash yield equals a grossed-up yield of 7.14% for investors who can access franking credit refunds.
That uplift is meaningful, but it does not apply equally to all investors:
- SMSF members in pension phase and low-tax individuals receive the greatest benefit, as refundable franking credits effectively increase cash income.
- Investors at the 45% marginal tax rate do not receive the full benefit of franking credits, because the credit offsets only a portion of their total tax liability.
There is a counterbalancing caution. A high gross yield can signal that the market has concerns about earnings sustainability or capital adequacy; the yield is high precisely because the share price is depressed. Intelligent Investor commentary has repeatedly warned against chasing headline yield without assessing the payout ratio, capital position, and long-run earning power underneath it. For Westpac, the gross dividend figure (cash plus franking credits) is $2.30 per share, which produces a DDM valuation of $48.64 when applied, a figure materially above the cash-only output and one that illustrates how franking credits can distort model results if not treated carefully.
For SMSF trustees and income-focused investors wanting to model how franking credits interact with dividend discount model inputs across different tax scenarios, our dedicated guide to grossed-up dividend yield calculations works through the 30/70 formula with NAB as a live example, showing how the choice between cash and grossed-up dividend inputs can shift a DDM output by more than 40%.
From numbers to conviction: sequencing the work of serious bank analysis
PE ratios frame the conversation. DDM tests dividend sustainability under different assumptions. Neither is a conclusion. According to industry research, comprehensive analysis of a single bank’s shares may involve upwards of 100 hours of qualitative research before a conviction-level position is justified.
That figure is not meant to discourage. It is meant to sequence the work. A practical framework for readers:
- Quantitative baseline. Run the PE and DDM calculations to establish a valuation range. Understand what assumptions those numbers embed.
- Macro overlay. Layer in the RBA rate path, property price trends, unemployment, and consumer confidence. Use specific data sources for each: the RBA’s monetary policy statements, CoreLogic’s Home Value Index, the ABS Labour Force Australia monthly release, and the Westpac-Melbourne Institute Consumer Sentiment Index.
- Qualitative strategy review. Read the bank’s ASX investor day presentations, results commentary, and strategy updates. Assess whether the strategy is working, not just what it promises.
- Gross yield assessment. Calculate the grossed-up yield in the context of the bank’s capital position and payout ratio sustainability. A high gross yield is only valuable if the earnings that fund it are durable.
The primary data sources investors should bookmark and monitor directly:
- RBA Financial Stability Review
- ABS Labour Force Australia monthly release
- CoreLogic Home Value Index
- APRA monthly banking statistics
- Westpac-Melbourne Institute Consumer Sentiment Index
- Individual bank ASX announcements and investor day presentations
Knowing the sequence prevents investors from stopping at the number that confirms what they already wanted to believe.
For investors comparing ASX bank shares against term deposits or international equity income alternatives, our full explainer on bank share income returns examines the oligopoly structure that sustains dividend capacity, the 1H 2026 profit data across all four major banks, and why the franking advantage is widest for pension-phase SMSF members but diminishes materially for investors on high marginal rates.
The model is the map, not the territory
PE ratios and DDM are indispensable tools for framing ASX bank valuations. They organise the available data into a structure that makes comparison possible. They are also built on assumptions that the macro environment and each bank’s strategic execution will either validate or invalidate over time.
Investors who treat a quantitative output as a conclusion rather than a starting point are taking on risk that their model has already assumed away. With the RBA at 4.35% and credit conditions tightening from benign bases, the gap between model assumptions and real-world outcomes is likely to be wider than it was during the post-COVID period of suppressed rates and strong collateral values.
The numbers open the conversation. The macro overlay, the strategy review, and the franking credit assessment make it worth having.
This article is for informational purposes only and should not be considered financial advice. Investors should conduct their own research and consult with financial professionals before making investment decisions. Past performance does not guarantee future results. Financial projections are subject to market conditions and various risk factors.
—