A rotating market is not a signal to step aside. Rotation means money is changing seats inside the stock market, not leaving it. The stocks being dumped on the way out are often where patient option sellers get paid to wait for a better entry price.
The headline valuation is less dramatic than you might expect. As of 6 October 2026, the S&P 500 trades at about 19x forward earnings, roughly in line with its five-year average. The real discounts sit in narrower pockets such as small-cap value.
That gap creates both an opportunity and a trap. You can build positions in de-rated stocks on your own terms, or you can mistake “cheap” for “safe” and end up holding a falling company.
Here is a repeatable structure for doing the first: the wheel strategy, an options approach that pays you income while you wait to buy and sell, paired with a daily execution routine built on the opening and closing candles.
Is the market really rotating, and where is the value?
If you feel that everything is either too expensive or falling apart, the fund-flow data tells a calmer story. Investors are not fleeing equities. They are moving money from one corner to another.
Where the money is moving
Morningstar recorded nearly $100 billion of outflows from US equity funds over the five months to September 2025, with large growth funds losing more than $6 billion in September alone. That money did not vanish. Technology sector funds took in $5.4 billion and industrials $3.7 billion that month, together more than 70% of the $12.4 billion that flowed into sector funds.
International equity funds attracted over $40 billion from May onwards. BlackRock found sector allocations made up nearly 10% of equity ETF flows in 2025, more than double the 4% share in 2024.
The 2026 version of this shift has been capital leaving AI stocks for energy, industrials and defensives, with specific ETF levels now marking whether the reallocation has staying power.

Anarie Band, the trader whose framework shapes this guide, describes the pattern simply: sellers use high prices to exit, while buyers pick up deep dips. His advice is to buy dips in the strongest names and sell rips in the weakest.
Where the discounts actually sit
Band has described valuations as the cheapest in 15 to 20 years. The broad index does not support that claim.
| Segment | Measure | Reading | Source/Date |
|---|---|---|---|
| S&P 500 cap-weighted | Forward P/E | ~19x vs five-year mean of 19.8x | Blockonomi, 6 Oct 2026 |
| Median S&P 500 stock | Forward P/E | 18.9x vs long-term median of 16.3x | DWS, 30 Apr 2026 |
| Russell 2000 vs mega caps | One-year forward P/E discount | Roughly 30% cheaper | FTSE Russell, 28 Sep 2026 |
| Russell 2000 Value | P/E ex-negative earnings | About 14.82x | Index factsheet, late Sep 2026 |
A forward price-to-earnings (P/E) ratio compares a share price to expected earnings over the next year. The index sits near normal levels, and the median stock still looks pricier than its own history.
The value is selective, not universal. The index multiple cannot tell you whether the stock you are eyeing is a bargain, so you have to verify “cheap” one company at a time.
When big ASX news breaks, our subscribers know first
How does the wheel strategy work, step by step?
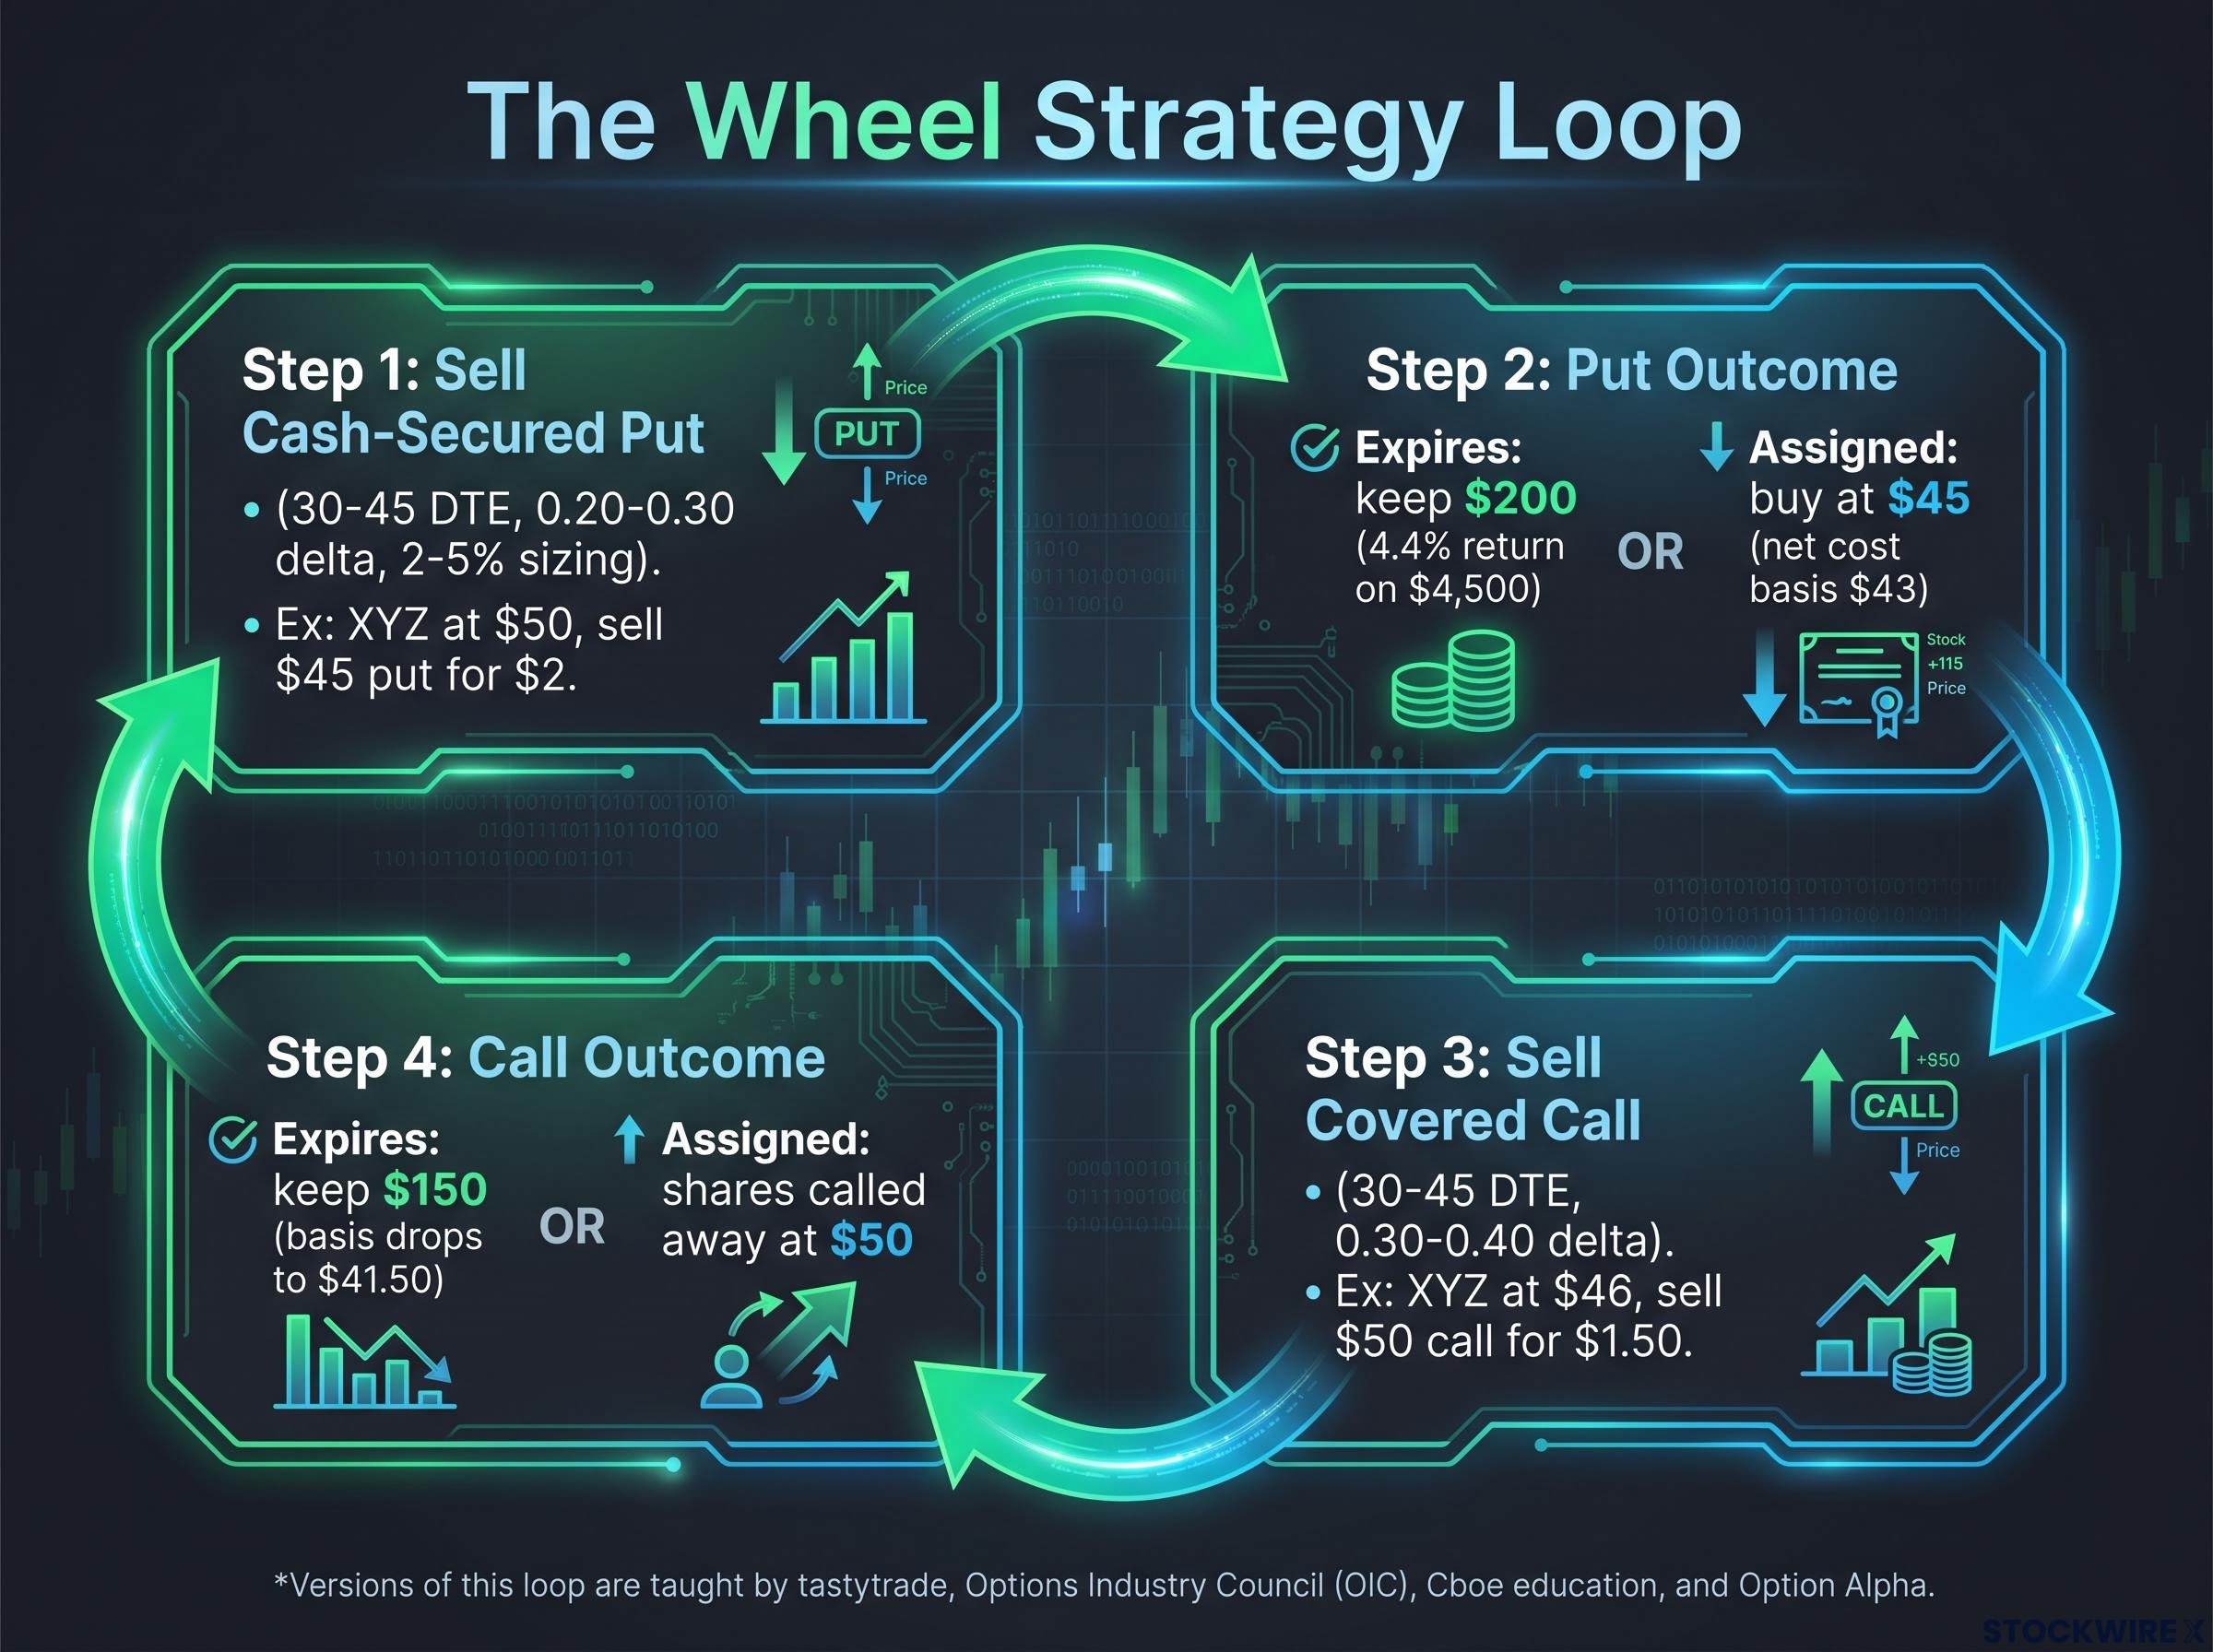
The idea is simple: you get paid to wait for a price you like, then get paid again to wait for a price you would sell at. The cycle runs in four stages:
- Sell a cash-secured put on a stock you would happily own.
- The put either expires worthless (you keep the premium) or you are assigned shares.
- If assigned, sell a covered call against those shares.
- The call either expires (you keep the premium and repeat) or your shares are called away.
Educators including tastytrade, the Options Industry Council (OIC), Cboe education and Option Alpha all teach versions of this loop.
Leg one: the cash-secured put
A put option gives the buyer the right to sell you 100 shares at a set price (the strike). Selling one obliges you to buy if the price falls below that strike, so you hold the full cash: strike x 100 per contract.
Band favours far out-of-the-money puts, meaning strikes well below today’s price. You collect less premium, but assignment is less likely, and when it happens you are buying on genuine weakness. Many educators suggest a delta of about 0.20-0.30 (delta roughly approximates the odds of finishing in the money) with 30-45 days to expiry (DTE), and sizing at 2-5% of your portfolio per stock.
Say XYZ trades at $50. You sell a $45 put with 30 days left for $2. If XYZ stays above $45, you keep $200, a 4.4% return on $4,500 of secured cash over 30 days, before compounding.
Net cost basis If XYZ falls below $45, you buy 100 shares at $45. The $2 premium lowers your effective cost to $43 per share.
Leg two: the covered call
Now you own 100 shares with a $43 basis, and XYZ sits at $46. You sell a $50 call for $1.50, ideally at a delta of about 0.30-0.40. Sell only one call per 100 shares, so you never write a naked call with no shares behind it.
If XYZ stays under $50, you keep $150 and your basis falls to $41.50. If it rises above $50, your shares are sold at $50, locking in the gain plus every premium collected, but nothing above that.
A lower cost basis feels like progress, but it does not reduce your equity exposure; the premium is a small cushion, and the wheel still carries nearly the full downside of owning the stock.
| Leg | Typical strike/delta | DTE | Outcome if favourable | Outcome if not |
|---|---|---|---|---|
| Cash-secured put | Below market, 0.20-0.30 | 30-45 | Expires; keep premium | Assigned shares at strike |
| Covered call | Above basis, 0.30-0.40 | 30-45 | Expires; keep premium, lower basis | Shares called away; upside capped |
You are trading unlimited upside for paid patience. That makes the wheel suited to stocks you are content to hold, not ones you merely hope will bounce.
What stocks belong in a rotation-focused wheel, and what are the traps?
Every number above assumes XYZ is a decent business. The wheel is only as good as the stock being wheeled, and price alone tells you very little.
The difference comes down to the type of rotation. Cyclical rotation is a shorter-term shift driven by rates, inflation and growth, where sound companies fall out of favour and later recover. Structural rotation is a multi-year leadership change driven by deep economic or policy shifts, and stocks caught on the wrong side can stay cheap for years.
Cyclical rotation tends to follow the business cycle, so a sector rotation strategy that tracks early, mid, late and recession phases helps you judge whether a de-rated sector is temporarily out of favour or structurally challenged.
Before you sell a put, run the candidate through a short filter:
- Earnings: profitable now, not just promising profits later
- Cash flow: positive operating cash flow
- Balance sheet: debt the company can carry through a downturn
- Option liquidity: active options with tight bid-ask spreads
- Catalyst calendar: known earnings and ex-dividend dates
Spreads matter more than beginners expect. Beaten-down small caps often have wider gaps between buy and sell prices, which quietly eats your premium.
History offers patterns worth recognising, not predictions:
- 2000-2003: Money left unprofitable growth for value; profitable, de-rated cyclicals recovered well.
- 2009-2011: Post-crisis survivors with stabilised balance sheets rewarded put sellers.
- Early 2016: Quality energy and materials names bought near the low benefited from reflation.
- 2020-2021: Reopening rotation let put sellers enter travel and financials at depressed prices.
- 2022-2023: Rate hikes lifted energy and value while tech’s long-term role stayed intact.
The common thread is quality bought during temporary weakness. Long-run index research points the same way.
What the Cboe indices show The S&P 500 BuyWrite (BXM) has delivered lower volatility and drawdowns with comparable or slightly lower returns. The PutWrite (PUT) has produced similar or modestly higher long-run returns with much lower volatility. Both lag strong bull markets, and neither is immune to a crash.
When a put is assigned on a deteriorating company, your income trade becomes a losing stock position. The quality filter protects you far more than the premium does.
How do opening and closing candles sharpen entries, targets and trims?
Open any intraday chart and two zones stand out: the first stretch after the bell and the final stretch before it. Band treats both as daily reference levels.
The opening candle covers the first 30-60 minutes from 9:30 a.m. ET. The closing candle covers roughly the final 30-60 minutes, from about 3:00 or 3:30 to 4:00 p.m. ET. Band’s stated window of 3:30-4:30 runs past the 4:00 p.m. close, so treat it as the session’s last half hour to hour.
Price clusters here for structural reasons. The opening auction absorbs overnight news, earnings and economic data, often producing gaps. The closing auction concentrates index, mutual fund and ETF flows because many benchmarks use closing prices, and studies typically find intraday volatility forms a U-shape, highest at either end of the day.
Using the candles to pick put strikes
On a beaten-down stock, mark the opening-range low. Placing your put strike slightly below it improves the odds the option stays out of the money while still entering on genuine capitulation. Resist moving the strike higher just to chase a fatter premium.
Band adds a warning sign: if price opens below the opening or closing candle ranges, the first bounce is usually a short aimed at the next candle level. That rule is built for directional traders. For you, it signals weakness is still in control, so it is a reason to wait.
Using the candles to trim and sell calls
Closing-range highs make natural covered-call strikes or trim zones, because exits line up with heavy institutional liquidity. Band also draws support lines from the prior day’s closing candle as levels to take gains.
| Level | Where it comes from | Wheel use | Caution |
|---|---|---|---|
| Opening-range low | First 30-60 minutes | Set put strike slightly below | Gaps can slice through |
| Closing-range high | Final 30-60 minutes | Covered-call strike or trim | Strong trends overshoot |
| Prior-close support | Previous day’s closing candle | Trim gains | Headline-driven whipsaws |
A daily routine keeps this practical:
- Mark the prior day’s closing candle range.
- Mark today’s opening range.
- Check where price sits against both.
- Choose your put strike or trim level.
- Confirm against trend, volume and fundamentals.
Supporters argue these levels work because so many traders watch them. Sceptics counter that open and close volatility is often noise, prone to false breakouts. Treat the candles as timing tools for trades you already believe in, not a substitute for stock selection.
What can go wrong, and how do you manage the downside?
A short put carries almost the same downside as owning the stock. Once you accept that, the risks become manageable rather than frightening.
The Characteristics and Risks of Standardized Options disclosure document, which every US options investor must receive, confirms that a short put carries obligations close to owning the stock, so you should size each contract as if assignment is certain.
- Crash and gap risk: Premium cannot offset a collapsing share price. Avoid holding puts through earnings on names you cannot afford to own.
- Value traps: Assignment on a deteriorating business locks in losses. Apply the quality filter first.
- Capped upside: Strong rallies leave you behind, the “picking up pennies in front of a steamroller” critique. Wheel only stocks where income matters more to you than a breakout.
- Early assignment: Deep in-the-money calls may be exercised before ex-dividend dates, costing you the dividend. Check the calendar.
- Capital and margin: Securing puts ties up cash, and margin-funded put selling magnifies drawdowns. Never lever the put leg.
- US tax: Premiums are generally short-term capital gains, assignment on a call counts as a sale, and frequent rolling creates many taxable events. Speak to a tax professional about your situation.
Implied volatility, the market’s expectation of future price swings, tends to rise after a sharp drop. New premiums look richer, but they rarely repair the damage already done.
The one rule to keep: Size every put as if assignment is certain.
Before each trade, run through this checklist:
- Would I own this company at the strike for a year?
- Is cash set aside for full assignment?
- Are earnings or ex-dividend dates inside the expiry window?
- Is the position within 2-5% of my portfolio?
- Where will I stop and reassess if price breaks lower?
Band expects plenty of opportunities over the next couple of months. That is one trader’s view, not a forecast to build your plans around. Past performance does not guarantee future results, and these statements are speculative and subject to change.
Turning the rotation into a repeatable routine
Three pieces now fit together. Value is selective, so you choose quality names in temporarily de-rated sectors. The wheel gives you a defined way to enter and exit while collecting income, and the opening and closing candles sharpen the timing.
With the S&P 500 near its long-run multiple, a broad bargain hunt will not deliver the edge. Your discipline in picking stocks, sizing positions and placing strikes will.
Your next step is modest: paper-trade one full cycle on a quality, de-rated stock before committing real money. A disciplined process will serve you better than a clever call.
This article is for informational purposes only and should not be considered financial advice. Investors should conduct their own research and consult with financial professionals before making investment decisions.