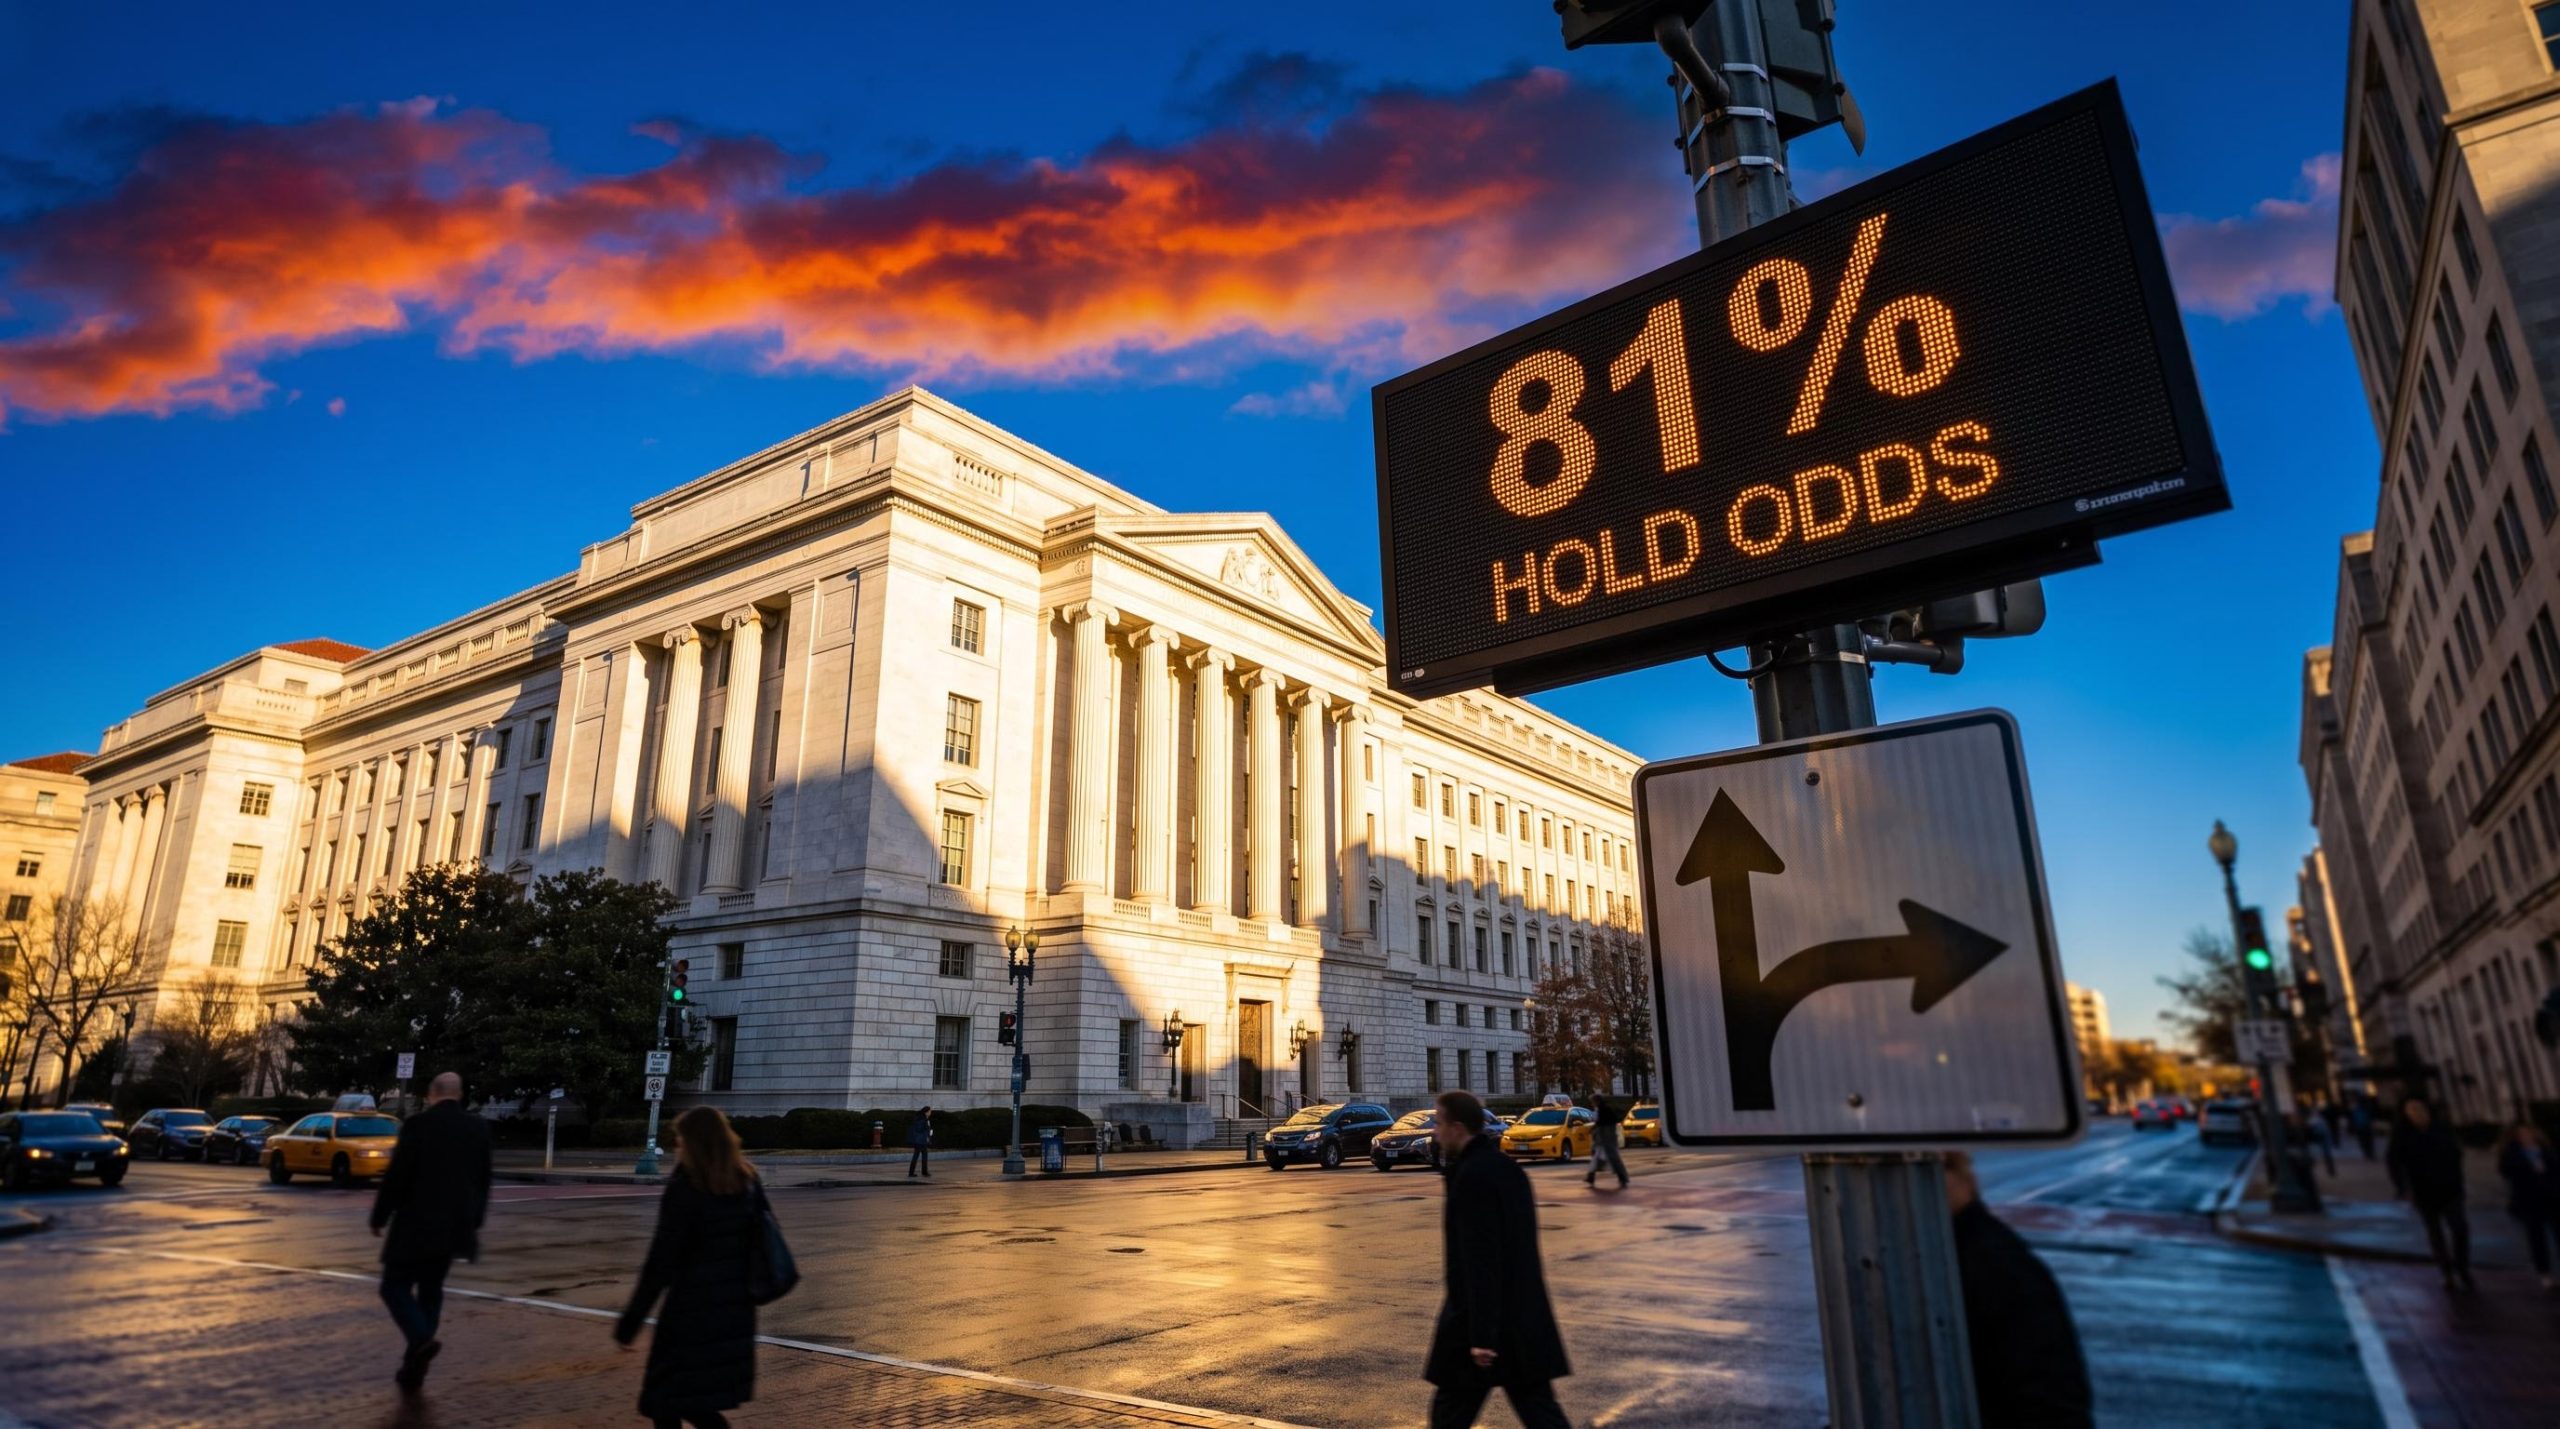
The Federal Reserve’s September meeting minutes, released Wednesday, show most officials still expect at least one more rate hike before the end of 2026. Over the same period, CME FedWatch has put the odds of a hold at the 27-28 October meeting near 81%. The Fed rate hike outlook is now split between what policymakers projected and what traders are paying for.
The gap follows a decisive move. On 16 September, the Federal Open Market Committee (FOMC) voted 12-0 to raise the federal funds target range by 25 basis points to 3.75-4.00%. A basis point is one hundredth of a percentage point. It was the Fed’s first increase in more than three years.
So which reading is likely to prove right? Guessing wrong matters, because the answer flows through to bond yields, mortgage rates and savings returns.
Why are 16 of 18 officials projecting another hike while markets bet on a pause?
Put the two signals side by side. The dot plot is a chart showing where each official expects interest rates to end the year. It places the median end-2026 rate at 4.125%, one more quarter-point step above today’s 3.75-4.00% range. Futures traders are pricing roughly a one-in-five chance of that step arriving in October.
Futures pricing reflects a risk-weighted distribution of outcomes rather than one baseline view, which helps explain why traders can sit well away from the committee median without being irrational.
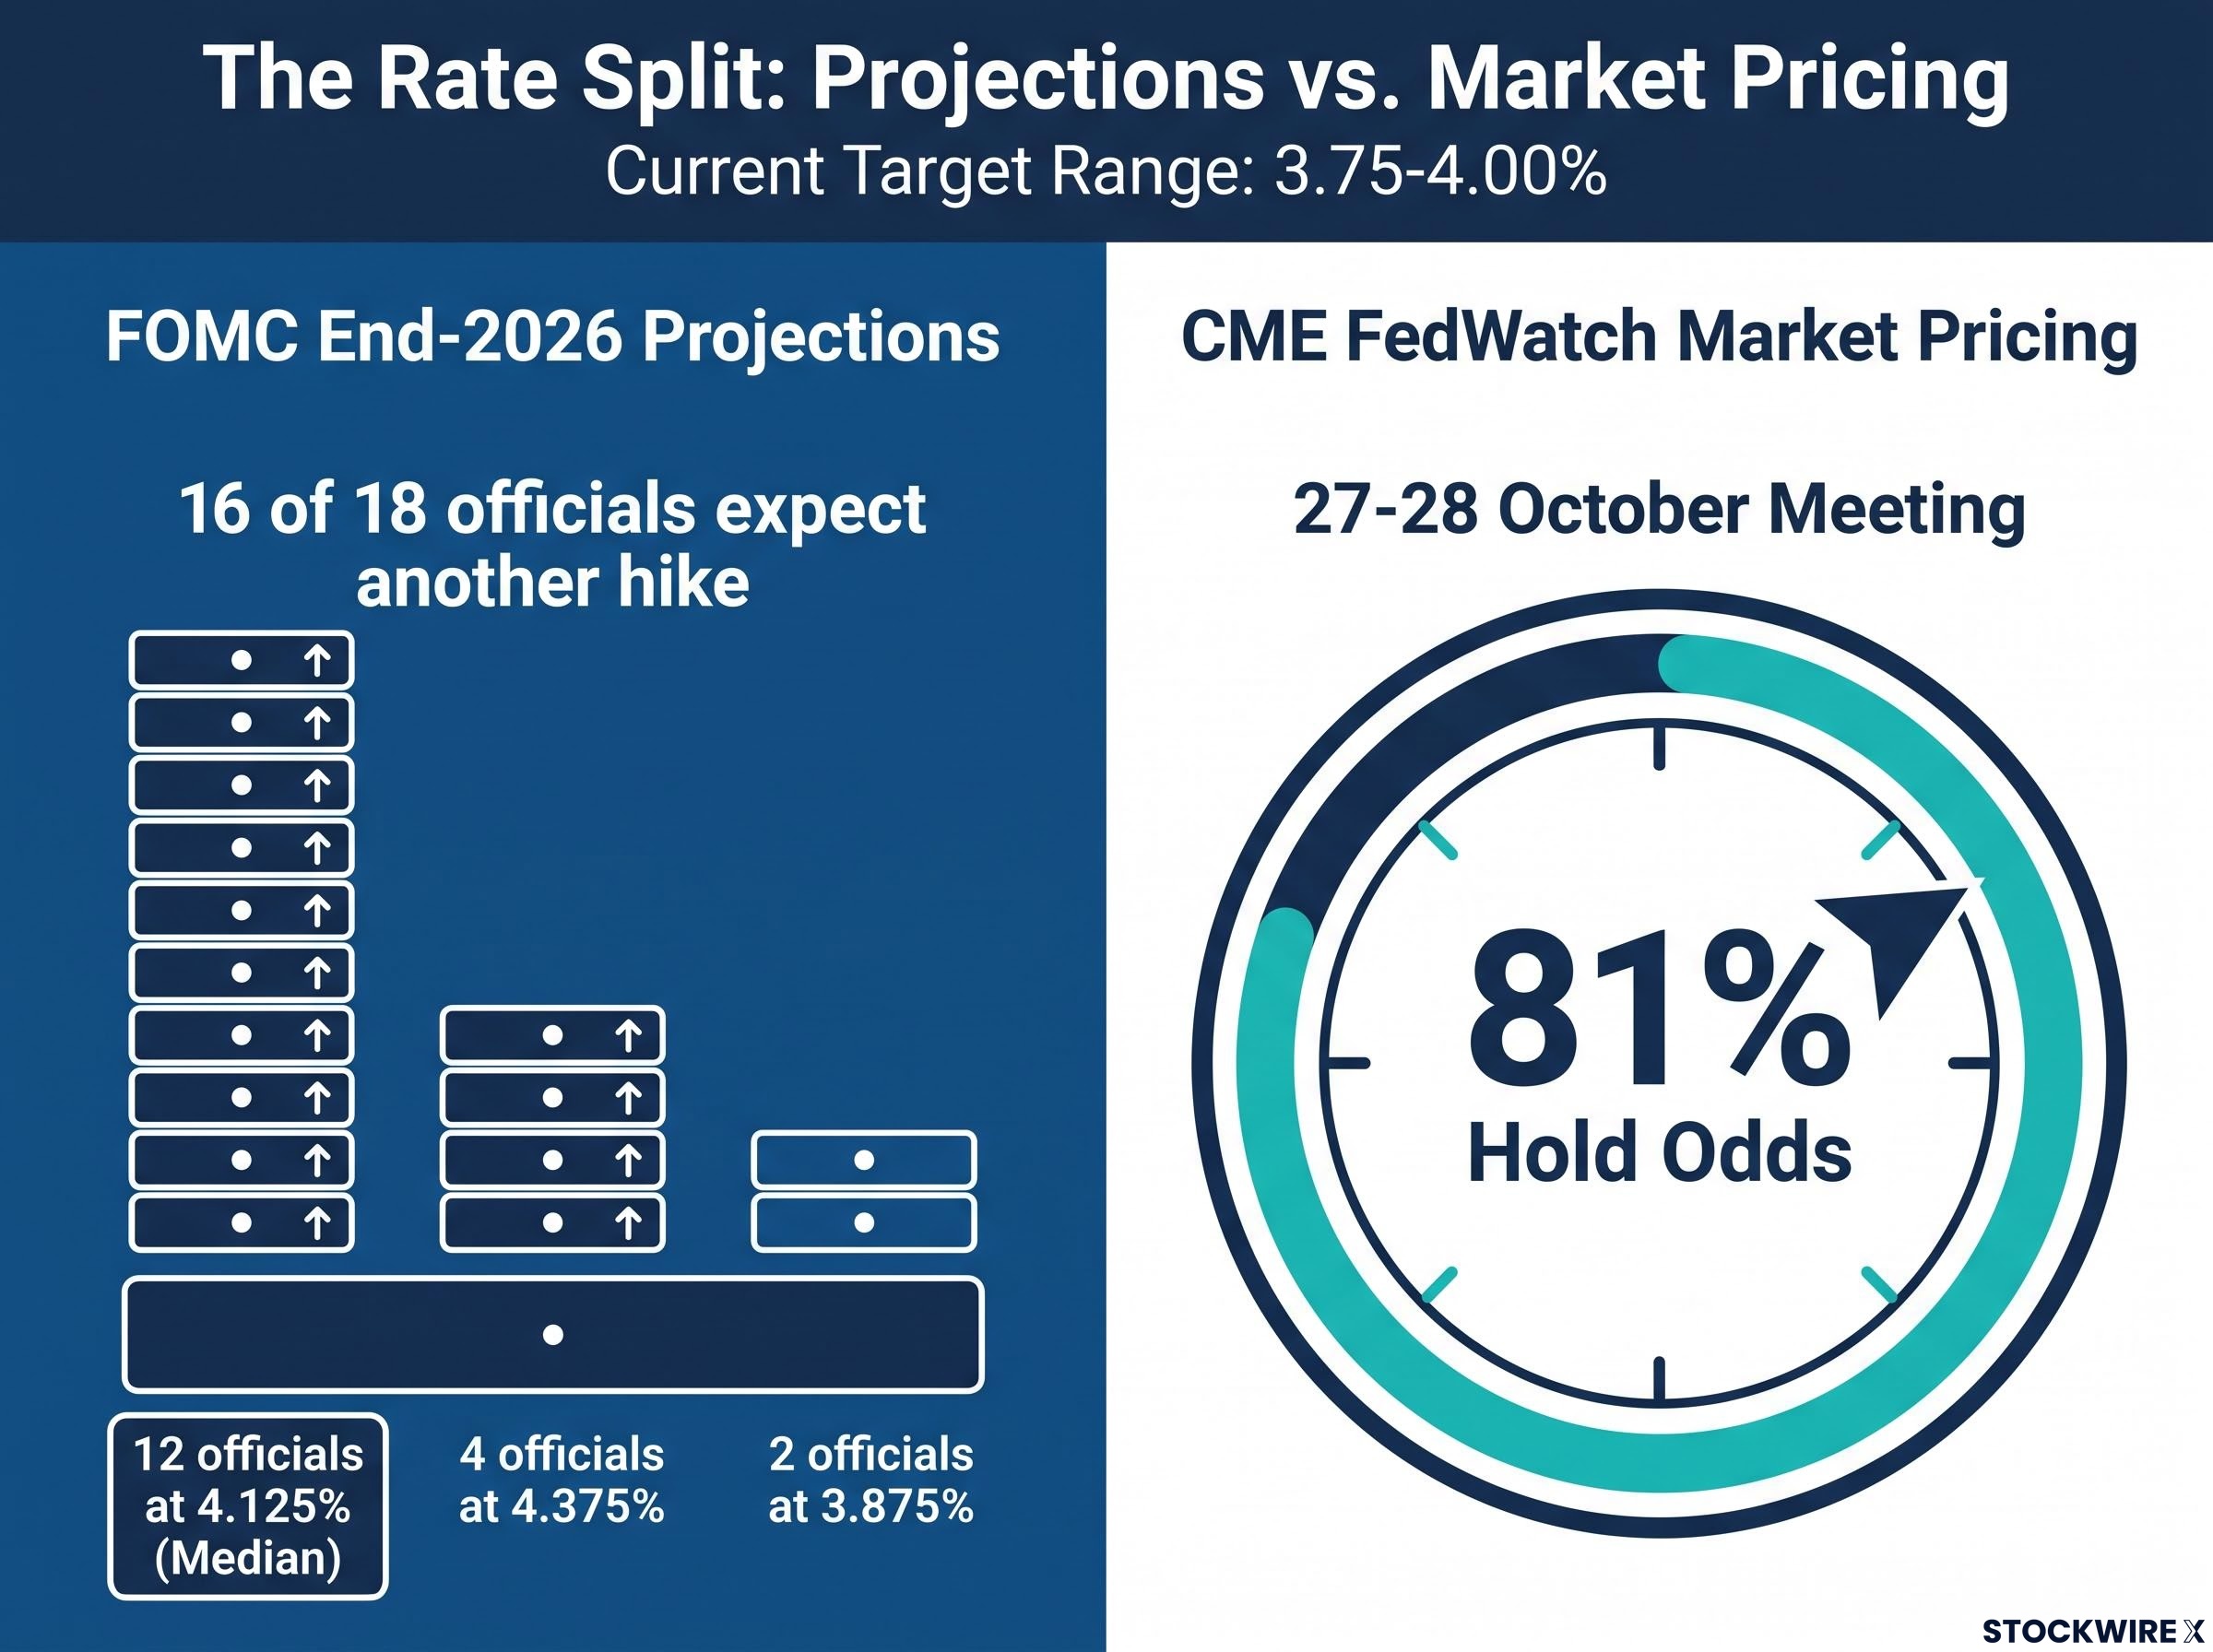
The detail behind the median is lopsided. Sixteen of 18 officials expect at least one more hike: twelve sit at 4.125%, four at 4.375%, and only two at 3.875%.
| Source | Reading | Timeframe |
|---|---|---|
| FOMC dot plot median | 4.125% end-2026 rate | Set mid-September 2026 |
| CME FedWatch, October meeting | Near 81% hold odds | 7 October 2026 |
| FedWatch one month earlier | About 54% hold odds (Phemex reported 54.2% hike odds on 23 September) | Early-to-late September 2026 |
The two readings are not as contradictory as they look. The projections were locked in during mid-September, before softer inflation figures and a weak jobs report arrived. The market has repriced on that data, and the dots have not had a chance to catch up.
Interpretation is also harder than usual. Chair Kevin Warsh submitted no dot for the second consecutive projection round, a point J.P. Morgan Asset Management highlighted. That leaves investors reading his intent from the committee’s aggregate, which adds noise to every signal.
The minutes, as reported by Investing.com, confirm that most policymakers still lean towards another increase this year. A pause in October would not mean the Fed has dropped that bias. Treat the dot plot as the ceiling scenario and the market price as the near-term base case.
Which data and Fed speeches pulled hike odds down so fast?
The repricing happened in steps, and each one was tied to a specific release or speech.
What the data said
Three prints reshaped expectations:
- Inflation: The personal consumption expenditures (PCE) price index measures what households pay for goods and services. In August it rose 3% year over year, as did core PCE, which strips out food and energy. Both came in below forecasts and matched July.
- Growth: Q2 GDP was revised up to 2.2% from 1.5%.
- Jobs: September payrolls added just 29,000 positions, the slowest hiring of 2026.
Odds fell sharply in response. Yahoo Finance tracked hike odds sliding from 64% to 28% in early October. CNBC put the chance of a quarter-point hike at just 17% on 2 October. TalkMarkets reported 13.8% after the jobs report.
Sources disagree on the starting point before payrolls. TalkMarkets cited both 24.4% and roughly 70%, likely reflecting different baselines. Either way, a single jobs print cut hike odds substantially.
What Fed officials said
The speeches leaned against October. In a late-September address at the University at Buffalo, John Williams, New York Fed President and FOMC Vice-Chair, said there is “no need for urgency”. He added that “one further upward adjustment” may suit later this year.
Vice Chair Philip Jefferson followed a day later at the Darden School of Business:
Philip Jefferson, Fed Vice Chair “Any future adjustments in policy should be determined by carefully examining trends in the data, the evolving outlook, and the balance of risks.”
The vice-chairs carried unusual weight because Warsh has offered little guidance. He has described policy as “well-positioned” and dismissed demands for his dot, saying Wall Street believes “if they only had my dot, everything would be swell.”
The data are mixed rather than simply soft: solid growth, 3% inflation and weak hiring. You should expect the next release to move the odds again.
Investors tracking the next inflation print can use our full explainer on how CPI surprises move markets, which shows why the gap to consensus matters more than the level.
What should investors watch before the October 27-28 meeting?
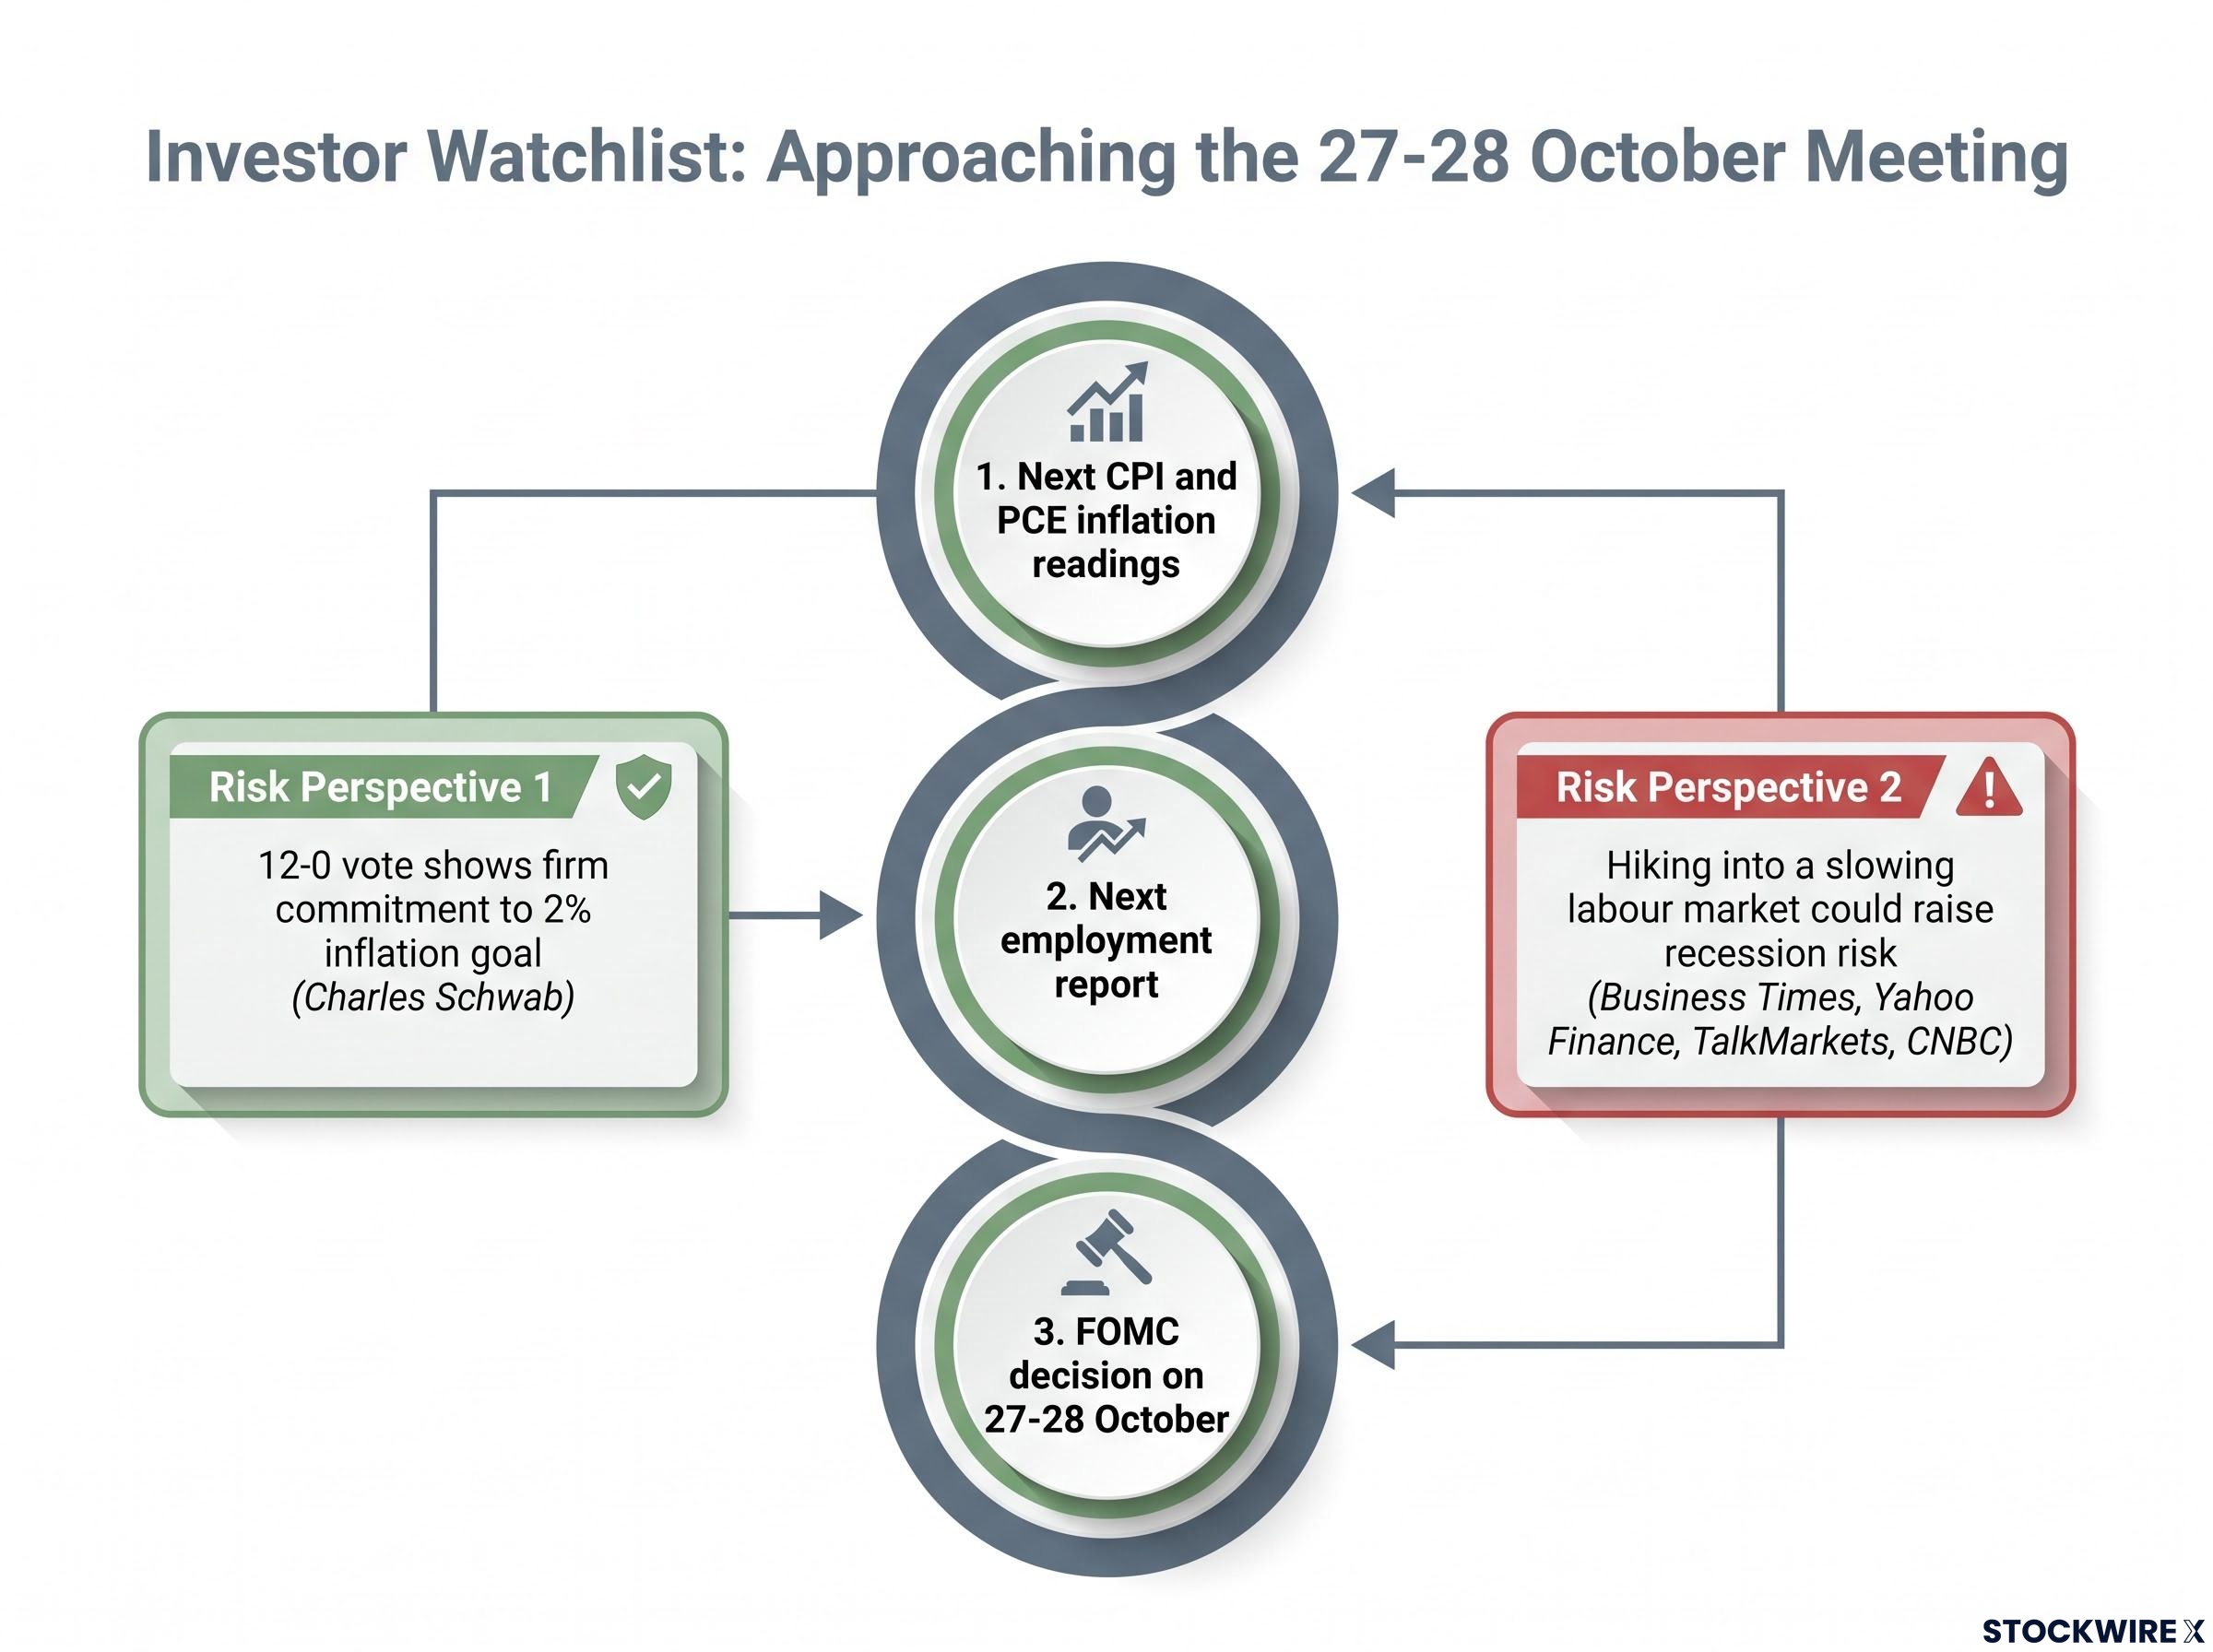
Two readings of the risk are competing. Charles Schwab sees the 12-0 vote and the dots as evidence of a firm commitment to bringing inflation back to the 2% goal. Business Times, Yahoo Finance, TalkMarkets and CNBC frame the larger danger differently: hiking into a slowing labour market could raise recession risk without speeding up disinflation.
The FOMC vote split has shifted from 9-3 in July to a unanimous 12-0 in September, and that change in dissent patterns is itself a signal of how far the committee’s internal debate has moved.
The data do contain some stagflation-like elements, meaning stubborn inflation alongside weakening jobs. Coverage, however, has not framed the debate that way.
Detailed asset-class forecasts were not available. The effects below are inferences, not predictions:
- Treasury yields: a near-term pause would typically keep short-term yields lower than an imminent hike would.
- Equities: pricing that signals policy stability tends to support risk assets.
- US dollar: lower hike odds limit the dollar’s upside.
- Mortgages: borrowing costs remain elevated and could edge up if the projected path holds.
- Savers: higher-for-longer rates keep savings yields well above pre-tightening levels.
Borrowing costs stay high whether the Fed pauses or hikes. Judge your exposure to rates by the projected path, not just the October decision.
Business Times and Yahoo Finance identify the next data releases as decisive. Watch, in order:
- The next CPI and PCE inflation readings.
- The next employment report.
- The FOMC decision on 27-28 October.
FedWatch has swung quickly after major releases, so each of these could reset the odds.
Past performance does not guarantee future results. Financial projections are subject to market conditions and various risk factors.
What the pause odds change, and what they leave open
The Fed’s projected path and market pricing disagree mainly on timing, not direction. Sixteen of 18 officials still expect another hike this year, while traders place roughly 81% odds on a hold this month. The October data will decide which view gives way.
If you hold rate-sensitive assets, the dates to mark are the coming inflation and jobs prints and the 27-28 October meeting. Read the decision alongside the dots rather than in isolation.
This article is for informational purposes only and should not be considered financial advice. Investors should conduct their own research and consult with financial professionals before making investment decisions.