You click buy at one price and your platform confirms a fill several pips away. Even one broker’s favourable transparency report, from FXCM UK, shows that 57.42% of stop orders filled at a worse price than requested. The price on your screen is a starting point, not a promise, and that gap is the heart of order execution quality.
Two brokers can quote identical spreads and still hand you very different fills. The difference never shows up on the pricing page, but it comes out of your account on every trade.
If you treat the quoted spread as the full cost of trading, you are only counting the visible part of what you pay. Slippage, rejected orders and slow processing all add to the true cost.
Here is what drives the gap between the price you click and the price you get, how to read the benchmarks brokers publish, and how to match a broker to the way you actually trade.
Why the price you click is not always the price you get
The moment feels simple. You see a price, you click, and the trade appears in your account. Between those two events, though, your order travels to the broker, gets processed and meets whatever liquidity is available at that instant.
Slippage is the difference between the price you clicked and the price you received. It can be positive (a better price), zero or negative (a worse price). It follows from four predictable drivers:
- Rapid movement: prices can shift between your click and your fill, especially around news and central-bank decisions.
- Latency: the delay between placing and filling an order, made up of network transit plus the broker’s own processing time.
- Limited liquidity: too little volume at the best price to fill your whole order.
- Order type: limit orders and stop orders behave in opposite ways.
Latency matters because currency prices update constantly. Even a lag of a fraction of a second gives the market time to move. Chris Weston, head of research at Pepperstone, has argued that traders should not pay a different price because of latency, though that is a broker’s view of what brokers should deliver.
Order type is where the numbers split most sharply. A limit order fills at your price or better. A stop order becomes a market order once triggered, which means it executes while prices are already moving against you.
When stop orders trigger, they convert to market orders, so you accept whatever price the market offers at that moment; this is why fast conditions and thin liquidity can leave your fill well short of the level you set.
One broker, two very different outcomes FXCM UK’s 2025 data: 74.58% of limit orders received positive slippage, while 57.42% of stop orders received negative slippage.
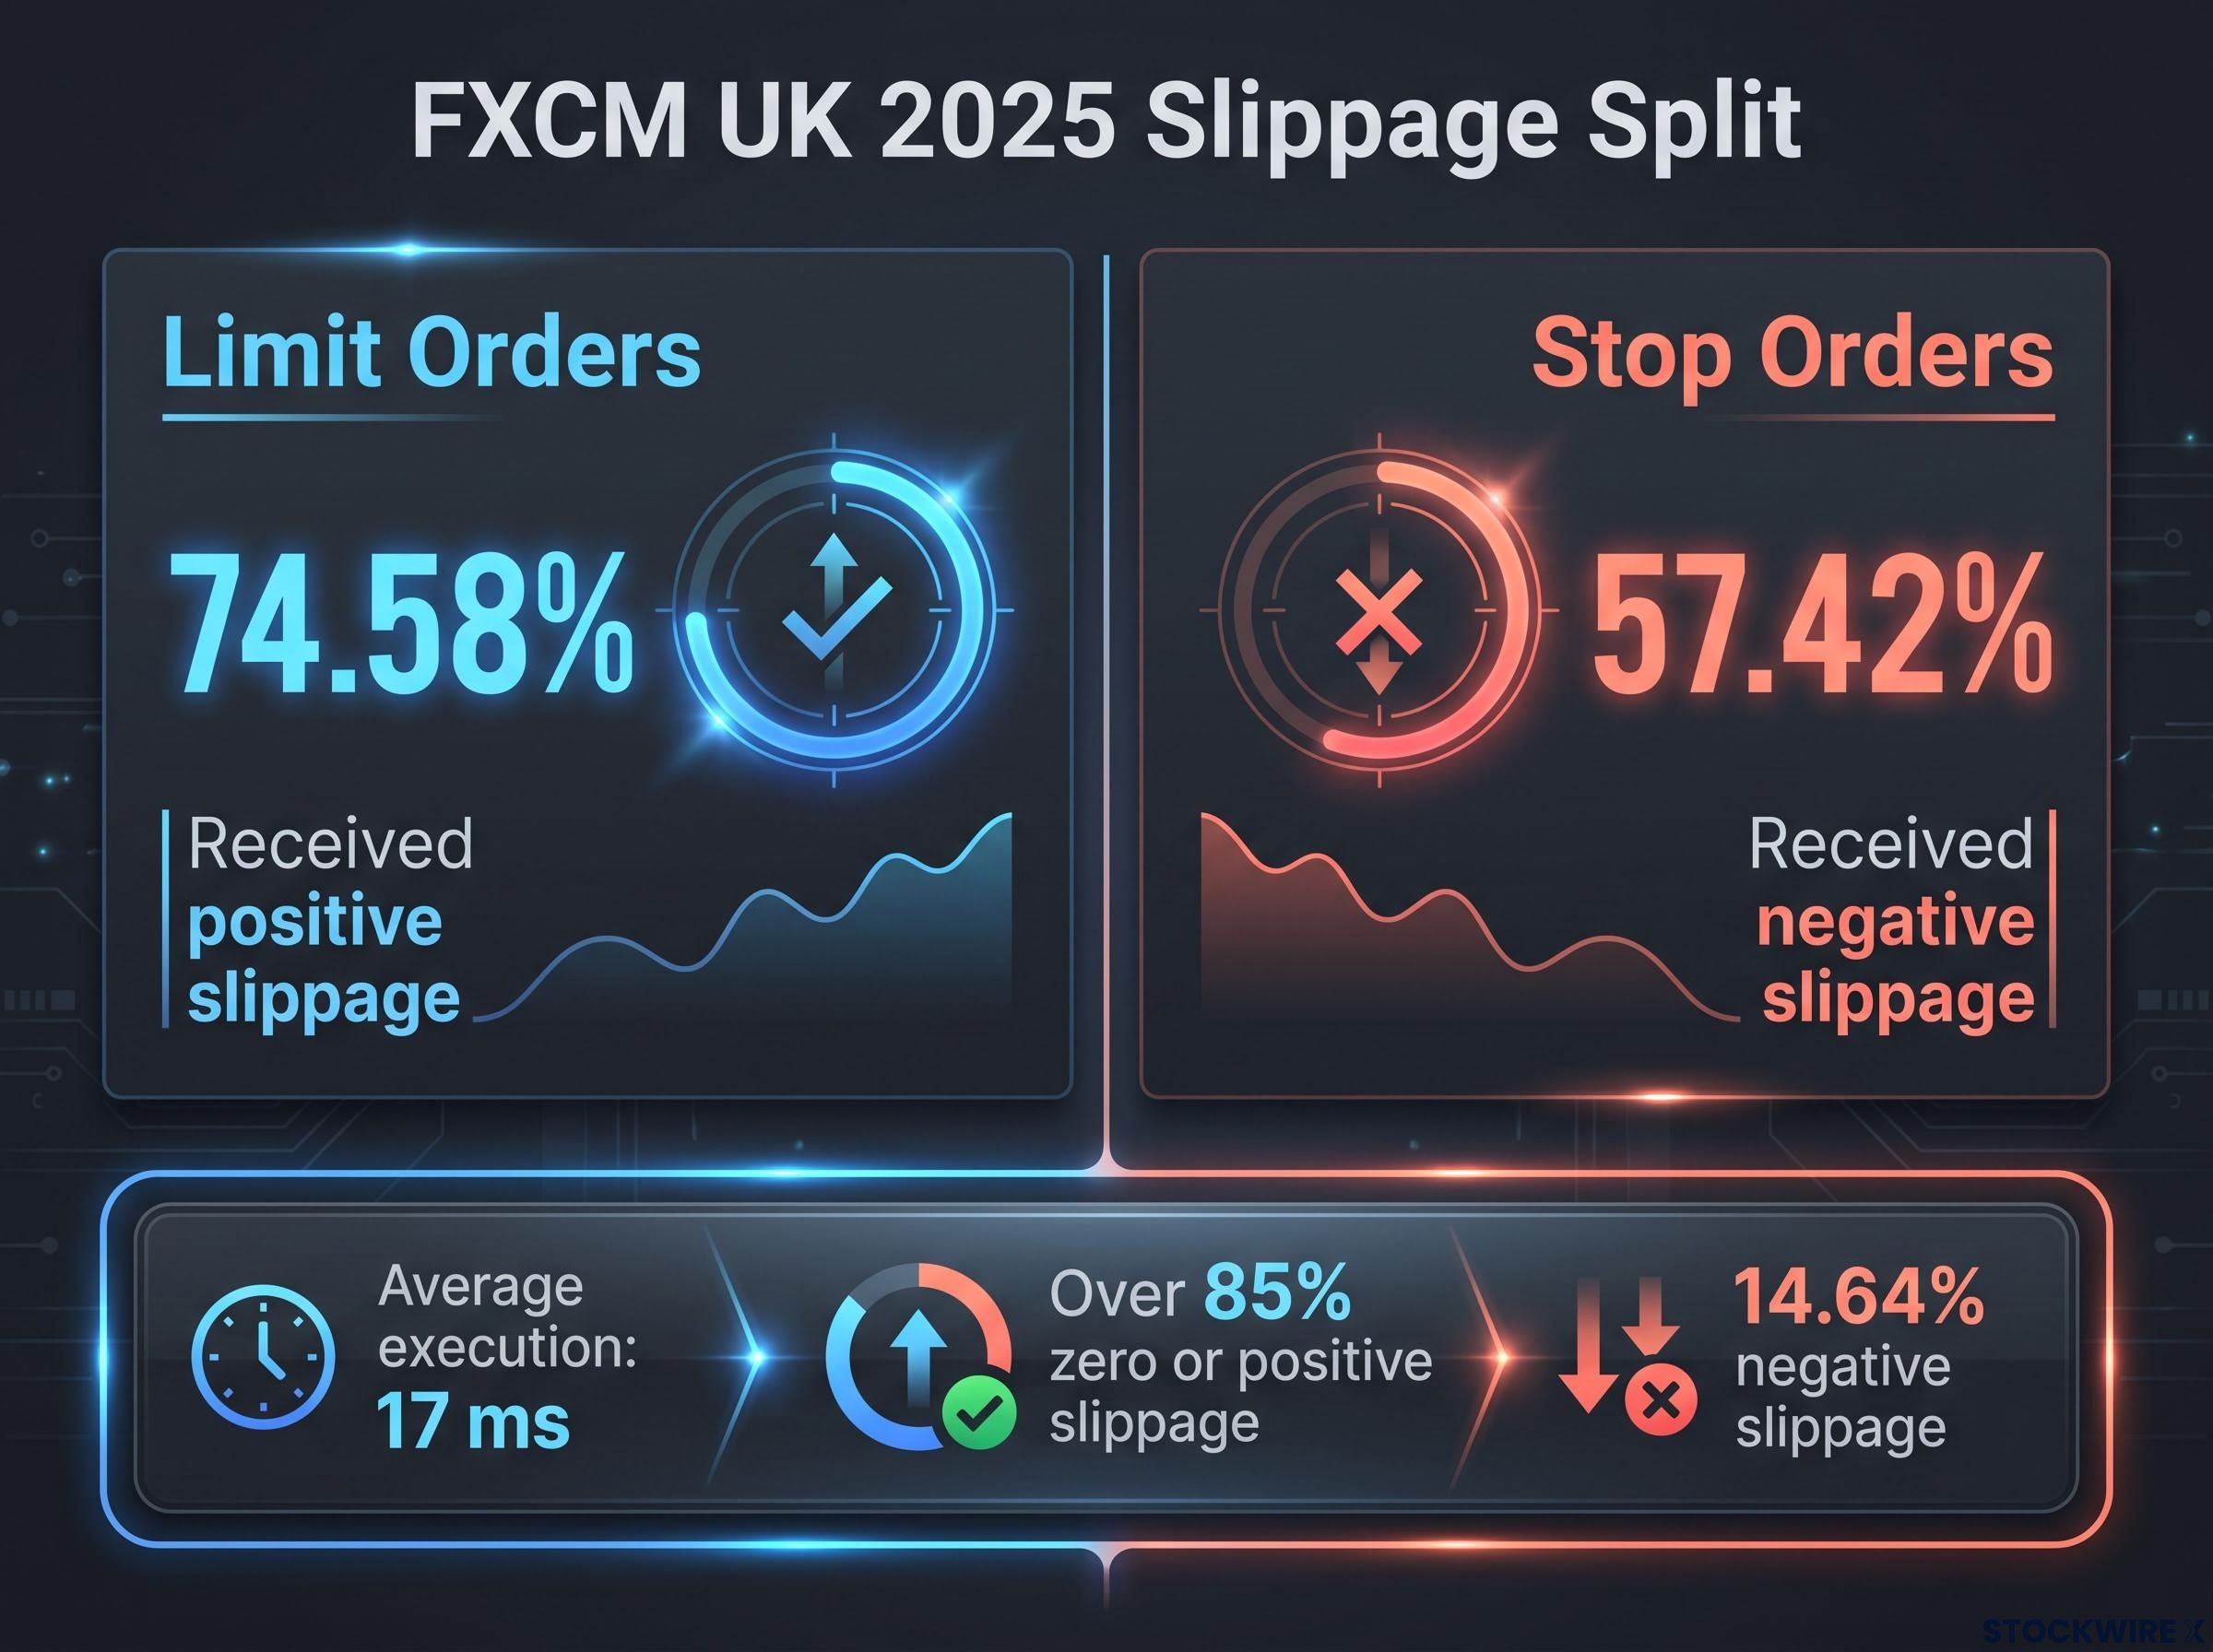
That split tells you the same broker can treat you very differently depending on your order mix. Check how you actually trade before you judge any broker’s headline figure.
Some institutional currency pricing also uses last look, a brief window in which a liquidity provider can accept or reject your trade request. If the market moves unfavourably in that window, you may get a requote, which is a new, usually worse, price offered in place of your original one.
How thin liquidity turns one click into several fills
Suppose your broker shows only 0.1 lot available at the best offer, and you want to buy a full lot. The first tenth fills at the quoted price. The rest climbs to the next price levels, and your average fill ends up worse than the price you saw.
This is why some brokers can advertise very tight spreads while only filling tiny volumes at that price. The headline spread is real, but it may not apply to the size you trade.
When big ASX news breaks, our subscribers know first
When markets move fast, how bad is too bad?
Quiet markets flatter almost every broker. The same infrastructure that fills you cleanly on a slow afternoon can strain badly when a central bank surprises or a major data release hits.
News events are where execution differences become visible. Liquidity thins, prices jump and slower systems fall further behind the market. According to ComoFX, here is how to tell normal from problematic slippage on major currency pairs. A pip is the smallest standard price move in a currency pair.
News-event yardstick (major pairs) 1-3 pips of slippage during typical news is considered normal. 10-20 pips signals poor execution or severe illiquidity.
Speed shapes where you land on that scale. ComoFX published these latency bands in April 2026, measured in milliseconds (ms), where one millisecond is a thousandth of a second:
| Latency | Rating | Practical meaning |
|---|---|---|
| Under 50 ms | Excellent | Institutional-grade speed |
| 50-100 ms | Good | Acceptable for any retail strategy |
| 100-300 ms | Marginal | Visible slippage in fast markets |
| Above 300 ms | Unsuitable | Not fit for active trading |
Sub-100 ms fills reduce slippage, and higher latency widens the gap between your click and your fill when prices are moving quickly. These yardsticks give you a way to audit your own fills around data releases and judge whether your broker is performing normally.
There is a gap in the evidence, though. No regulator or independent dataset was found giving full order-book depth or average spreads at specific 2024-2026 events such as Federal Open Market Committee (FOMC) decisions or US non-farm payrolls (NFP) releases.
Then there is the outer limit. When the Swiss National Bank removed its EUR/CHF floor in 2015, spreads blew out, liquidity at the best prices vanished and fills landed far from clicked prices. Some traders ended with negative balances and some brokers failed.
No broker, however well engineered, can promise a clean fill in a market that has stopped trading normally.
Why fast brokers tend to have tight spreads, and why that is not a guarantee
If speed matters this much, you might expect it to vary randomly between brokers. It does not. Weston says Pepperstone’s own testing on MetaTrader shows execution speeds differ consistently between brokers, and he attributes that to investment in technology, liquidity access and operations. Treat it as company testing with a promotional angle.
Compare Forex Brokers has observed a strong correlation between the fastest execution speeds and the lowest spreads. Weston’s explanation is that efficient order processing across the whole pipeline drives both.
Technical benchmarks support the idea. According to FXNX in September 2026, latency under 50 ms points to strong connectivity to deep liquidity, 10-40 ms of broker-side processing is a top-tier target for algorithmic trading, and sustained 80-100 ms suggests routing or liquidity problems.
Correlation is not causation, however.
A broker can quote tight spreads while offering shallow depth, frequent rejections or slow processing. Even FXCM UK’s favourable 2025 figures (17 ms average execution, over 85% of orders at zero or positive slippage) still include 14.64% negative slippage. Its 2024 data showed 62.19% zero, 25.64% positive and 12.18% negative, a different period with different results.
| Broker claim | What the claim says | What to check |
|---|---|---|
| Tight spreads | Low quoted cost per trade | Volume available at that price and fills on your usual size |
| Fast average speed | Orders reach the market quickly | Outliers, testing conditions and speed during news |
| Favourable slippage stats | Most fills at or better than requested | Breakdown by order type, plus rejects and requotes |
A tight spread on its own tells you little. Pair it with slippage and depth data before treating any broker as cost-efficient.
Market maker or STP/ECN: does the model decide speed?
A market maker internalises your order, meaning it takes the other side itself, which creates a potential conflict of interest. A straight-through processing (STP) or electronic communication network (ECN) broker routes your order to external liquidity providers.
The model alone is not a verdict. Exness, a market maker, averaged 88 ms for market orders and 92 ms for limit orders, according to a QuantVPS review in January 2026. Transparency on slippage tells you more than the business label.
How to read broker claims and match a broker to your trading style
Transparency reports and executive interviews are marketing as much as disclosure. Read them alongside independent testing.
Regulators focus on process rather than numbers. FINRA Rule 5310, from the US Financial Industry Regulatory Authority, lists price (including price disimprovement, meaning a worse price than the best quote available), likelihood of execution and speed as core best-execution factors. No new currency or contract for difference (CFD) slippage disclosure rules were identified from the SEC, ESMA, FCA, ASIC or CFTC/NFA for 2024-2026.
That leaves room for flattering presentation. Watch for small test samples, tight spreads that apply only to tiny sizes, statistics that omit rejected and requoted orders, lab speeds that ignore real-world connections, and averages that hide your order-type mix.
Your trading style decides which numbers matter:
| Trading style | Latency priority | Key execution metric | What matters most |
|---|---|---|---|
| Scalping | End-to-end under 50-100 ms; processing ideally 40 ms or less | Slippage near 1-3 pips on majors during news | Deep liquidity and detailed execution reports |
| Intraday | Consistent sub-100 ms | Reasonable slippage in normal volatility | Competitive spreads |
| Swing/position | 100-300 ms tolerable | Stop slippage on large orders | Spreads and gap handling |
| Algorithmic | 10-40 ms processing | Granular fill-rate data | Stable routing and a VPS near broker servers |
A virtual private server (VPS) is a remote computer that runs your trading software continuously, ideally located close to the broker’s infrastructure to cut network delay.
Good execution does not prevent losses in leveraged products, and retail CFD loss rates rarely appear next to execution marketing.
Regulatory disclosures put retail loss rates on leveraged products between 68% and 89%, and while execution costs contribute, behavioural habits such as delayed stop-loss exits and premature profit-taking explain much of the remainder.
A practical checklist before you fund an account
Because broker figures are self-reported, treat them as a shortlist, then verify:
- Check whether slippage is broken down by order type, especially stops.
- Look for data on rejected orders and requotes, not just filled trades.
- Compare the broker’s claims with independent speed tests.
- Test fills around a news release on a demo or small live account, against the 1-3 pip and 10-20 pip yardsticks.
- Confirm the methodology and sample size behind every published figure.
This article is for informational purposes only and should not be considered financial advice. Investors should conduct their own research and consult with financial professionals before making investment decisions. Past performance does not guarantee future results.
Judging execution on evidence, not on the advertised spread
Slippage comes from latency, depth, volatility and the orders you choose. Published figures only help when you know the period, sample and order mix behind them.
Regulators set expectations for process, while the numbers come from independent tests and your own fill records. Your trade history is the most honest execution report you will ever read.
Your next step: name your trading style, pick the two or three execution metrics that matter most to it, and verify them yourself before you rely on any broker’s claims.