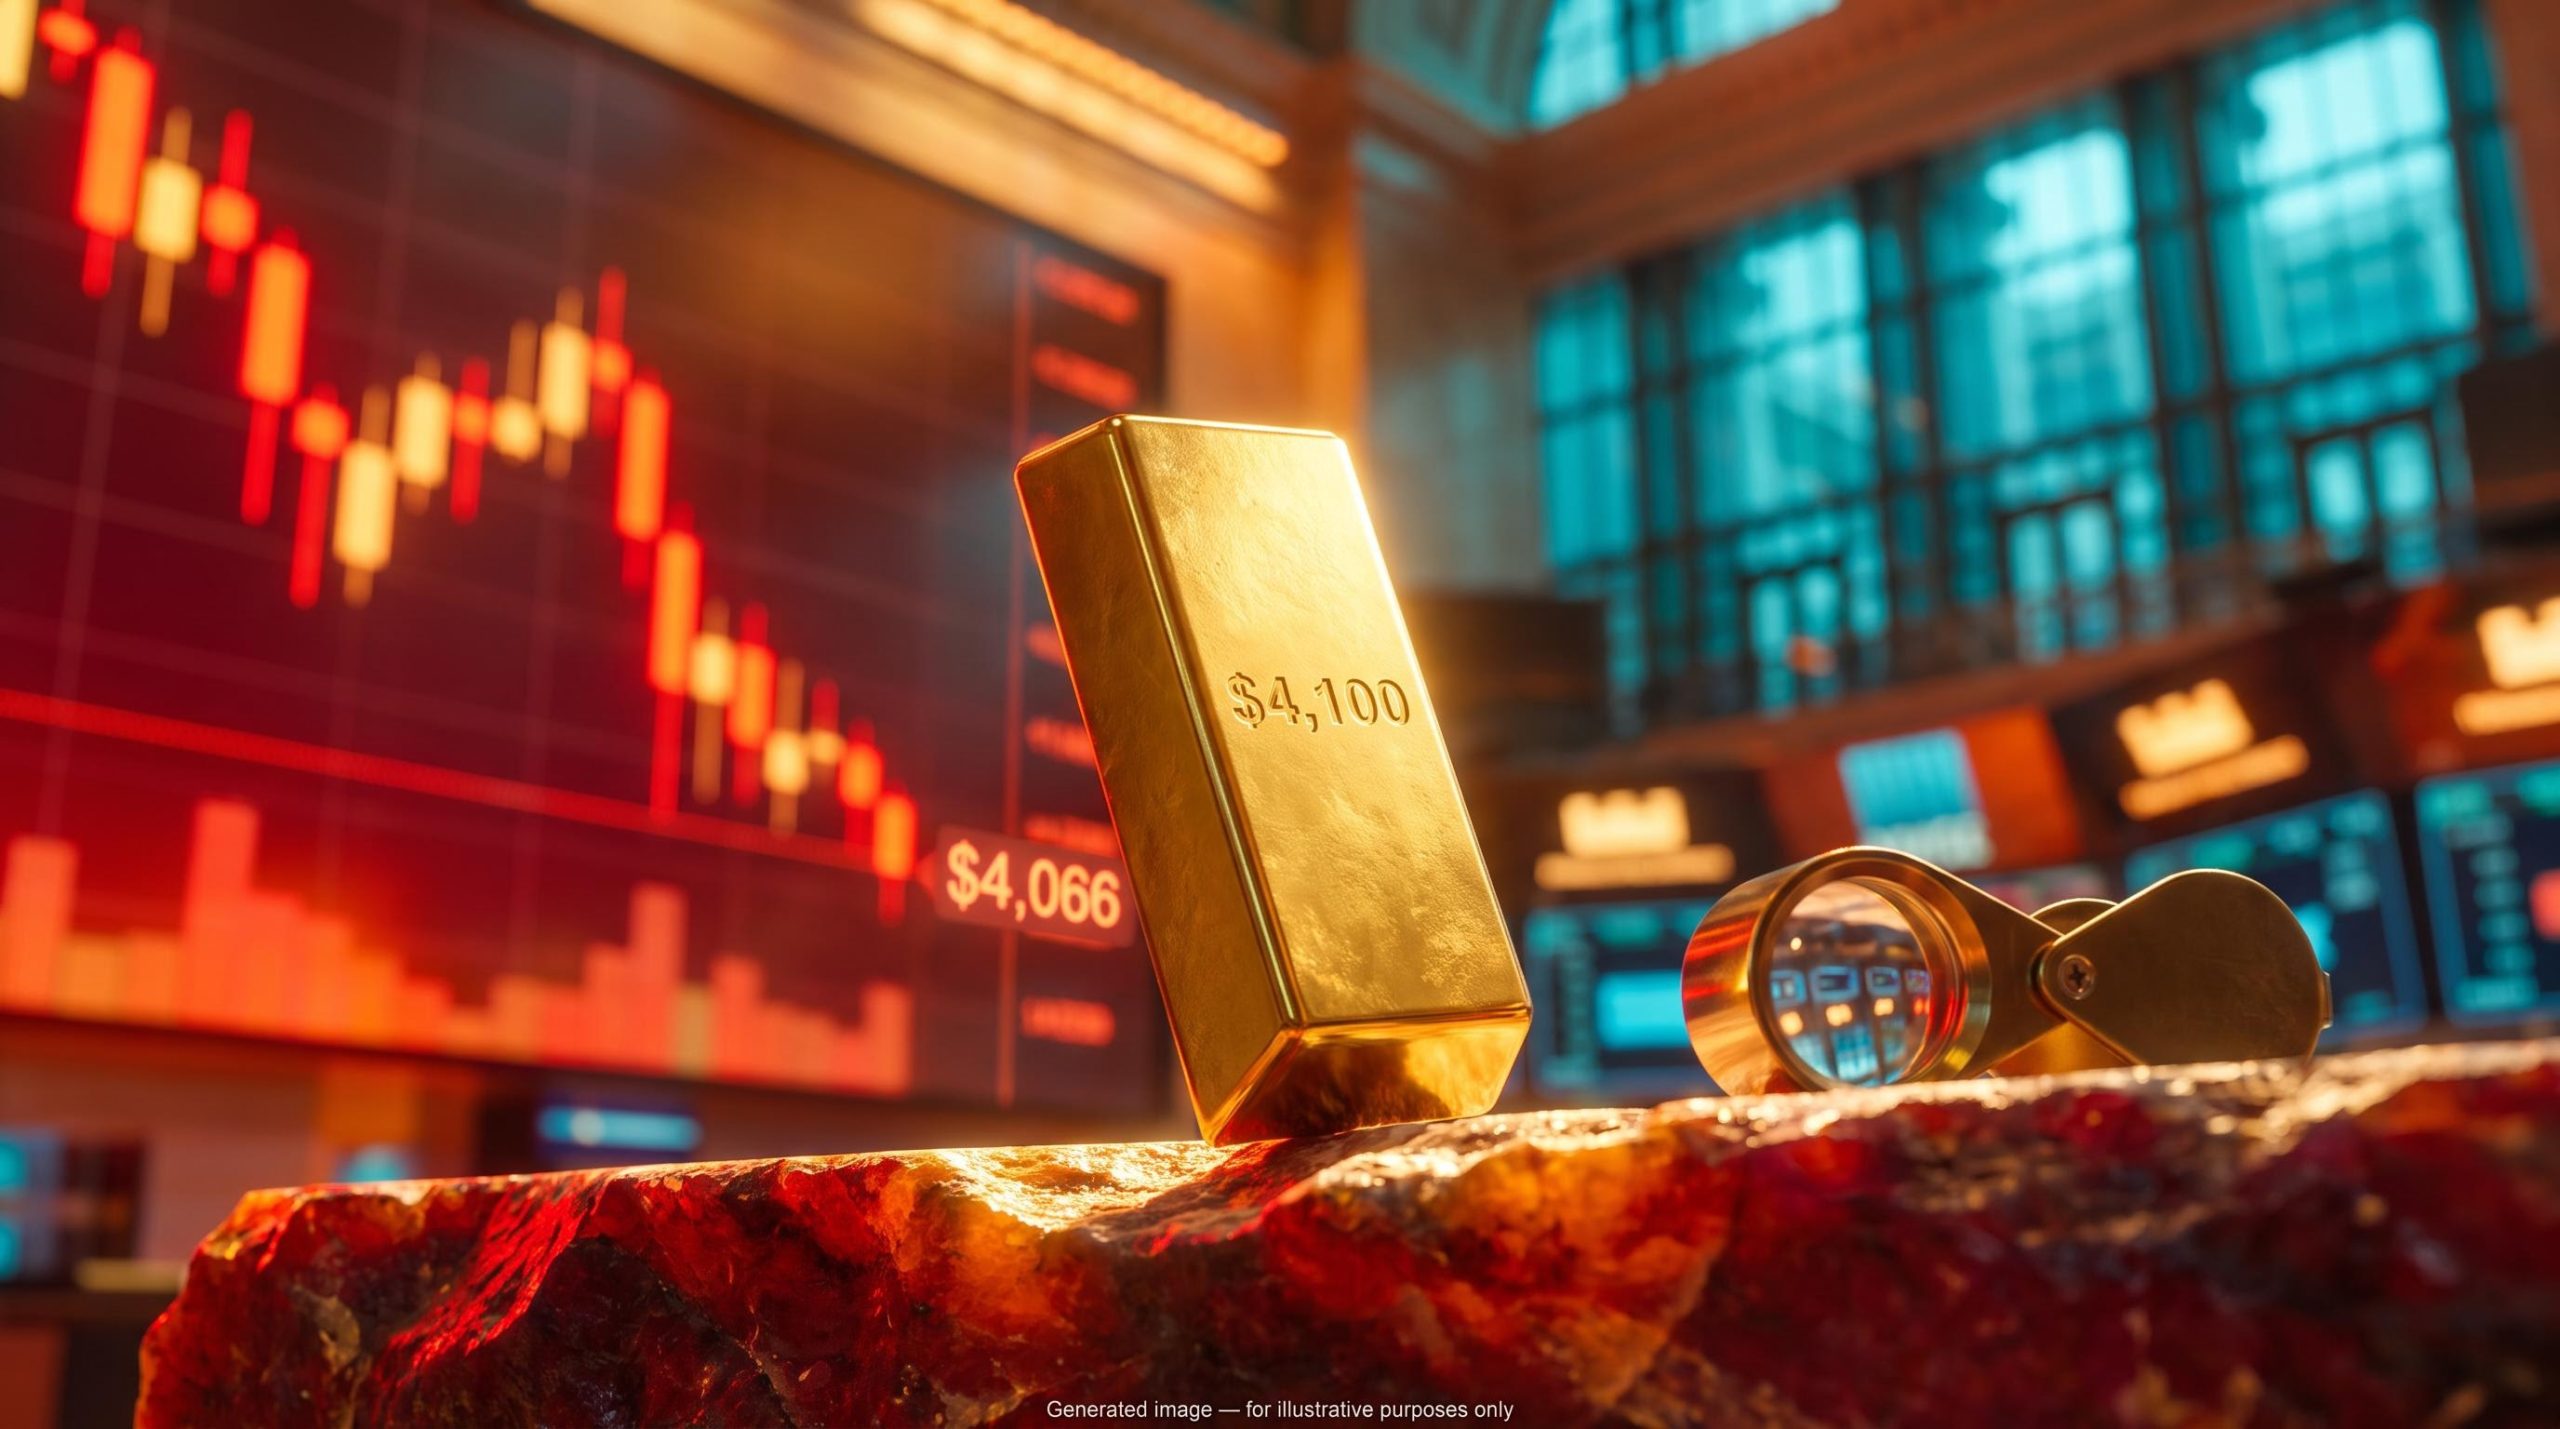
Gold had every reason to fall hard on Wednesday. The Federal Open Market Committee (FOMC) minutes confirmed a unanimous vote for the September rate hike and signalled another increase before year-end, and bullion slid to a two-month low of $4,066. Within the same session, it was back above $4,100.
That mismatch matters for any gold price analysis. A hawkish headline arrived, and the market largely shrugged it off.
The session on 7 October 2026 tested whether Federal Reserve tightening still sets gold’s direction on its own, or whether yields, oil and central bank buying now carry equal weight. If you read the price as a simple reaction to rate policy, you could misjudge both the support beneath it and the threats still facing it.
Here is how the forces line up: what is holding gold up, what is pressing it down, and which price levels are likely to decide the next move.
Why did gold bounce after hawkish Fed minutes?
The surprise was not the dip. It was how little the minutes themselves moved the price. Gold barely reacted when the document was published. The intraday low and the rebound that followed tracked Treasury yields and oil far more closely than anything the Fed had written.
What the minutes said
On direction, the message was clear. Every member backed the September hike, and members considered another increase appropriate by year-end if inflation and activity do not slow enough.
The Federal Reserve minutes release for the September 15-16 meeting shows the committee agreed on direction but not on purpose, which is why the market read the document as a limited tightening path rather than the start of an accelerating cycle.
On purpose, the message was split. Participants gave different reasons for the hike:
- Many viewed it as a safeguard in case inflation stays stubbornly high relative to the Fed’s goal
- Others viewed it as a way to stop inflation spreading into other prices
- A couple of members said it brought policy into line with a higher-than-expected neutral rate (the rate that neither speeds up nor slows down the economy)
- Some reports described the split as precautionary tightening versus the start of a cycle meant to rein in business investment and consumer spending
Fed officials spoke on Tuesday, and their comments pulled in two directions. Kansas City Fed President Jeffrey Schmid said more increases are needed to curb high inflation. San Francisco Fed President Mary Daly said further moves would depend on data and external shocks.
What the market heard
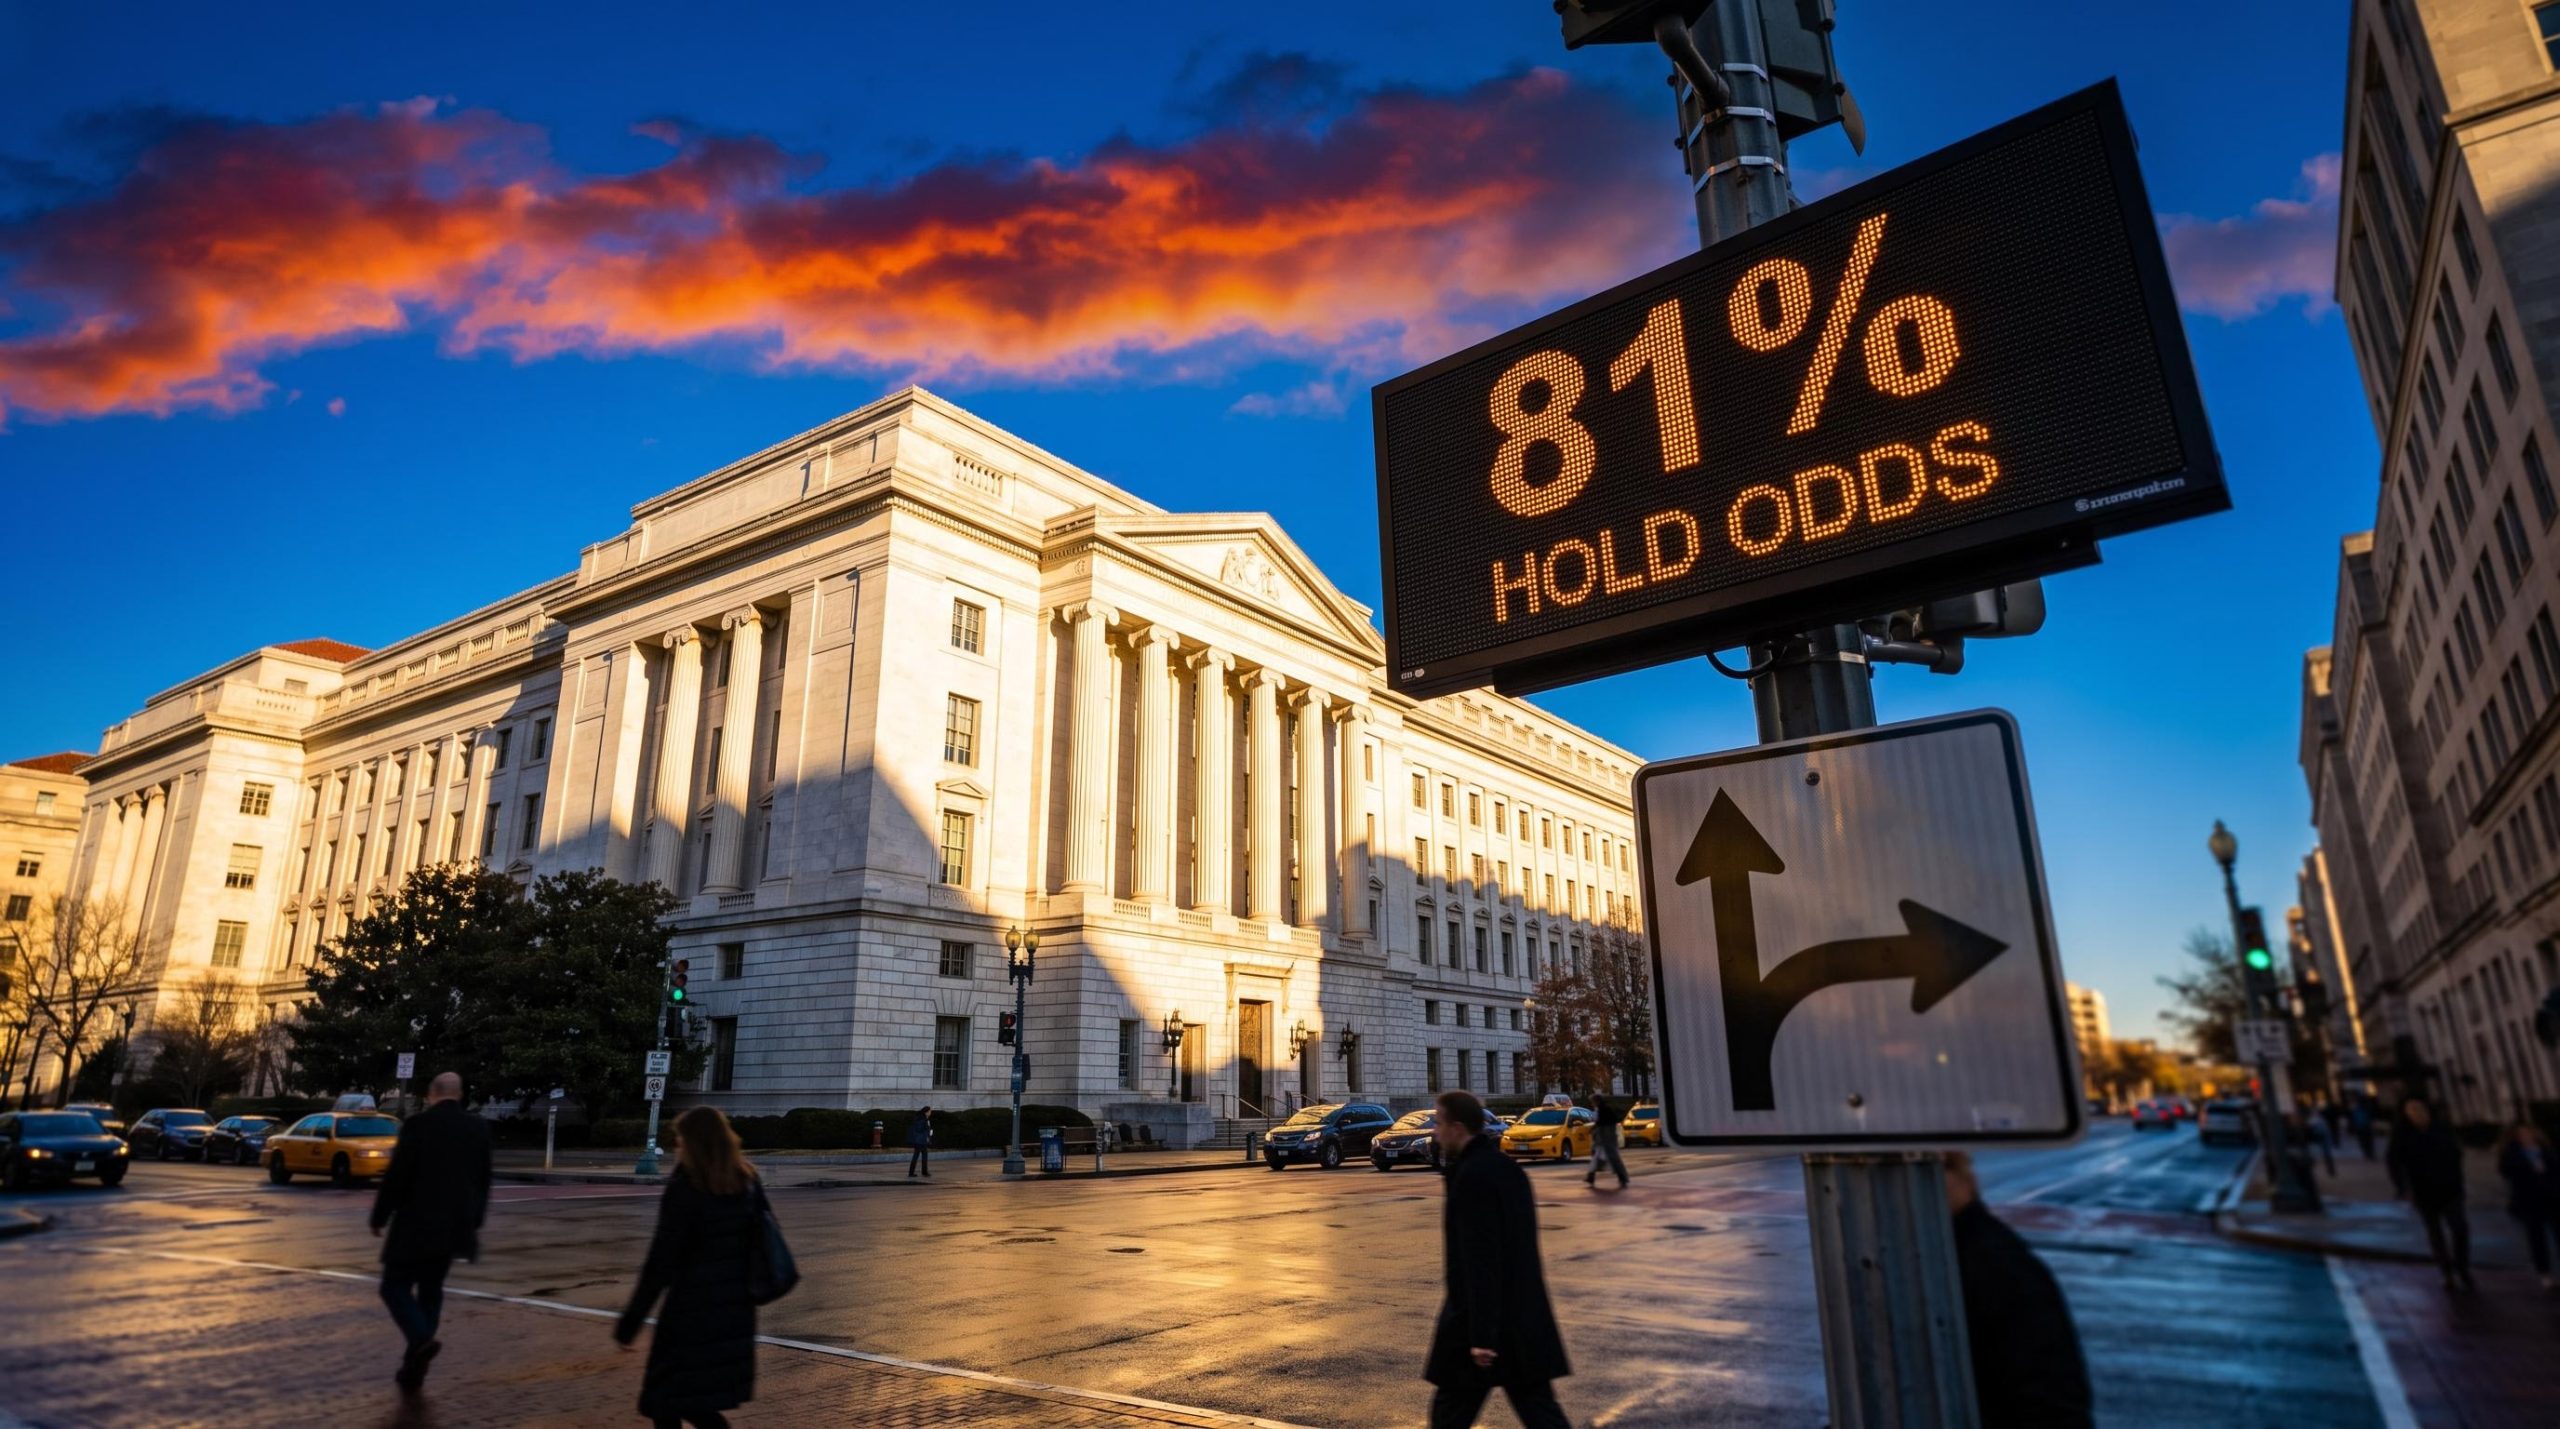
Traders heard a central bank that is not committed to an accelerating cycle. CME FedWatch data cited by TMGM put the odds of no change at the October meeting at roughly 79.5%, while Prime Terminal showed about 80% for a hold and 19% for a hike.
Commerzbank’s read: Gold had “stabilised for the time being at around USD 4,150” as concerns about a rapid US rate rise eased.
Gold still finished near $4,115, down about 1.2%. The disagreement over why the Fed hiked tells you the market is pricing a limited tightening path. That is why a hawkish headline did not turn into a sustained sell-off, and why the gap between what the Fed says and how markets price it is where gold’s short-term moves are decided.
When big ASX news breaks, our subscribers know first
How yields, the dollar and oil move gold (and why the link is inverse)
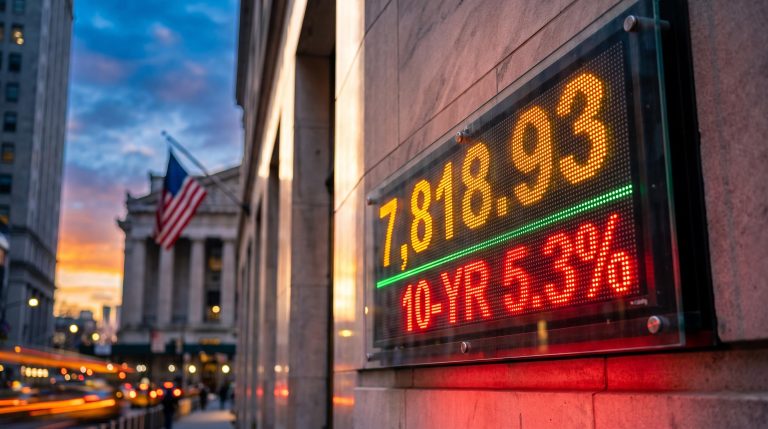
If the minutes did not drive the day, the trading screen did. The US 10-year Treasury yield eased about one basis point (one hundredth of a percentage point) to 5.27%, after reaching a 24-year high of 5.365%. The US Dollar Index rose 0.40% to 102.24, and West Texas Intermediate (WTI) crude fell 1.66% to about $88.45.
The basic mechanics
Gold pays no interest. When real yields rise (bond returns after inflation), holding gold means giving up more income, so its appeal fades. When yields fall, that cost shrinks.
Gold pays no interest, so the figure that matters is not the headline policy rate but real yields, the nominal Treasury yield minus inflation expectations, which is why gold has risen through some hiking cycles and fallen through others.
The chain runs like this:
- Inflation pressure keeps the Fed hiking
- Higher policy rates push up real yields on Treasuries
- The income you forgo by holding gold instead of bonds grows
- Investment demand for gold softens, and the price comes under pressure
The dollar works through pricing. Gold is quoted in US dollars, so a stronger dollar makes it more expensive for buyers holding other currencies.
| Driver | Latest level | Effect on gold | Why |
|---|---|---|---|
| US 10-year yield | 5.27% (down ~1 bp) | Mild support | Easing from a 24-year high cuts the cost of holding gold |
| US Dollar Index | 102.24 (up 0.40%) | Headwind | A firmer dollar raises gold’s price for non-US buyers |
| WTI crude | $88.45 (down 1.66%) | Support | Lower oil eases stagflation and aggressive-tightening fears |
Oil is the secondary channel. Its fall eased fears of stagflation (high inflation alongside weak growth) and of aggressive tightening, which gave gold room to recover.
Why the link is not always linear
Admirals reported that higher real yields and a firm dollar weighed on gold in the weeks before the minutes. The broker also put speculative futures positioning near the 91st percentile of its recent range. With that many traders positioned the same way, moves can be amplified in either direction.
History adds a caveat. During the 2022-2023 hiking cycle, gold struggled early, then climbed to new highs once markets priced a policy peak. That tells you gold depends less on the hike itself than on whether yields keep climbing, so the 10-year yield is a more useful guide than Fed headlines alone.
Is central bank buying a floor under gold?
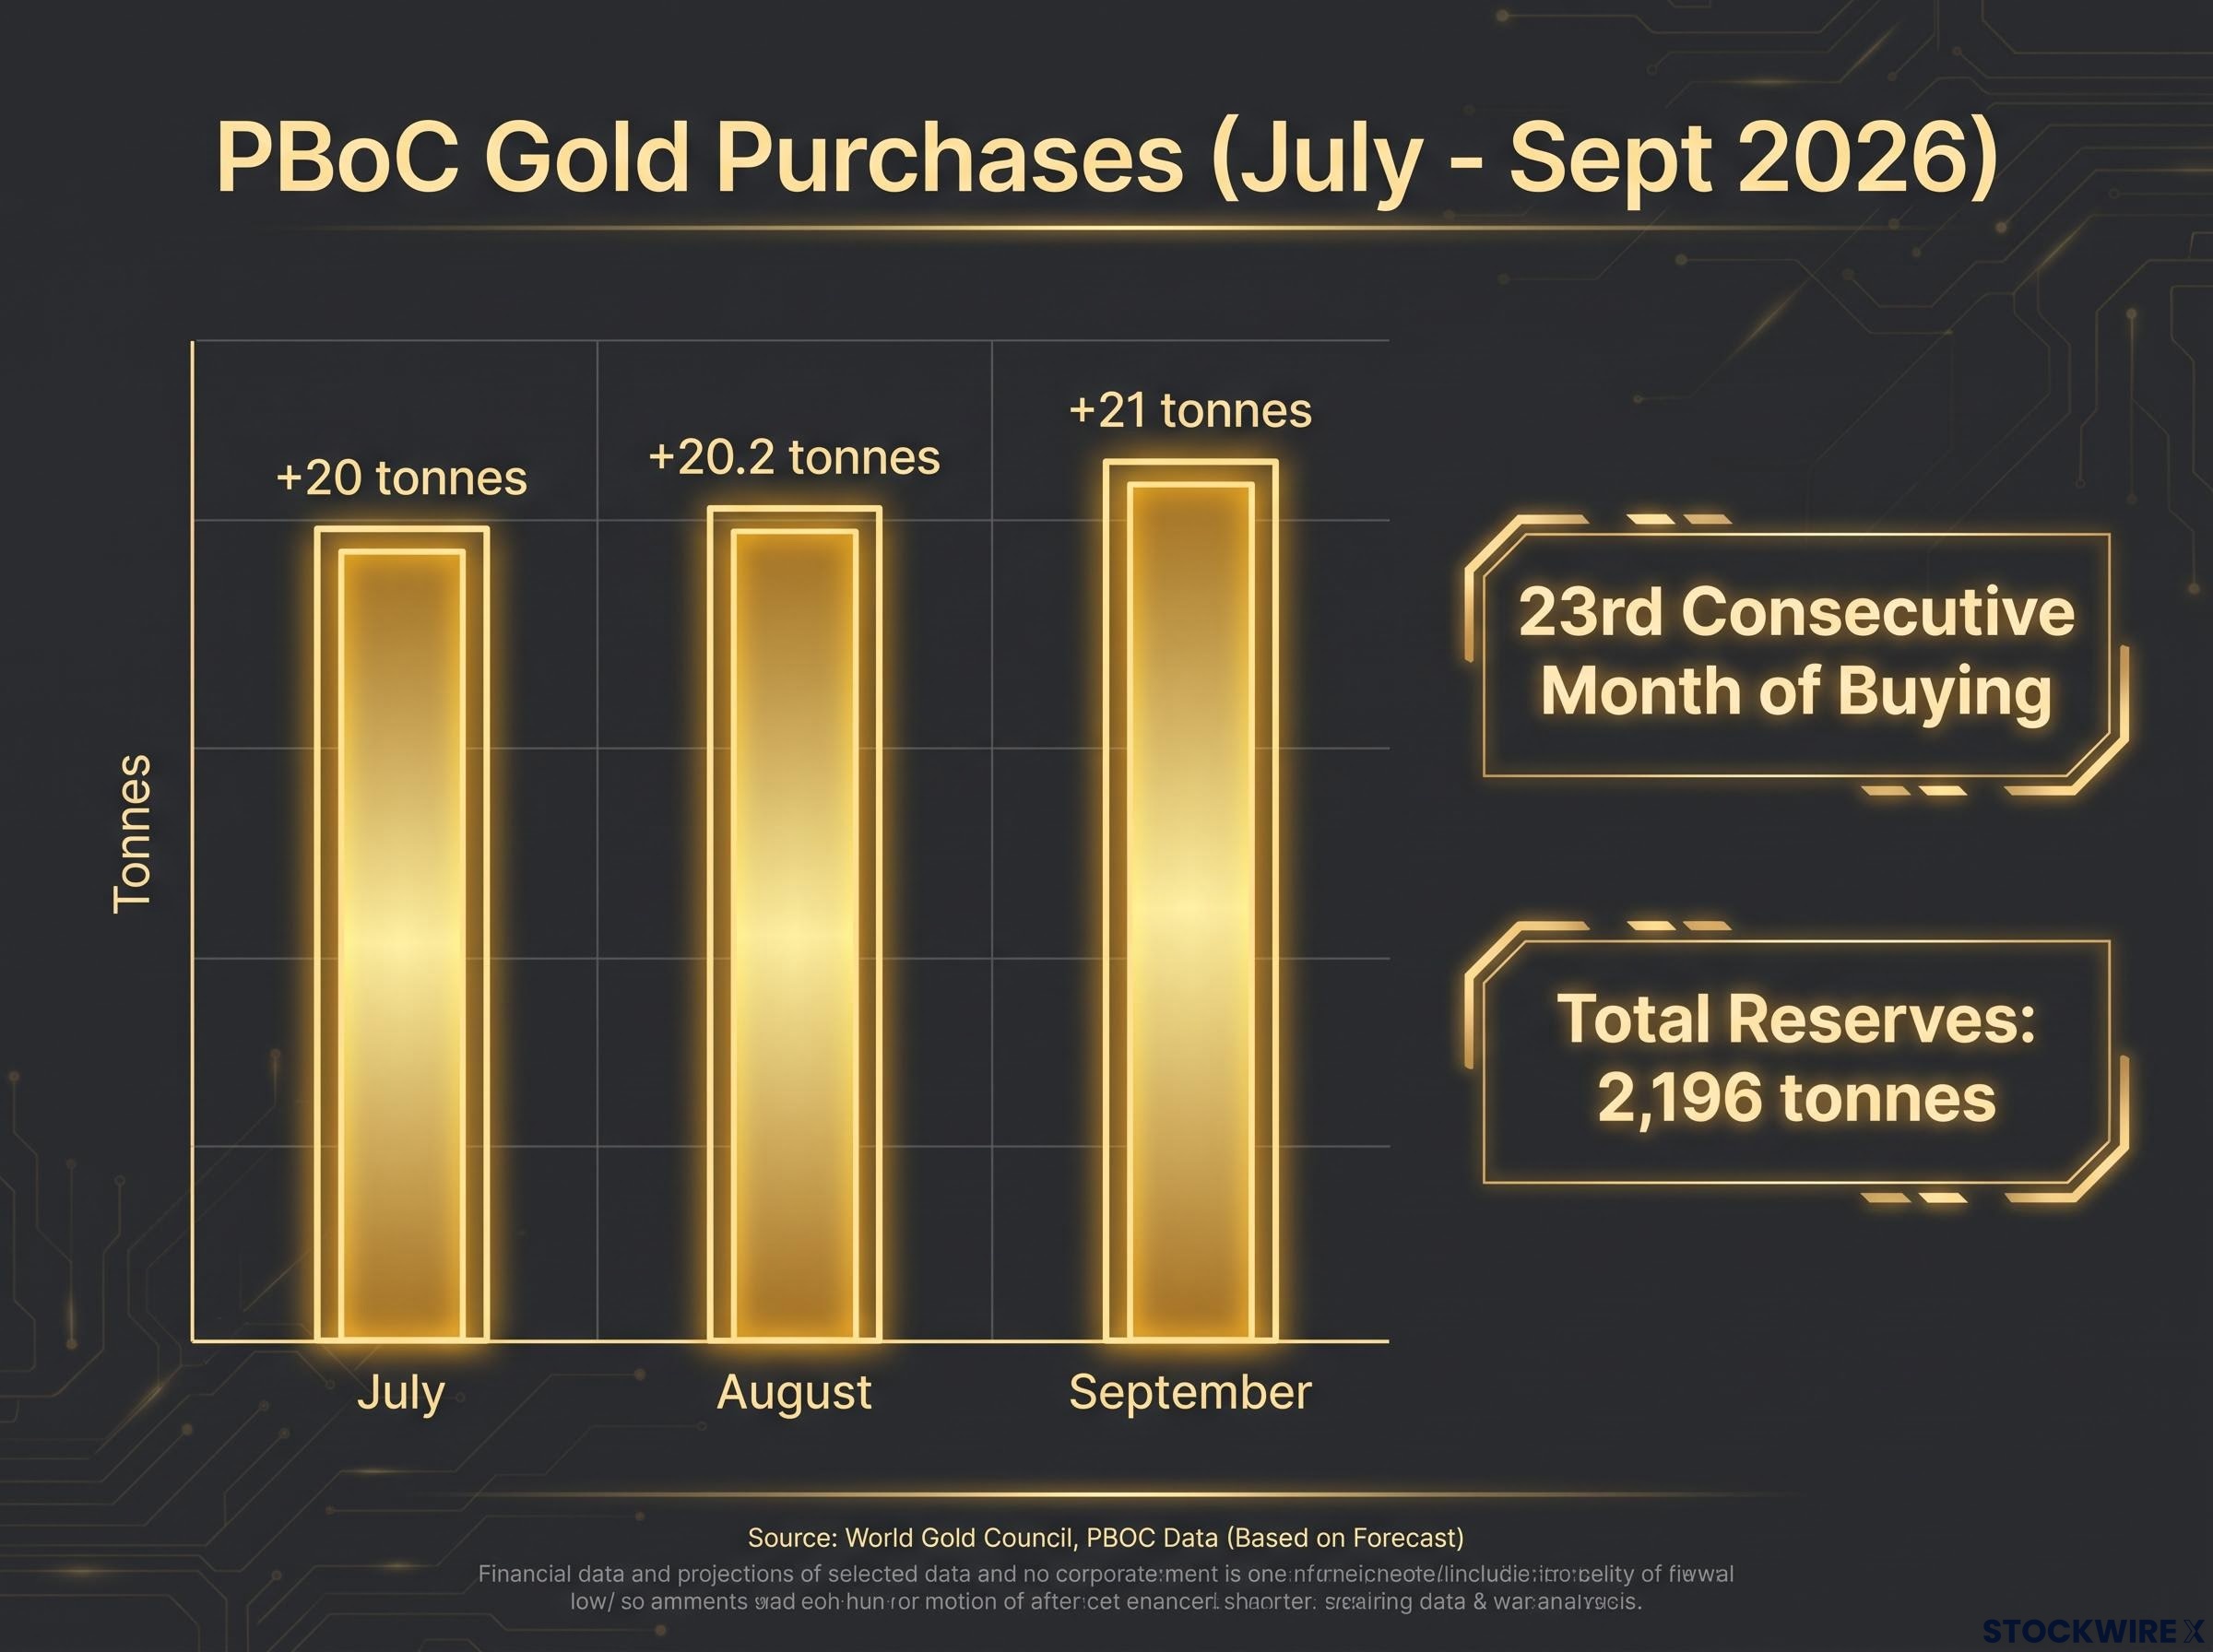
While speculators trade yields, one group of buyers is largely ignoring them. The People’s Bank of China (PBoC) added 21 tonnes in September, its largest monthly purchase in three years, according to Kitco News on 7 October 2026.
The PBoC’s streak: September was the 23rd consecutive month of buying, with 21 tonnes added and reserves at 2,196 tonnes.
The pace has been steady through 2026:
- July: +20 tonnes, the 21st straight month of buying
- August: +20.2 tonnes, the largest monthly increase since October 2023
- September: +21 tonnes
China is not alone. Central banks were net buyers of 23 tonnes in July, led by China and Poland, according to World Gold Council (WGC) data reported by Kitco. Reported Q2 2026 net purchases came to 289 tonnes, although comparisons with earlier periods have not been independently confirmed. The benchmark remains 2022, when central banks added a record 1,136 tonnes (about $70 billion), according to the WGC.
This buying is about long-term reserve diversification away from the dollar and hedging against sanctions, not reacting to rate moves. That makes it price-insensitive. It absorbs supply when speculators and exchange-traded fund (ETF) investors sell.
Sovereign buyers are largely motivated by sanctions-proofing, since physically vaulted gold cannot be frozen by a foreign government, a logic that differs sharply from a retail investor weighing yields against price.
The figures need care, however. Earlier coverage cited PBoC reserves of roughly 2,366 and 2,387 tonnes, figures that conflict with Kitco’s latest 2,196 tonnes. The most recent verified number is the safer reference.
For you, official buying can slow a decline and encourage dip-buying, but it does not cancel the pressure from high real yields. It is a cushion, not a ceiling-breaker.
Where are gold’s key levels and what could break them?
Those competing forces show up clearly on the chart. Gold remains in a downtrend of lower highs and lower lows, yet sellers have not managed a decisive push toward $4,000.
The levels
| Level | Value | Significance |
|---|---|---|
| 50-day SMA | $4,331 | Final hurdle in a recovery path |
| 100-day SMA | $4,267 | Next test after resistance clears |
| Resistance | $4,200 | First barrier to a recovery |
| Support | $4,100 | Line holding the dip-buying case |
| July 29 swing low | $3,996 | First downside target |
| Year-to-date low | $3,941 | Deeper downside target |
A simple moving average (SMA) is the average closing price over a set number of days. The relative strength index (RSI), which measures the speed of recent price moves, shows negative momentum. A recovery would need to clear $4,200, then both averages.
What could move them
- Bull case: continued central bank buying, the PBoC streak and dip-buying point to structural demand, and a policy error or growth slowdown could draw investors back
- Bear case: high real yields, a signalled year-end hike and a firm dollar keep the cost of holding gold high and cap rallies
- Key risks: sustained dollar strength could trigger ETF and futures outflows, and crowded positioning could unwind sharply if data turns hawkish
The next tests arrive quickly, with US Initial Jobless Claims on Thursday and University of Michigan Consumer Confidence on Friday. A hold above $4,100 keeps the dip-buying story intact. A close below it would tell you the yield headwind is winning, and $3,996 becomes the next test.
For readers wanting to apply these levels in practice, our full explainer on reading gold support and resistance shows how to use Fibonacci clusters and confirmed closes to place stops.
Past performance does not guarantee future results. Price levels and forecasts are subject to market conditions and may change quickly.
What this session changes, and what it does not
The session showed that hawkish policy alone is not dictating gold. Easing yields, falling oil, steady central bank buying and an ambiguous Fed message held the price above its two-month low, even as the minutes leaned towards another hike.
What has not changed is the trend. It still points down, and a firm dollar alongside high real yields remains the main threat to any recovery.
Three variables will tell you which side is gaining ground: the US 10-year yield, the US Dollar Index and the $4,100 support. If all three move against gold together, the case for buying dips weakens quickly.
This article is for informational purposes only and should not be considered financial advice. Investors should conduct their own research and consult with financial professionals before making investment decisions.