
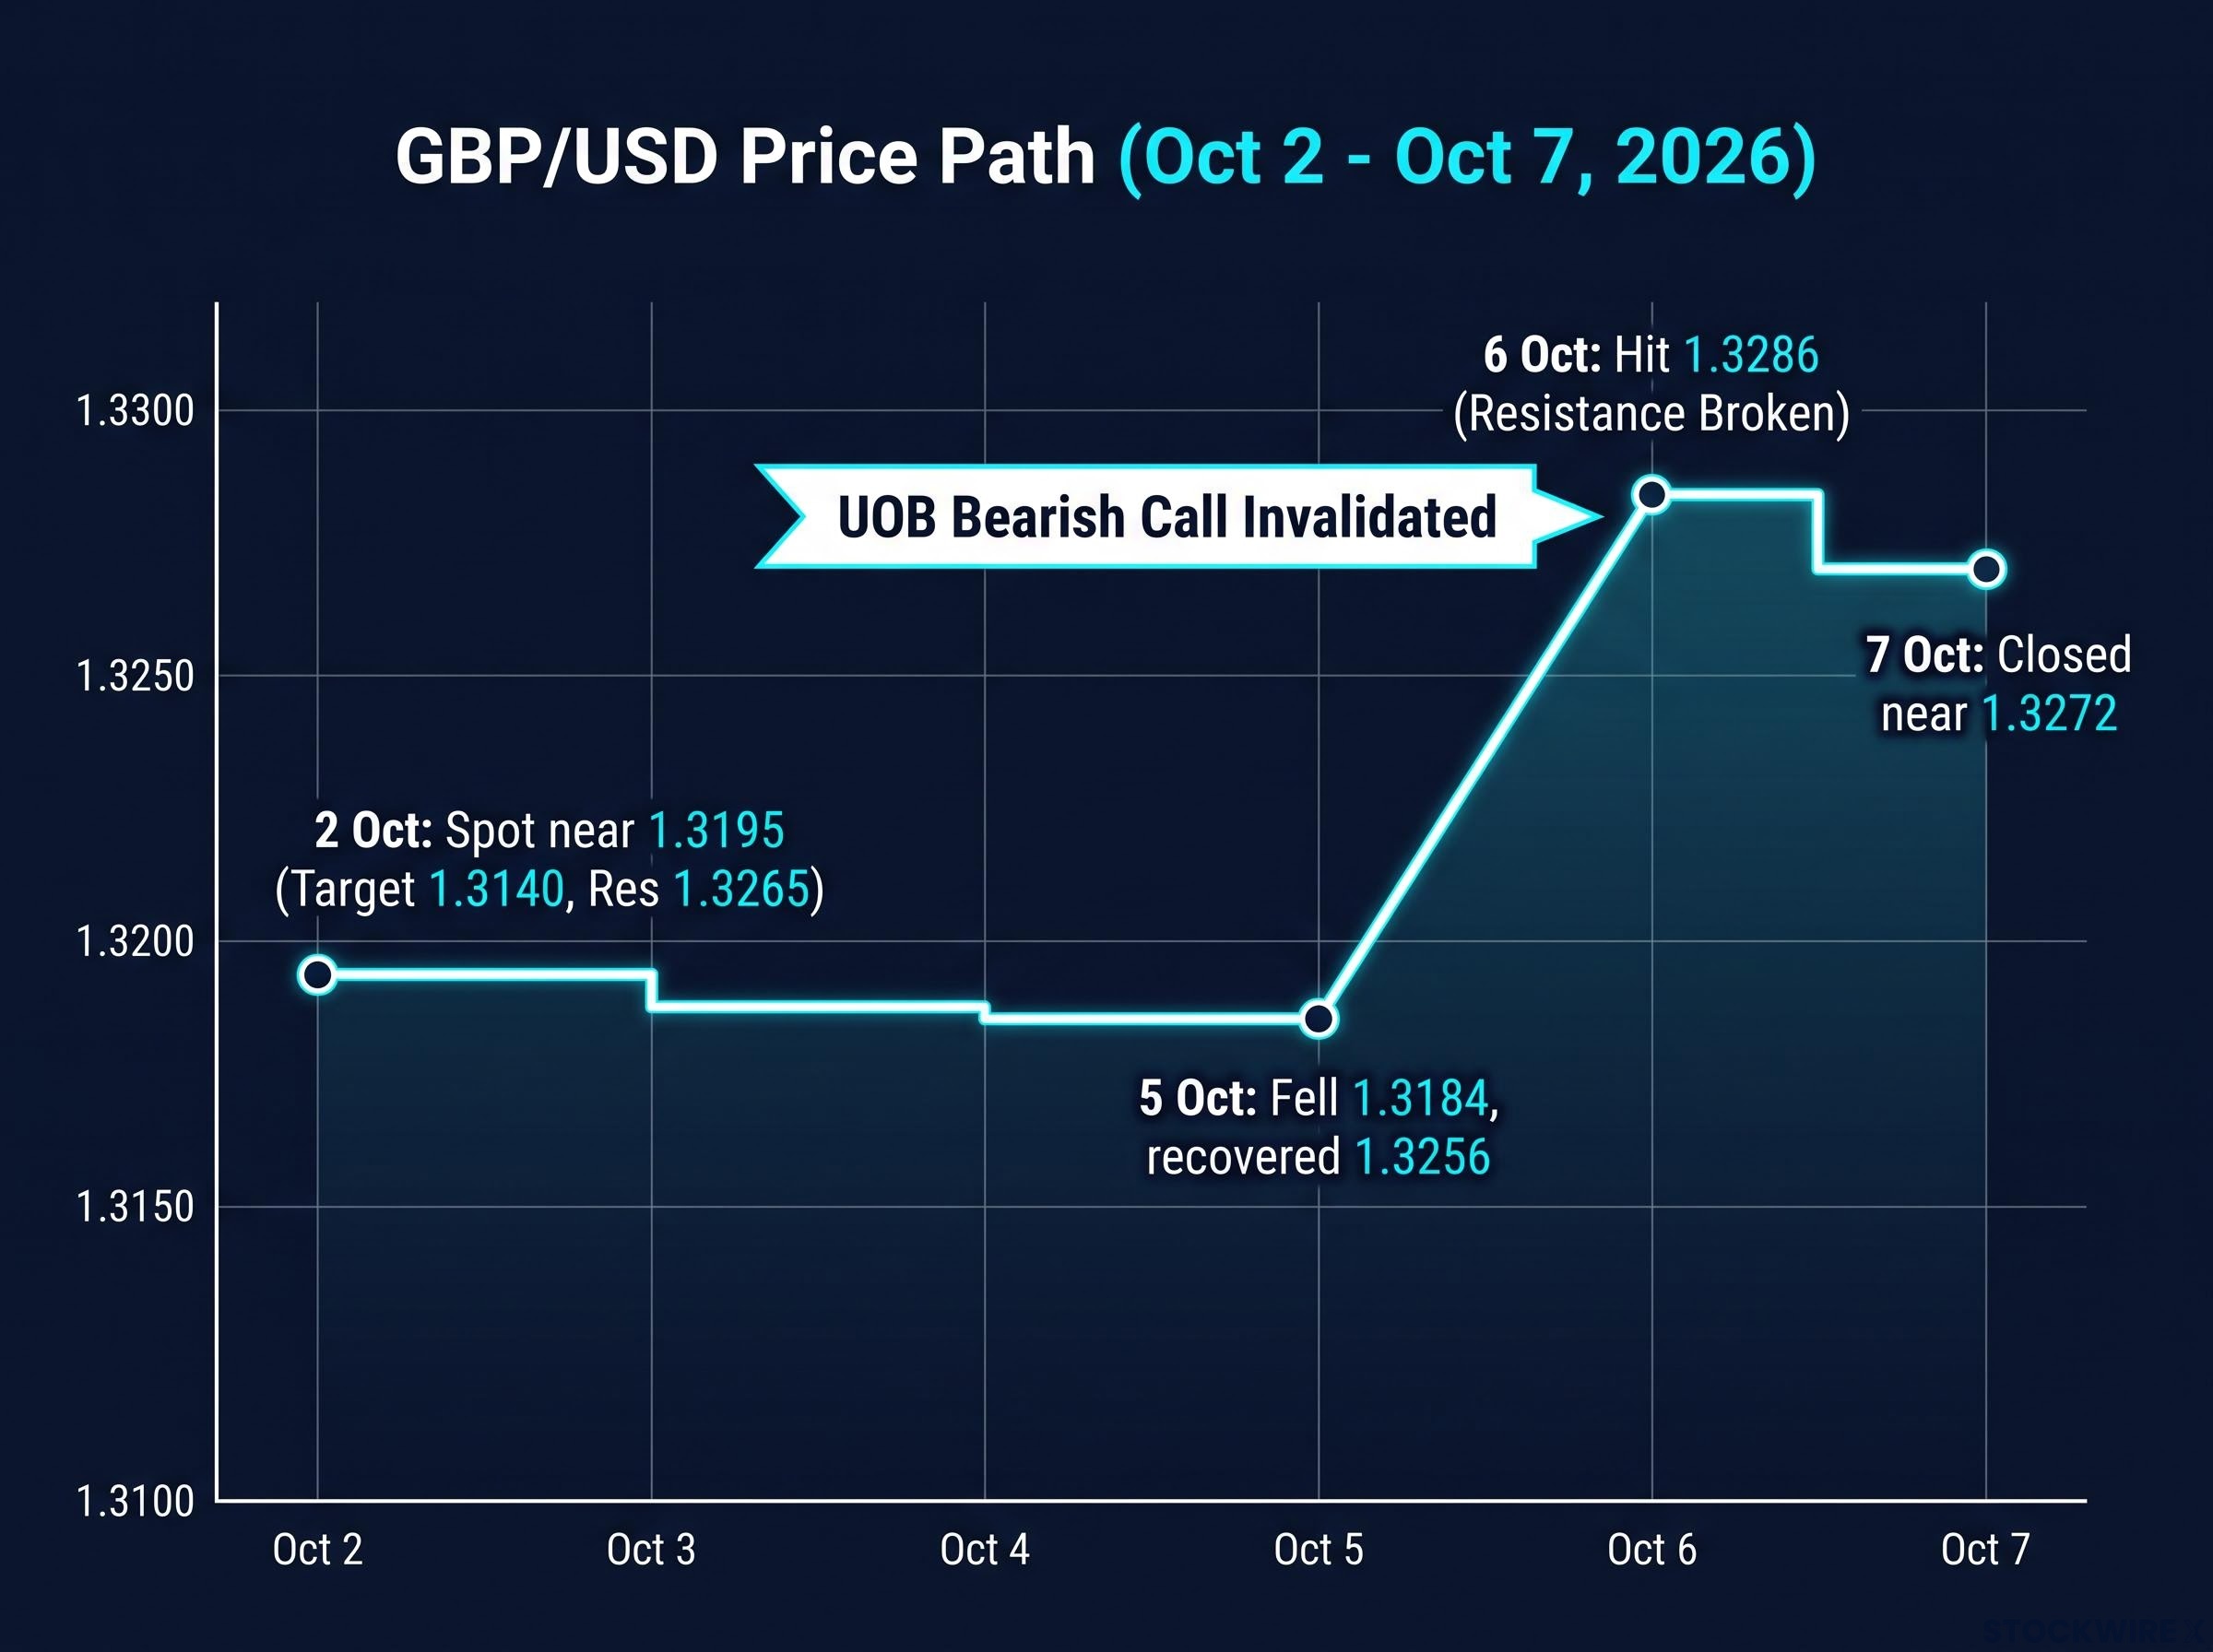
On 2 October 2026, UOB described its sterling view as mildly bearish, but only “as long as” the pound stayed below 1.3265. Four days later, GBP/USD traded as high as 1.3286 on 6 October, and it closed near 1.3272 on 7 October. If a forecast can reverse that quickly, it is fair to ask what it was worth.
The reversal is useful because it shows how a GBP/USD technical outlook is built. UOB strategists Quek Ser Leang and Lee Sue Ann have dropped their downside target of 1.3140. They now see a possible test of 1.3315.
The bank did not change its view because it changed its mind. The condition it set at the start was broken, and its own framework required a revision.
Here is what you get from the episode: the levels that now carry weight, the reasons the earlier calls failed, and a way to judge any bank’s chart forecast without either following it blindly or dismissing it.
What broke: how a 1.3265 breach overturned UOB’s bearish call
The setup looked tidy. The pound sat near 1.3195, momentum leaned lower, and UOB’s own levels pointed down.
- 2 October: With spot near 1.3195, UOB turned “slightly negative” on a 1-3 week view and targeted 1.3140. Its FX Insights note listed intermediate support at 1.3165 and resistance at 1.3215 and 1.3235.
- 5 October: GBP fell to 1.3184 and then recovered to 1.3256, above the range UOB expected. The note said plainly: “our view was incorrect.”
- 6 October: The pair traded between 1.3202 and 1.3286 and closed around 1.3277. TradingEconomics recorded it at 1.3270, up 0.36% on the day.
- 7 October: The pair held its gains and closed near 1.3272.
The sideways call that missed
Going into Tuesday, UOB’s 24-hour view expected a range between 1.3195 and 1.3245, with no clear directional push. The high of 1.3286 finished above the top of that range by a wide margin.
A range call depends on both its ceiling and its floor holding. Once one gives way, the call no longer applies.
The bearish tilt that was invalidated
The 1-3 week call carried an exit condition from the beginning.
The condition: The mildly negative view would remain valid “as long as strong resistance at 1.3265 is not breached.”
The pound cleared that level, so the 1.3140 target no longer applied. The revision shows the framework doing its job. A break of a stated invalidation level is a signal for you to drop the old thesis, not to look for reasons to keep it.
When big ASX news breaks, our subscribers know first
The new level map: supports and resistances traders are watching
UOB’s revised view comes with a new set of levels. Each level has a specific role in the forecast, so it helps to read them as a structure rather than as a list of numbers.
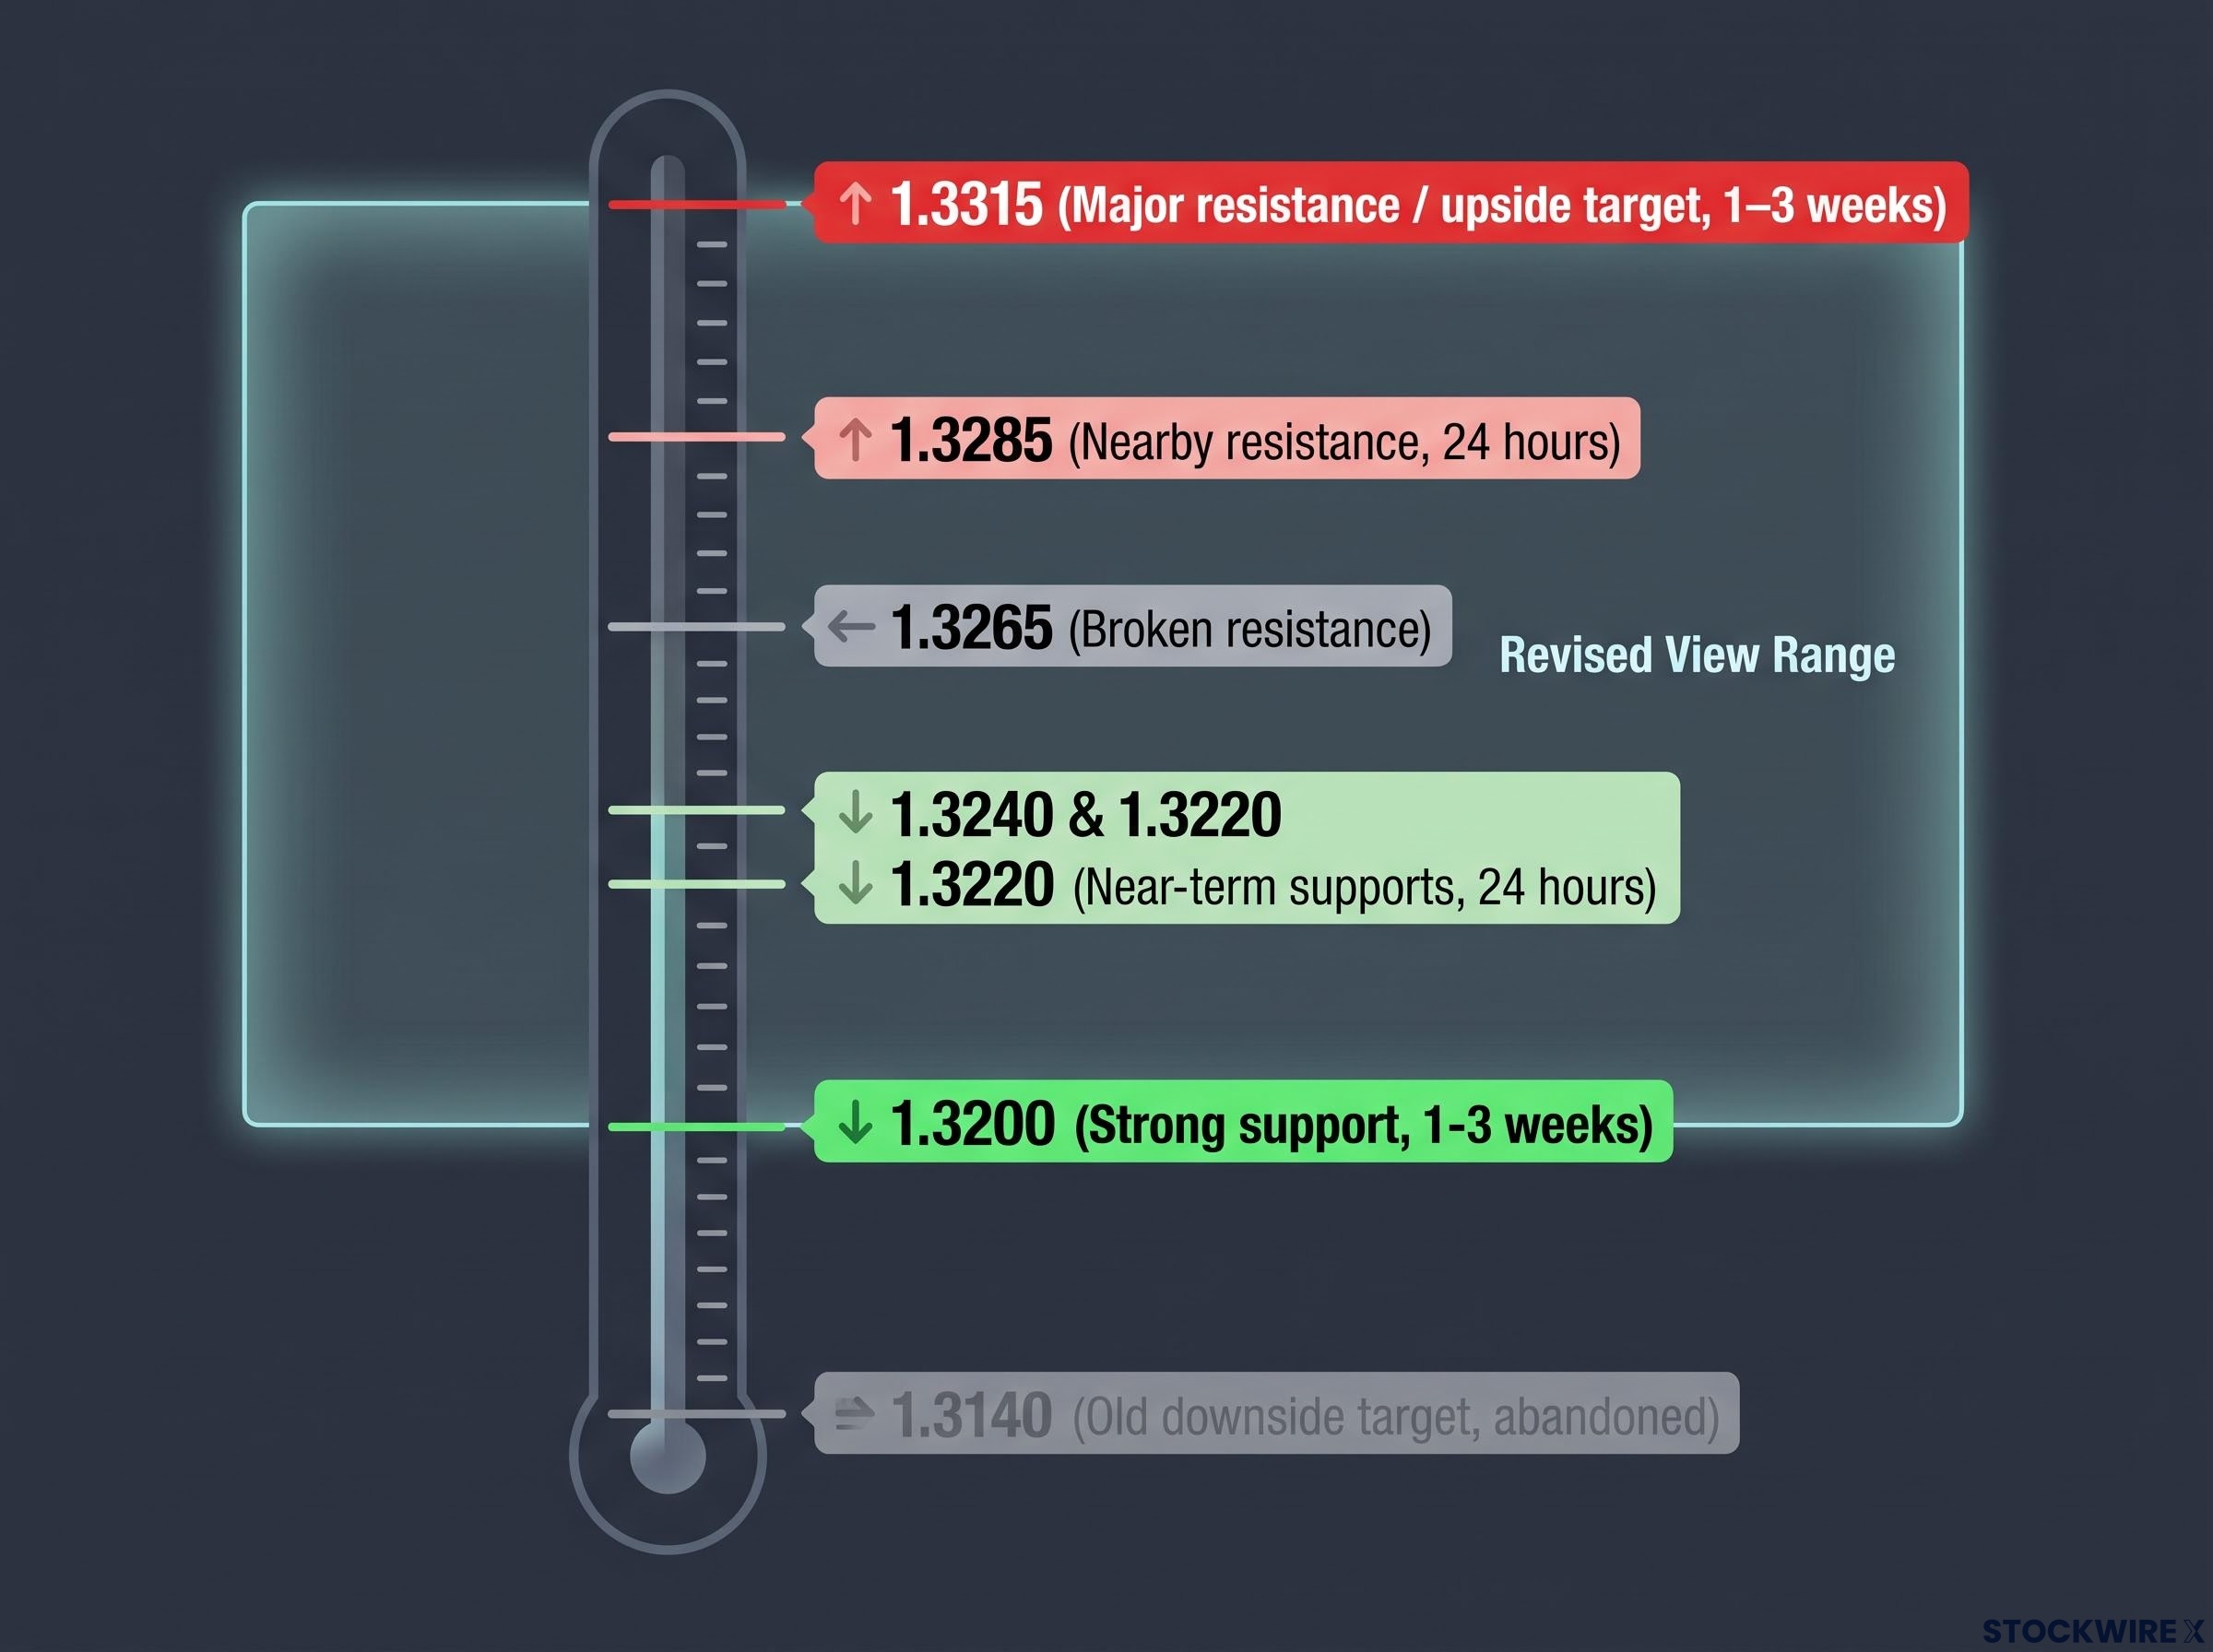
Over the next 24 hours, UOB says upward momentum has picked up “not by a large margin.” A retest of 1.3285 is possible, but the bank considers a further climb improbable. Over 1-3 weeks, it sees GBP possibly edging toward 1.3315. That mild upward momentum only holds while the pair stays above 1.3200.
- 24-hour view: possible retest of 1.3285, supports at 1.3240 and 1.3220, further gains seen as unlikely.
- 1-3 week view: possible drift toward 1.3315, with strong support at 1.3200.
| Level | Role | Timeframe | What a break would mean |
|---|---|---|---|
| 1.3140 | Former major support and old downside target | 1-3 weeks (abandoned) | No longer part of the active view |
| 1.3200 | Strong support | 1-3 weeks | Mild upward momentum would no longer hold |
| 1.3220 / 1.3240 | Near-term supports | 24 hours | Short-term upward push weakening |
| 1.3265 | Former strong resistance, now broken | 1-3 weeks | Its breach ended the bearish tilt |
| 1.3285 | Nearby resistance | 24 hours | A move beyond it, which UOB considers improbable |
| 1.3315 | Major resistance and upside target | 1-3 weeks | An earlier UOB note said a breach would indicate the GBP advance had ended |
Two levels decide how this plays out. 1.3200 determines whether the upgrade survives. 1.3315 is a ceiling UOB does not expect to be seriously tested. If price action stays between them, the revised view still applies.
Ceilings like 1.3315 are often treated as trend exhaustion zones, and structural tools such as Fibonacci extensions and prior swing levels help you judge whether a level deserves that weight or is simply a round number.
Why did sterling rally? The macro backdrop behind the chart
Price levels show where the pound moved. They do not explain why it moved, and the reasons in this case are disputed.
In early September, renewed U.S.-Iran hostilities pushed the dollar higher. On 1 September, Reuters had sterling near 1.35395, about 1% below its late-August six-month high of 1.36745. By 24 September, the pound had fallen to $1.3222, its lowest level since 1 July and its fourth consecutive daily decline. Fed Chair Kevin Warsh had signalled further tightening.
Sterling then found support. By 28 September it had recovered to about $1.3259, up from a three-month low of $1.3204 the previous week, as traders increased bets on tighter Bank of England (BoE) policy.
Institutions read that rebound differently:
- ING: Francesco Pesole said rising UK homebuilder stocks might be drawing foreign inflows, which, along with BoE tightening bets, gave sterling short-term support. He also doubted the BoE would raise rates sharply and expected the pound to struggle in the coming months.
- MUFG: The UK economy has held up better than expected, but this has not yet pushed domestically generated inflation higher. That weakens the argument for an aggressive BoE.
- UOB: Its view is mainly technical and is not explicitly linked to BoE or Fed policy.
The bigger picture: Even after the 6 October rise, TradingEconomics shows the pound about 2% weaker over the past month and down 1.15% over 12 months.
A chart breakout can happen while the monthly trend is still weak and institutions disagree about the fundamentals. For you, that makes the rally a short-term signal rather than a confirmed change in direction.
How to read momentum-based forecasts, and where they fail
UOB’s reversal does not mean bank forecasts are useless. It shows how they are meant to be used. The starting point is how these calls are constructed.
The basics: support, resistance and invalidation
Support is a price zone where buyers have previously stopped declines. Resistance is a zone where sellers have previously stopped rallies. An invalidation level is the price that, if broken, cancels the forecast.
In UOB’s case, 1.3265 was both strong resistance and the invalidation trigger. The rule works the same way for upward views: a break of key support ends a bullish bias. That is why 1.3200 now carries so much weight.
Combining moving averages, RSI behaviour, layered levels and macro direction into one GBP/USD technical analysis framework is what lets you test a forecast against several independent signals rather than trusting a single bank’s levels.
You can apply four steps to any technical note:
- Identify the condition: what has to stay true for the call to hold.
- Note the invalidation level: the exact price that ends the call.
- Check the timeframe: a 24-hour view and a 1-3 week view are different forecasts.
- Cross-check the macro context: central bank expectations can confirm or override the chart.
Where forecasts break down
Past calls show how these forecasts can miss.
| Episode | Expected | What happened | Lesson |
|---|---|---|---|
| 6 October 2026 | Range of 1.3195-1.3245 | High of 1.3286 | Ranges can be broken decisively |
| 22 September 2026 | Possible test of 1.3335, doubt over 1.3300 | Traded 1.3366-1.3399, called “deeply oversold”, with a 1.3435 break needed to confirm stabilisation | A clear trigger tells you when the view changes |
| October 2025 | Range trading | Plunge to 1.3280 | The direction can be right while the speed is wrong |
Three weaknesses come up repeatedly. False breakouts and overshoots can push price past a range. Event risk, such as energy prices, geopolitics or central bank comments, can change a trend within hours. Relying on a single bank also leaves you exposed to one framework, and UOB revises its 24-hour calls often, which shows how quickly intraday views can be overtaken.
The useful approach is to treat a momentum forecast as a conditional map with a built-in exit. Judge it by its invalidation level more than by the direction in the headline.
What the breakout settles, and what it leaves open
Some questions are now answered. UOB’s sideways and bearish calls no longer apply. The replacement view is cautious and sits between 1.3200 and 1.3315, and UOB itself describes the improvement in momentum as modest.
Three things are worth watching:
- Whether 1.3200 holds as support
- Whether 1.3285 is retested
- Whether 1.3315 is approached or broken
Technical levels can help you judge timing, but read them alongside BoE and Fed expectations, because those can override a chart call. If the pound stays inside UOB’s range, the revised view still applies. If it breaks either boundary, set the view aside, as UOB did with its own call this week.
Central bank forward guidance often moves a currency more than the rate decision itself, which is one reason a chart call can be overridden when BoE or Fed signals shift market pricing of the policy path.
Past performance does not guarantee future results. Financial projections are subject to market conditions and various risk factors. This article is for informational purposes only and should not be considered financial advice. Investors should conduct their own research and consult with financial professionals before making investment decisions.