
A 66-year backtest of one of the most widely followed signals in retail trading, the golden cross, shows approximately 79% winning trades. That sounds like a strong edge. Yet the annual return advantage over simply buying and holding the S&P 500 is modest at best. If one of the most recognised signals in technical analysis barely moves the needle on its own, the implication lands quickly: the signal is not the edge.
The problem is not the indicators themselves. It is the way most traders interpret them. A fired signal feels like confirmation. It is not. It is a probabilistic tilt, a slight lean in one direction, and treating it as certainty is one of the most common and costly mistakes in retail trading. The real question is what happens when you stack multiple independent signals together, and whether the improvement is meaningful enough to change your results.
Here is the framework that answers that question. After this, you will have a structured way to evaluate any trade setup you encounter, a method for estimating whether your edge is thin or real, and a practical plan for managing the trades that still go wrong, because they will.
Every signal is a probability, not a prediction
The instinct is almost universal among new traders: the indicator fired, therefore the trade is confirmed. It feels logical. The chart pattern appeared, the crossover triggered, the momentum reading ticked into the right zone. That should mean something.
It does mean something. It means the odds have tilted slightly in your favour. That is all it means.
Technical analysis does not produce certainties. It produces probabilistic hints. Every indicator, regardless of how well-known or widely backtested, is offering you a statistical tilt, not a guarantee. The distinction sounds academic until you see what it looks like in practice.
The 66-year anchor: A backtest of the 50/200-day golden cross on the S&P 500, spanning approximately 66 years, shows roughly 79% winning trades with an average gain per trade of approximately 15.8-16%.
Those numbers are real. They are also incomplete. Despite that 79% win rate, the strategy’s annual return advantage over doing nothing (buying and holding the index) is only modest. Being right most of the time is not the same as having a meaningful edge, and that gap is the single most important concept to absorb before building any trading framework.
Win rate is only half the picture: trading expectancy, calculated as (Win Rate x Average Win) minus (Loss Rate x Average Loss), is the metric that reveals whether a strategy has a genuine mathematical edge across a meaningful sample of trades, and a 79% win rate with thin average gains can still produce a weaker expectancy than a 40% win-rate strategy with asymmetric reward ratios.
Large-scale optimisation studies reinforce the point. Across thousands of moving-average crossover parameter combinations and multiple markets, the great majority of raw crossover rules show negative expectancy. The signal on its own rarely delivers a strong standalone edge. What matters is what you do with it.
When big ASX news breaks, our subscribers know first
The golden cross as a case study in what one signal can and cannot do
The golden cross occurs when a stock’s 50-day moving average crosses above its 200-day moving average, a signal that longer-term momentum has shifted to the upside. Its inverse, the death cross (the 50-day crossing below the 200-day), signals the opposite. Both are among the most widely followed technical indicators in retail trading, and both are worth understanding honestly.
What backtests consistently show is that the golden cross does deliver a real probabilistic edge. It tilts odds in favour of gains, it reduces drawdowns relative to unfiltered buy-and-hold, and across decades of data it has been more right than wrong. That is the good news.
The bad news is where it falls short:
- Regime sensitivity: The golden cross performs best in sustained trending environments and struggles in ranging or choppy markets, where it generates repeated false signals.
- Whipsaw risk: In sideways markets, the 50-day and 200-day averages can cross back and forth repeatedly, triggering entries and exits that erode capital through transaction costs and small losses.
- Drawdown magnitude: Even well-tuned golden cross strategies show maximum drawdowns of approximately 30% or more, despite reducing drawdowns relative to unfiltered buy-and-hold.
- Delayed resolution on death crosses: Many death cross signals have temporarily moved against the anticipated direction before ultimately resolving bearishly, punishing traders who acted without a defined exit plan.
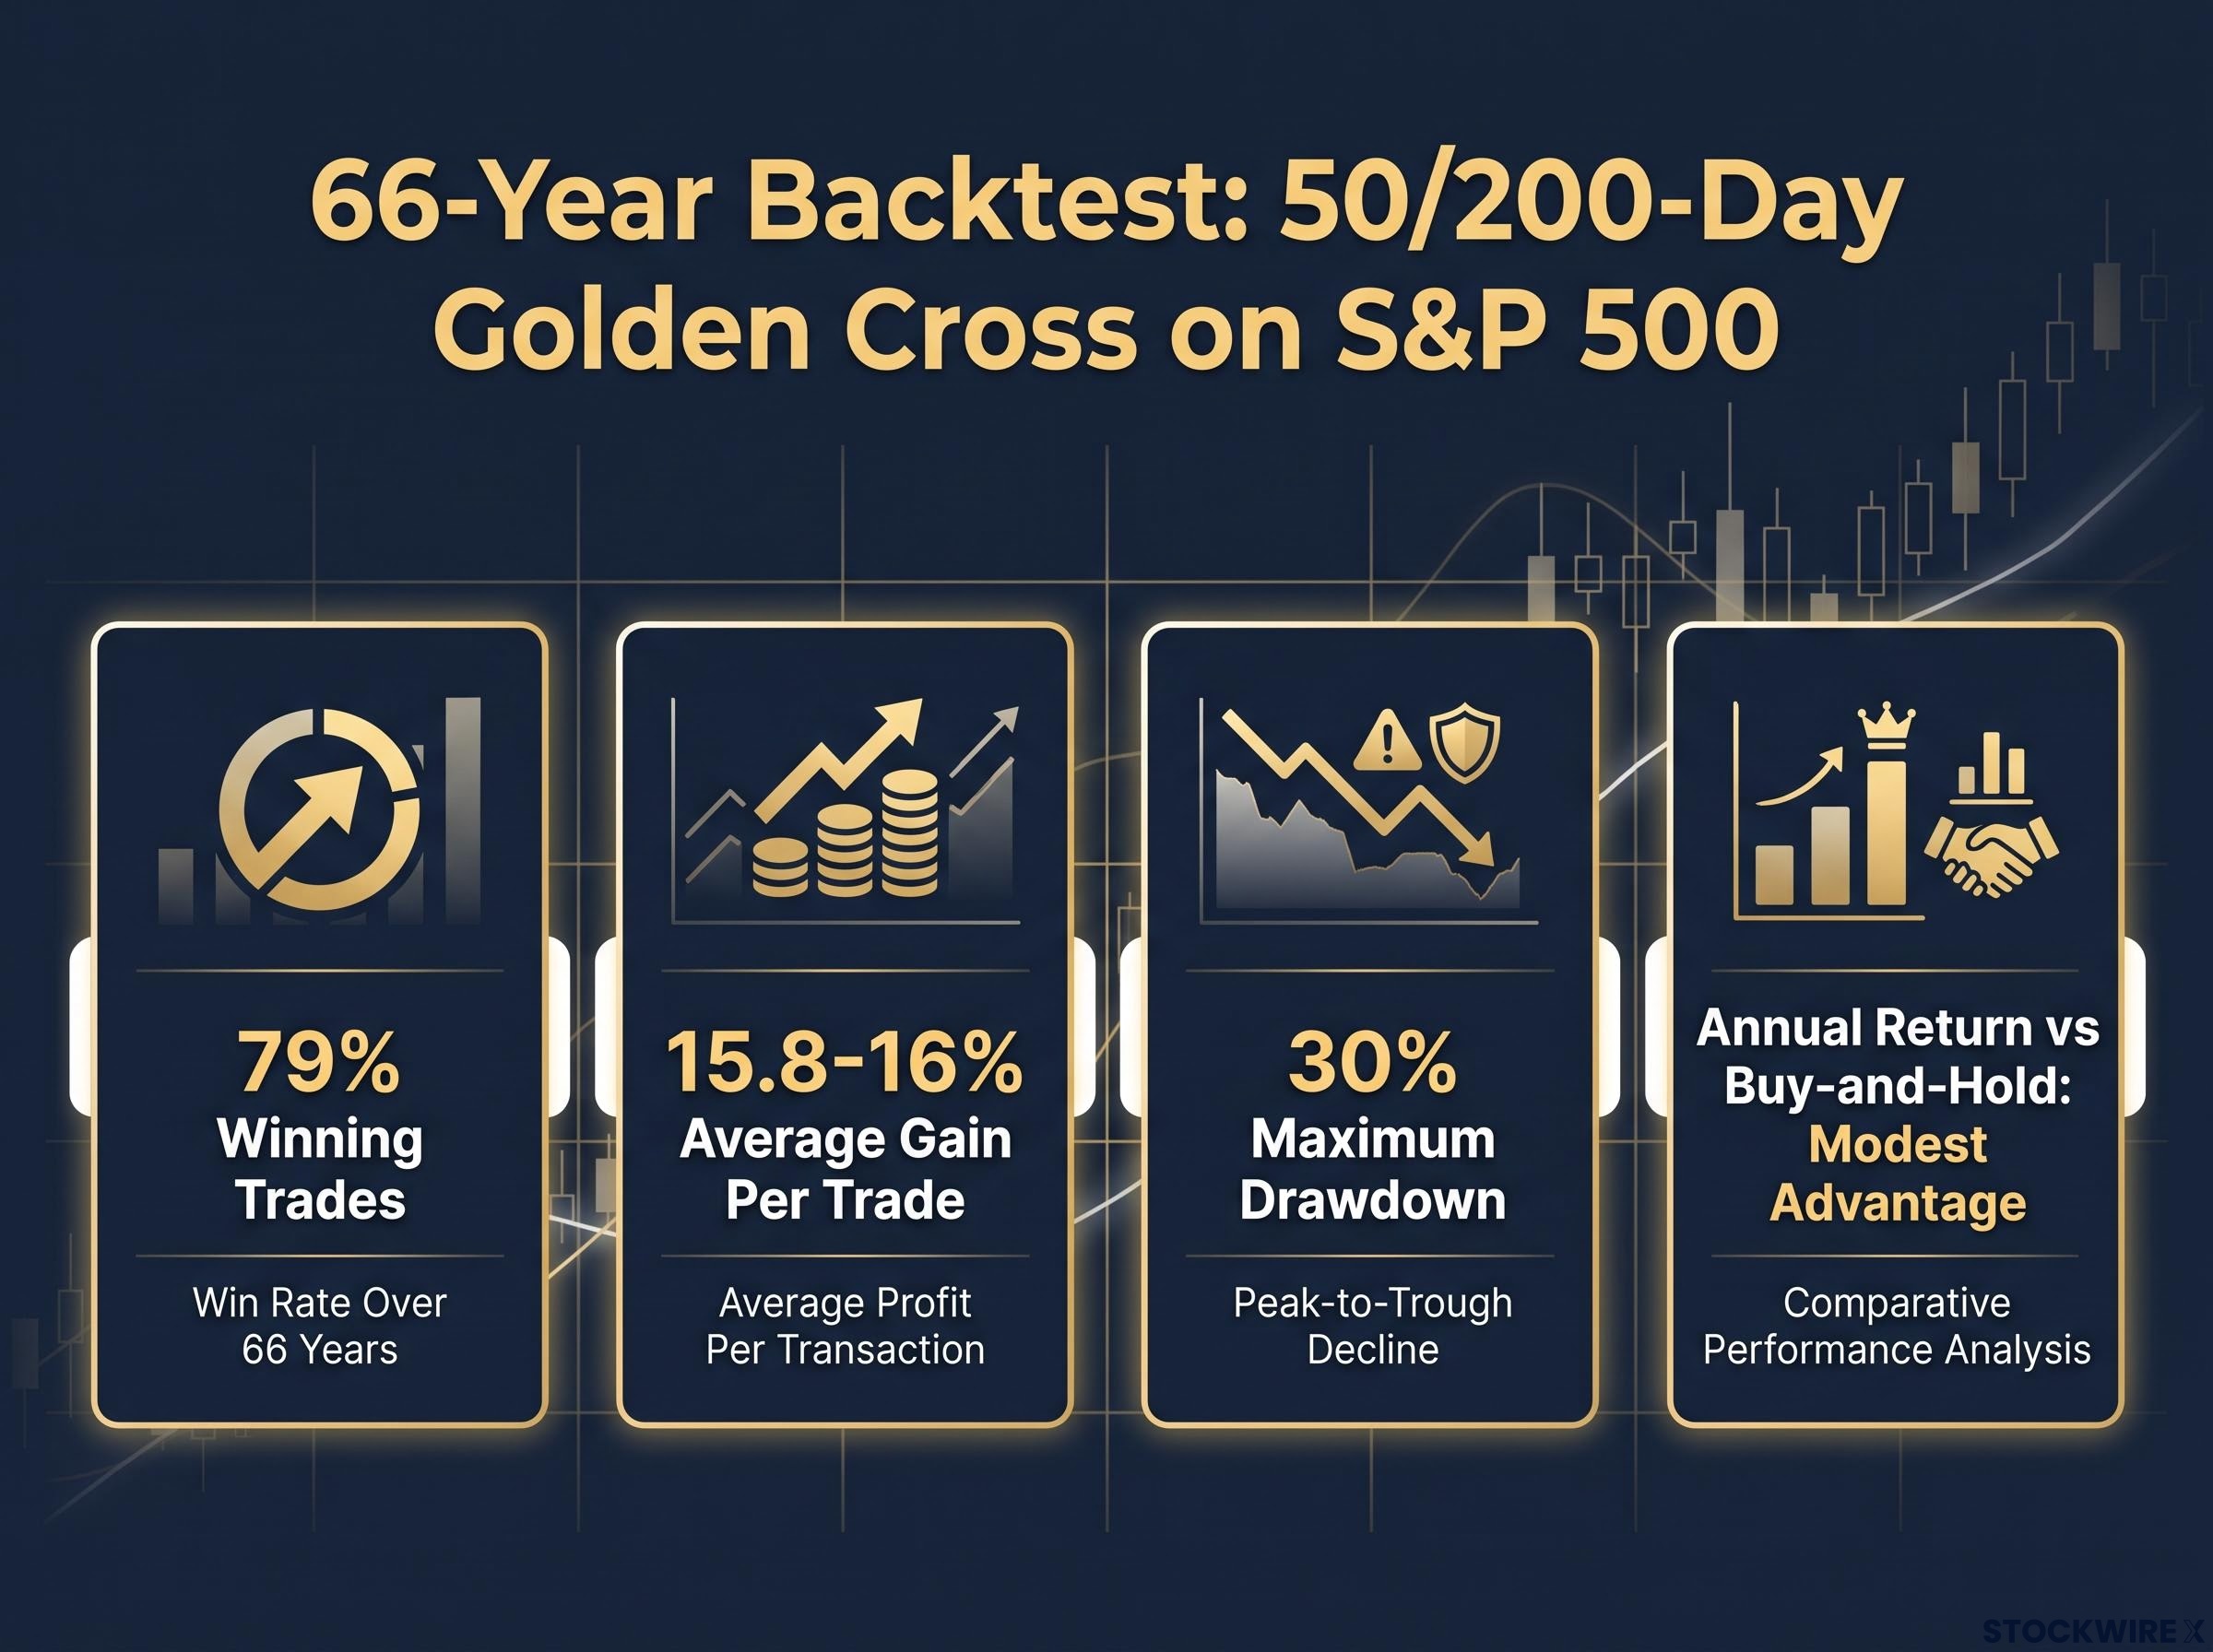
| Metric | What backtests show |
|---|---|
| Win rate | Approximately 79% winning trades |
| Average gain per trade | Approximately 15.8-16% |
| Maximum drawdown | Approximately 30% or more |
| Annual return vs. buy-and-hold | Modest advantage only |
A 30% drawdown on a strategy with 79% winning trades should stop you. It tells you that win rate alone is an incomplete picture of any signal’s quality. Understanding how badly a strategy can lose, and when, is as important as understanding how often it wins. Research consistently recommends back-testing crossover signals independently before applying them in live conditions, precisely because these limitations are invisible until you measure them.
The golden cross is a starting point for analysis. It is not a conclusion.
CXO Advisory’s golden cross research, which tracks these signals on the S&P 500 back to 1950, quantifies the average cumulative return profiles and maximum drawdowns following each crossover event, giving you a data-grounded benchmark against which to measure any setup you encounter.
How stacking independent confirming factors shifts the odds in your favour
If a single signal offers only a modest tilt, what happens when you add a second one that agrees? And a third?
Lawton Ho of Verified Investing uses a heuristic probability ladder to illustrate the effect. The framework is a conceptual teaching tool, not a fixed law of markets, but it captures a principle that backtested data consistently supports:
- One confirming factor (for example, the golden cross on its own): estimated probability of approximately 60% that the trade moves in the anticipated direction.
- Two independent confirming factors (for example, the golden cross plus high-volume participation): estimated probability rises to approximately 80%.
- Three independent confirming factors (for example, the golden cross plus high volume plus weekly uptrend alignment): estimated probability reaches approximately 85%.
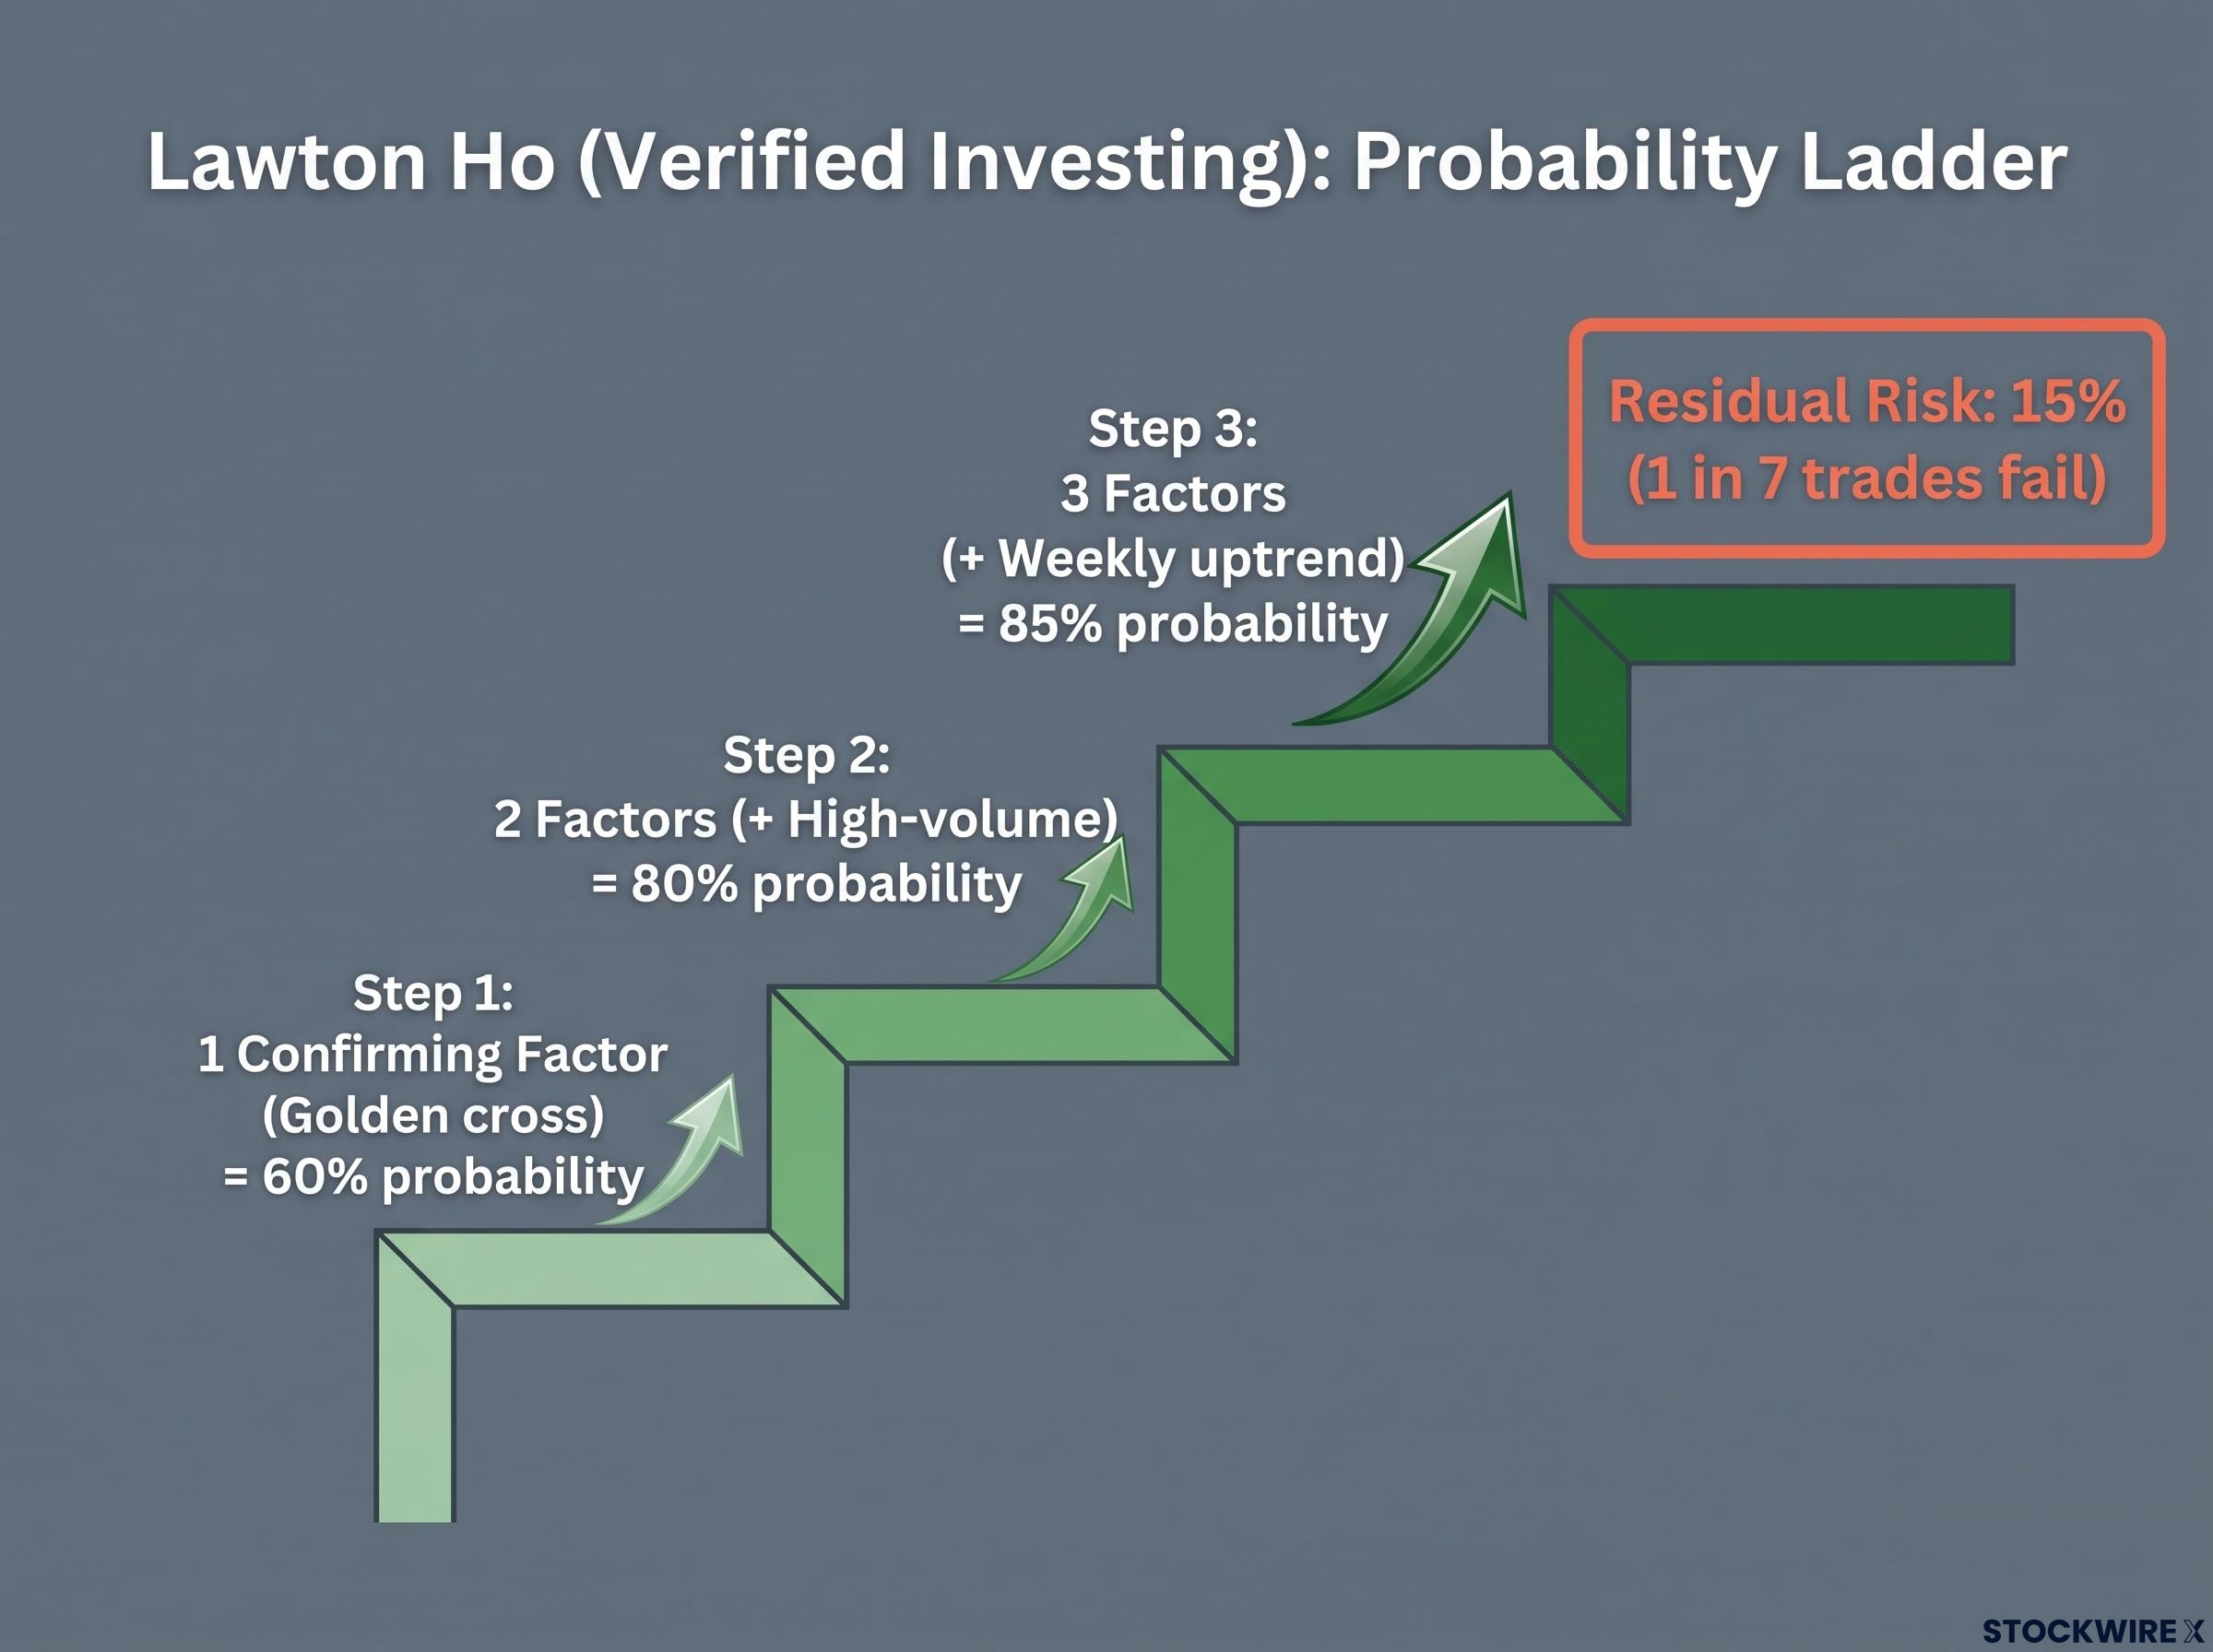
The jump from one factor to two is larger than the jump from two to three. That is not a flaw in the framework. It reflects the reality that genuinely independent evidence becomes harder to find as you add more factors, and correlated variables yield diminishing improvements in predictive power.
The residual that matters: Even with three confirming factors, a roughly 15% probability remains that the trade does not perform as expected. That is not a footnote. It is the structural reason why risk management is not optional, and it means even a well-constructed setup will fail roughly one trade in seven.
What counts as a genuine confirming factor (and what does not)
Adding a second momentum indicator alongside the first, for example pairing MACD (Moving Average Convergence Divergence, a tool that measures the relationship between two moving averages to gauge momentum) with RSI (Relative Strength Index, a measure of how overbought or oversold a stock may be), does not constitute independent confirmation. Both measure the same analytical dimension. They are asking the same question through a different mathematical lens.
Genuine confirming factors should come from different analytical families:
- Trend: The direction and structure of price over time
- Volume: The level of participation and conviction behind price movement
- Momentum: The rate of change and overbought or oversold conditions
- Price structure: Support levels, resistance levels, and chart pattern context
- Market context: Broader regime, sector alignment, and macro environment
One factor per family is the practical rule. Backtests support this: golden cross signals confirmed by high volume outperform low-volume crosses in accuracy. Golden cross signals occurring within a weekly uptrend show better risk-adjusted results than those appearing in ranging or downtrending environments. Each additional layer of genuine independence answers a different question about the trade, and the combined picture is materially stronger than any single reading.
The trade-off you accept when you raise the bar for entry
There is a cost to requiring multiple confirming factors before entering a trade, and you should understand it clearly: you will take fewer trades.
This is not a side effect. It is the point.
Filtering golden cross signals for higher-timeframe uptrends or favourable market regimes consistently shows better risk-adjusted returns and fewer whipsaws, but it also produces fewer total qualifying setups. Research on multi-indicator agreement points in the same direction: trades taken only when multiple independent indicators agree show meaningfully fewer false breakouts compared to single-signal entries, at the cost of sitting out more marginal opportunities.
| Dimension | Single-signal approach | Three-factor confluence approach |
|---|---|---|
| Qualifying setups | More frequent | Significantly fewer |
| Estimated win rate | Lower (approximately 60%) | Higher (approximately 85%) |
| Drawdown profile | Larger, more frequent whipsaws | Reduced drawdowns, fewer false entries |
| Patience required | Low | High |
If you have been frustrated by frequent whipsaw trades or small losses that quietly compound into larger ones, the solution is not a better single indicator. It is a higher bar for entry. Raising that bar costs you participation in marginal setups, the ones with the thinnest probabilistic edge, while protecting your capital on the setups that would have failed.
Remember that large-scale optimisation studies show the great majority of raw moving-average crossover combinations have negative expectancy. Selectivity is not a preference. It is a requirement.
A trader using a three-factor confirmation checklist may go weeks without entering a trade. That is not the framework failing. That is the framework working exactly as designed.
Building your risk plan around what no combination of signals can eliminate
You have the probability ladder. You know how to stack independent confirming factors from different analytical families. You understand that a three-factor setup tilts the odds meaningfully in your favour.
None of that eliminates the 15%.
Even well-tuned golden cross strategies with multiple filters show maximum drawdowns of approximately 30% or more. A strategy with a strong historical win rate can still produce brutal individual losses. That is not a failure of the approach. It is a structural feature of probabilistic markets, and the only thing that prevents those losing trades from becoming account-ending events is a plan you commit to before you enter the trade.
Every trade you take should be built around three questions, answered before you open the position:
- Where am I wrong? Define the specific price level or condition that invalidates your setup. If the trade reaches that point, the thesis is broken and you exit, no reassessment, no hoping.
- How much am I willing to lose? Pre-commit to a maximum dollar or percentage loss on this position. This is not a suggestion; it is a hard boundary. Deciding after the loss begins is how small losses become large ones.
- What does success look like? Establish your target or exit criteria in advance. Without a defined target, profitable trades get exited too early out of fear or held too long out of greed. Both erode the edge your setup provided.
Fixed-dollar risk positioning resolves the pre-entry risk question mechanically: once a stop level is set, position size is calculated as maximum dollar loss divided by the distance between entry and stop, removing any discretionary sizing decision that might otherwise expand under conviction pressure.
“No combination of confirming factors eliminates the residual risk. The plan you build before entry is what determines whether losing trades are recoverable or terminal.”
The 15% residual across many trades means you should expect a meaningful number of losing trades even when your process is working correctly. A disciplined trader with a genuine probabilistic edge and a pre-committed risk plan turns those losses into manageable costs of doing business. A trader without that plan turns them into the reason they stop trading.
For readers wanting to stress-test their pre-entry risk frameworks against real drawdown scenarios, our dedicated guide to managing drawdowns with conviction examines how pre-written thesis documents with explicit exit conditions distinguish disciplined reassessment from panic at the depth of a loss.
This article is for informational purposes only and should not be considered financial advice. Investors should conduct their own research and consult with financial professionals before making investment decisions. Past performance does not guarantee future results. Financial projections are subject to market conditions and various risk factors.
Stacking signals for the long game, not the next trade
The shift this framework asks you to make is conceptual as much as it is technical. Moving from single-signal thinking (the indicator fired, therefore I buy) to multi-factor confluence thinking (three independent factors agree and my risk plan is set, therefore I enter) is a change in how you relate to uncertainty itself. You stop seeking certainty and start seeking favourable probability with defined downside.
The practical steps are repeatable. Build a confirmation checklist. Choose your confirming factors from different analytical families. Set your three pre-entry risk questions before every trade. Then wait. The setups that pass all your filters will be fewer. They will also be better.
The traders who compound returns over time are not the ones who found the best single indicator. They are the ones who built the discipline to wait for genuine multi-factor alignment and managed risk consistently when setups failed. The edge is not in any one signal. It is in the process you build around all of them.