
Eli Lilly at 40x Earnings: Expensive Stock, Underpenetrated Market
1 hr ago

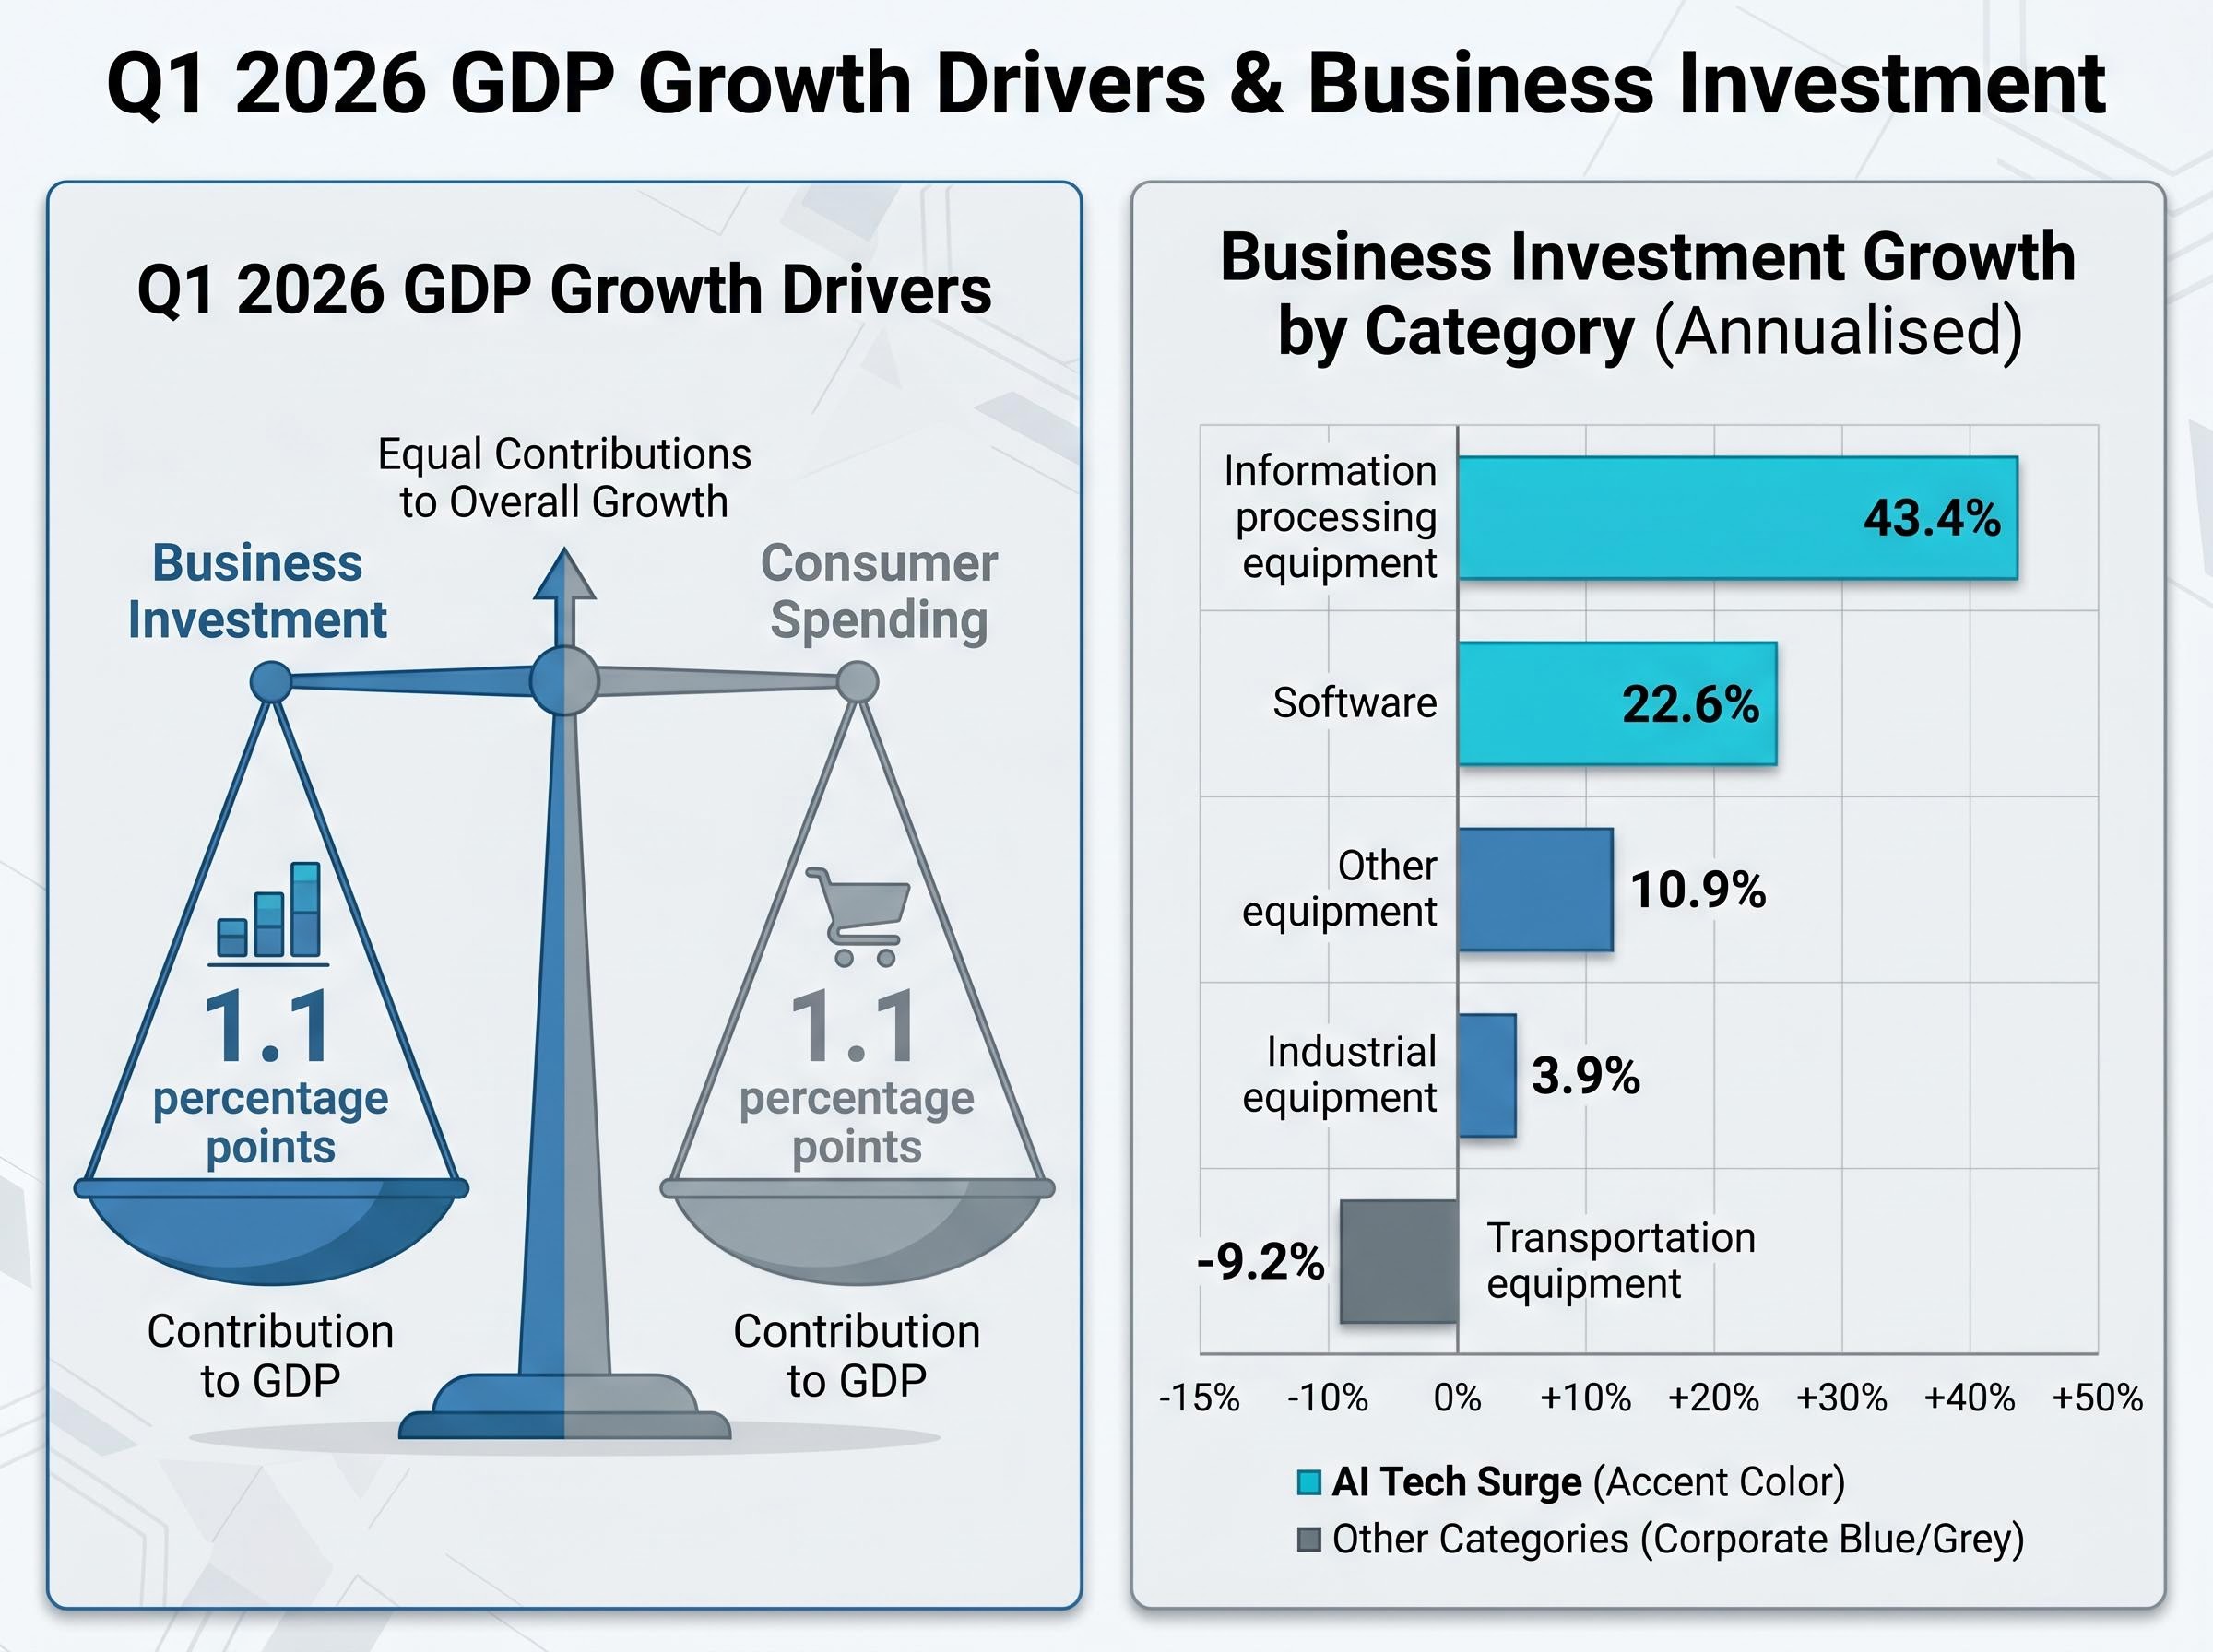
The US economy grew at 2.0% annualised in Q1 2026, according to the Bureau of Economic Analysis (BEA) advance estimate. The headline figure tells one story. The underlying data tells three very different ones. Business investment surged at 10.4% annualised, its fastest pace since Q2 2023, contributing 1.1 percentage points to GDP, the same number as all of consumer spending combined. That single ratio reframes the conventional understanding of what is powering US economic growth right now, and what is quietly stalling beneath the surface.
Three distinct currents ran through the quarter simultaneously: an AI-driven capital expenditure boom of historic proportions, a normalisation of goods imports after a tariff-induced boom-bust cycle, and an energy-price spike that distorted inflation readings without yet derailing household spending. Each force tells a different story about where momentum is building and where vulnerability is concentrating. What follows unpacks each current with the underlying data, explains what the Q1 numbers actually signal versus what they obscure, and maps the risks that will determine whether Q2 2026 represents continuation or inflection.
The gap between the 2.0% headline and the 2.5% domestic demand reading is where the quarter’s actual narrative lives. Strip out the trade deficit, which widened sharply as goods imports surged 25.8% annualised, and the underlying economy performed materially better than the top-line number suggests. The import rebound is a GDP accounting artefact, not an economic weakness; imports subtract from the headline calculation even when they reflect healthy business restocking.
The BEA advance estimate for Q1 2026 places domestic demand growth at 2.5% annualised, half a percentage point above the headline figure, with the divergence driven entirely by the mechanical subtraction of surging goods imports rather than any deterioration in underlying private sector activity.
Domestic demand grew at 2.5% annualised in Q1 2026, half a percentage point above the headline GDP figure. The divergence reflects the mechanical drag of surging imports, not underlying economic softness.
Context sharpens the picture further. Q4 2025 GDP was revised down to just 0.5% annualised, partly influenced by government shutdown effects, making Q1’s rebound appear sharper than the underlying trend warrants. The private sector composite of consumer spending, business investment, and residential investment grew at 2.2% annualised in Q1, up from 1.6% in Q4 2025.
The four main GDP components moved in distinctly different directions:
Finance readers who stop at 2.0% will misread the quarter. The domestic economy ran hotter than the headline allows.
Business investment grew at 10.4% annualised in Q1 2026, contributing 1.1 percentage points to GDP. That contribution matched consumer spending exactly, a ratio that has not occurred in over a decade and signals a structural shift in what is doing the economy’s growth work.
The disaggregation reveals an internally bifurcated story. Technology-intensive categories posted extraordinary gains while tariff-constrained categories continued to contract.
| Category | Q1 2026 Growth (annualised) | Q4 2025 Growth (annualised) | Direction |
|---|---|---|---|
| Information processing equipment | 43.4% | 37.0% | Accelerating |
| Software | 22.6% | 4.8% | Sharply accelerating |
| Industrial equipment | 3.9% | -3.6% | Recovering |
| Other equipment | 10.9% | Negative (sixth consecutive quarter) | Turning positive |
| Transportation equipment | -9.2% | Negative (multi-quarter contraction) | Contracting |
Information processing equipment grew at 43.4% annualised in Q1 2026, the second consecutive quarter above 37%. This category captures the servers, chips, and computing hardware at the centre of the AI infrastructure build-out.
Hyperscaler earnings reported on 30 April 2026 corroborate the BEA figures at the firm level. Microsoft reported AI annual recurring revenue (ARR) of $37 billion, up 123% year-over-year. Meta raised its capital expenditure guidance to $145 billion annually. Across the hyperscaler sector, capex growth is running at approximately 66% annually, with AI-related capital spending estimated at up to $700 billion sector-wide in 2026. The macro data and the earnings data are telling the same story: the AI investment boom is not a forward-looking assumption but a present-tense reality already visible in national accounts.
The scale of AI infrastructure investment running through the national accounts in Q1 2026 reflects hyperscaler capex commitments that now approach 2% of US GDP, a concentration of capital deployment with few historical precedents outside wartime industrial mobilisation.
The BEA categories that captured the Q1 surge, information processing equipment and intellectual property products, can feel abstract. In practice, AI infrastructure investment consists of four primary components:
These items flow into the equipment and intellectual property lines of the national accounts, which is why those categories posted such extraordinary growth in Q1.
Revenue is materialising for some participants. Microsoft’s AI ARR of $37 billion, growing at 123% year-over-year, represents the clearest example of commercial returns from the infrastructure build-out. Amazon and Alphabet also reported strong AI-related revenue growth in their Q1 2026 results.
The sector’s cumulative capex commitments now approach $700 billion for 2026 alone, and investor pressure to demonstrate returns is intensifying. Profitability at scale remains unresolved for the broader sector even as individual leaders show strong AI revenue. No clear signs of the investment cycle peaking have emerged as of Q2 2026, but the gap between capital deployed and returns realised across the full participant base leaves the durability question genuinely open.
A parallel signal reinforces the uncertainty. Across the broader economy, layoffs remain low but hiring is cautious, a pattern consistent with firms substituting capital for labour. The AI capex boom may be reshaping the composition of economic activity, not simply adding to it.
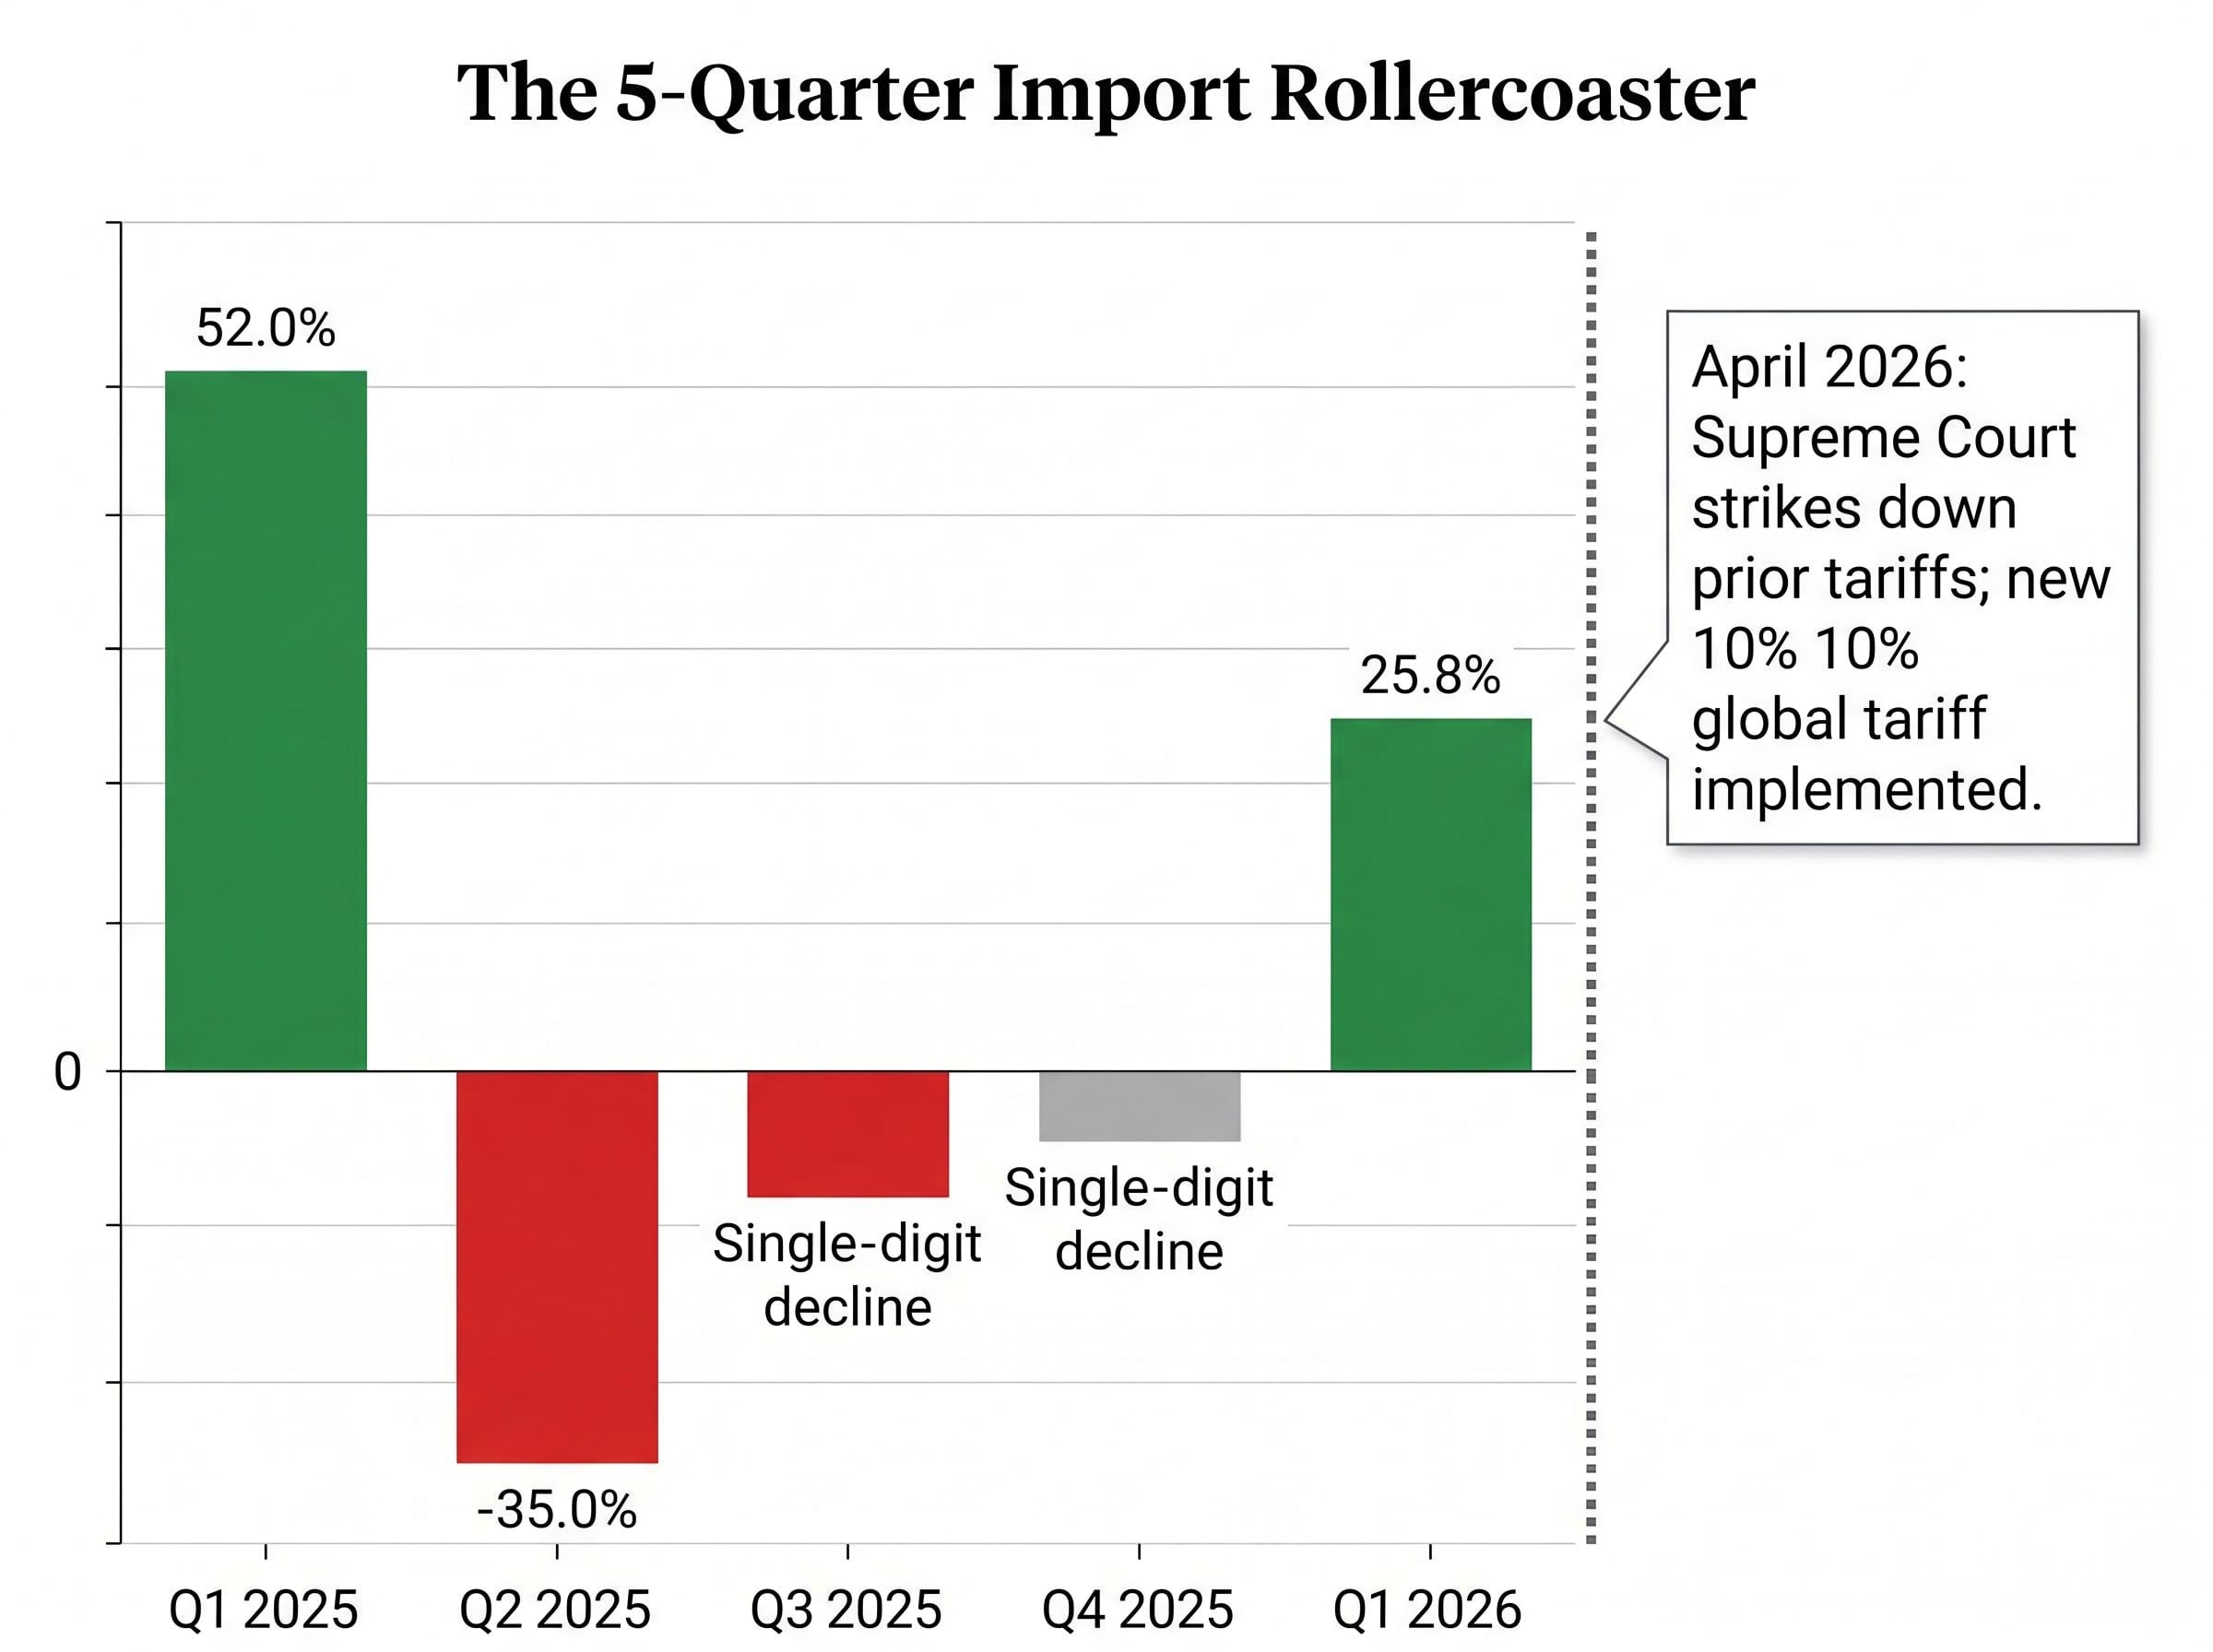
The 25.8% annualised surge in goods imports in Q1 2026 is not a fresh development. It is the third act of a cycle that began over a year earlier.
| Quarter | Goods import growth (annualised) |
|---|---|
| Q1 2025 | 52.0% |
| Q2 2025 | -35.0% |
| Q3 2025 | Single-digit decline |
| Q4 2025 | Single-digit decline |
| Q1 2026 | 25.8% |
The pattern is unmistakable: a tariff front-running surge in early 2025, a post-tariff collapse, two quarters of continued drawdown, and then a normalisation rebound. The BEA confirmed computers and parts as a prominent category in the Q1 2026 import surge, consistent with businesses rebuilding depleted inventories of technology goods.
Three factors drove the Q1 rebound:
Because imports subtract from GDP by accounting convention, this economically healthy restocking appeared as a headline headwind. The GDP arithmetic made a recovery look like a drag.
A fresh complication arrived in April 2026. The US Supreme Court struck down prior tariffs as illegal, and a new 10% global tariff was implemented in response. This tariff reset could trigger another round of import distortion heading into Q2, potentially restarting the boom-bust cycle that has clouded headline GDP readings for five consecutive quarters.
Headline PCE rose 0.7% month-over-month in March 2026, the largest monthly increase since June 2022. The reading demands context before conclusion.
Gasoline prices surged 15.5% in March 2026 (measured by gasoline station retail receipts), driven by the Middle East conflict’s impact on energy markets. That spike powered the headline number. Gasoline, however, represents approximately 1.7% of total US consumer spending. The exposure is real but bounded.
The Strait of Hormuz closure, which repriced WTI crude to $104.44 per barrel, is the supply shock behind the March PCE headline spike; it also represents the geopolitical constraint the Fed cannot model out of its inflation projections, because the duration of the disruption is unknown and the energy transmission into core services tends to lag the initial commodity move by two to three quarters.
The headline and core readings diverge on the dimensions that matter most:
Real personal consumption expenditures rose 0.2% month-over-month in March, in line with the monthly average since January 2022. Consumer spending absorbed the energy shock without collapsing. Real disposable personal income (DPI) edged down 0.1% month-over-month after inflation adjustment, a signal of quietly eroding purchasing power.
In 2021, the Federal Reserve treated above-target inflation as transitory, driven by supply-chain bottlenecks that would self-correct. The current above-target trajectory, headline PCE at 3.5% year-over-year and core at 3.2%, lacks that exit ramp. The OECD projects US inflation at 3% or above for full-year 2026. The Middle East conflict sustains upward pressure on energy costs with no resolution in sight.
The Fed held its policy rate at 3.50%-3.75% as of 29 April 2026. A single rate cut in 2026 remains a possibility, not a baseline certainty. The combination of tariff-driven cost pressures and geopolitical energy risk limits the Fed’s room to ease. A return to the 2% target is a 2027 proposition at the earliest under most current scenarios.
The FOMC dissent pattern at the April 2026 meeting, where four members voted in opposing directions simultaneously, signals a committee fracturing rather than shifting, a dynamic that complicates any attempt to read the Fed’s next move from the direction of individual dissents alone.
The three forces that shaped Q1 carry different levels of durability into Q2.
| Force | Q1 signal | Q2 outlook | Primary risk |
|---|---|---|---|
| AI capex boom | 10.4% business investment; hyperscaler confirmation | Likely to persist; no peaking signals | Return-on-investment scrutiny intensifies |
| Import normalisation | 25.8% goods import rebound (inventory restocking) | May reverse as new 10% tariff disrupts flows | April tariff reset restarts boom-bust cycle |
| Inflation and energy | Headline PCE 3.5% y/y; core decelerating modestly | Persistence likely; Fed easing constrained | Middle East conflict escalation |
Consumer spending grew at just 1.6% annualised in Q1, a modest deceleration from 1.9% in Q4 2025. Residential investment contracted at -8.0% annualised, subtracting 0.3 percentage points from GDP and marking the seventh contraction in eight quarters. Housing represents approximately 3% of GDP and remains a persistent drag.
S&P Global forecasts 2.2% full-year GDP growth for 2026. Goldman Sachs forecasts 2.8%, citing tariff drag mitigation as a positive factor. Neither figure captures the internal bifurcation that the quarterly data reveals.
The key Q2 risk factors centre on three channels:
The labour market reinforces the wait-and-see posture: low layoffs but broad hiring caution, consistent with businesses preserving existing workforces while deferring expansion decisions.
Business investment contributed 1.1 percentage points to Q1 GDP, matching consumer spending’s contribution exactly. In prior cycles, consumer spending did the economy’s heavy lifting. In Q1 2026, capital expenditure carried equal weight. That rotation has implications for both the durability and the distribution of growth.
The “other equipment” category grew at 10.9% annualised in Q1 2026, turning positive after six consecutive quarters of decline. If confirmed in subsequent data, this widening of the investment cycle beyond AI-specific categories would be the most significant development to watch in Q2 and Q3 releases.
The tension the data cannot yet resolve sits at the centre of the 2026 economic narrative. AI capex may be building genuine productive capacity that will broaden into economy-wide gains over time. It may also be concentrating investment returns in a narrow stratum of technology firms while the broader economy contends with stagnating real purchasing power (real DPI fell 0.1% in March) and constrained borrowing costs. Hiring caution across the labour market suggests firms are substituting capital for labour, a shift with distributional consequences that extend well beyond the investment figures themselves.
For readers wanting to stress-test the consumer spending deceleration thread further, our deep-dive into US recession risk indicators examines the savings rate drawdown, the K-shaped divergence between income cohorts, and the equity market complacency that leaves valuations exposed if spending momentum breaks in Q2 or Q3 2026.
The AI investment boom is the most structurally durable force in the current expansion. Whether its benefits prove broad enough to insulate the rest of the economy from policy, inflation, and geopolitical headwinds is the question that Q2 data will begin, but not finish, answering.
This article is for informational purposes only and should not be considered financial advice. Investors should conduct their own research and consult with financial professionals before making investment decisions. Past performance does not guarantee future results. Financial projections are subject to market conditions and various risk factors.
GDP growth includes the mechanical drag of imports, which subtract from the headline figure even when they reflect healthy business activity. In Q1 2026, US domestic demand grew at 2.5% annualised while headline GDP came in at 2.0%, with the gap driven entirely by a 25.8% surge in goods imports rather than any underlying economic weakness.
The headline GDP figure was dragged down by a 25.8% annualised surge in goods imports, which subtract from GDP by accounting convention. Stripping out this trade distortion, the underlying domestic economy grew at 2.5% annualised, supported by a 10.4% surge in business investment led by AI infrastructure spending.
Business investment, driven heavily by AI infrastructure spending, contributed 1.1 percentage points to Q1 2026 GDP growth, matching the contribution from all consumer spending combined. Information processing equipment alone grew at 43.4% annualised, and hyperscalers such as Microsoft and Meta are running AI-related capital expenditure at approximately 66% annual growth across the sector.
Headline PCE rose 0.7% month-over-month in March 2026, the largest monthly increase since June 2022, driven primarily by a 15.5% gasoline price surge linked to the Middle East conflict. The Fed held its policy rate at 3.50%-3.75% as of April 2026, and a return to the 2% inflation target is considered a 2027 proposition at the earliest, making a 2026 rate cut a possibility rather than a certainty.
Three primary risks could weigh on Q2 2026 growth: ongoing Middle East energy disruptions keeping inflation elevated, the April 2026 tariff reset potentially restarting the boom-bust import cycle that has distorted headline GDP for five consecutive quarters, and a deceleration in consumer spending as sustained inflation erodes real purchasing power.