Why AI Is Splitting Semiconductor Stocks From the Rest of Tech
55 mins ago

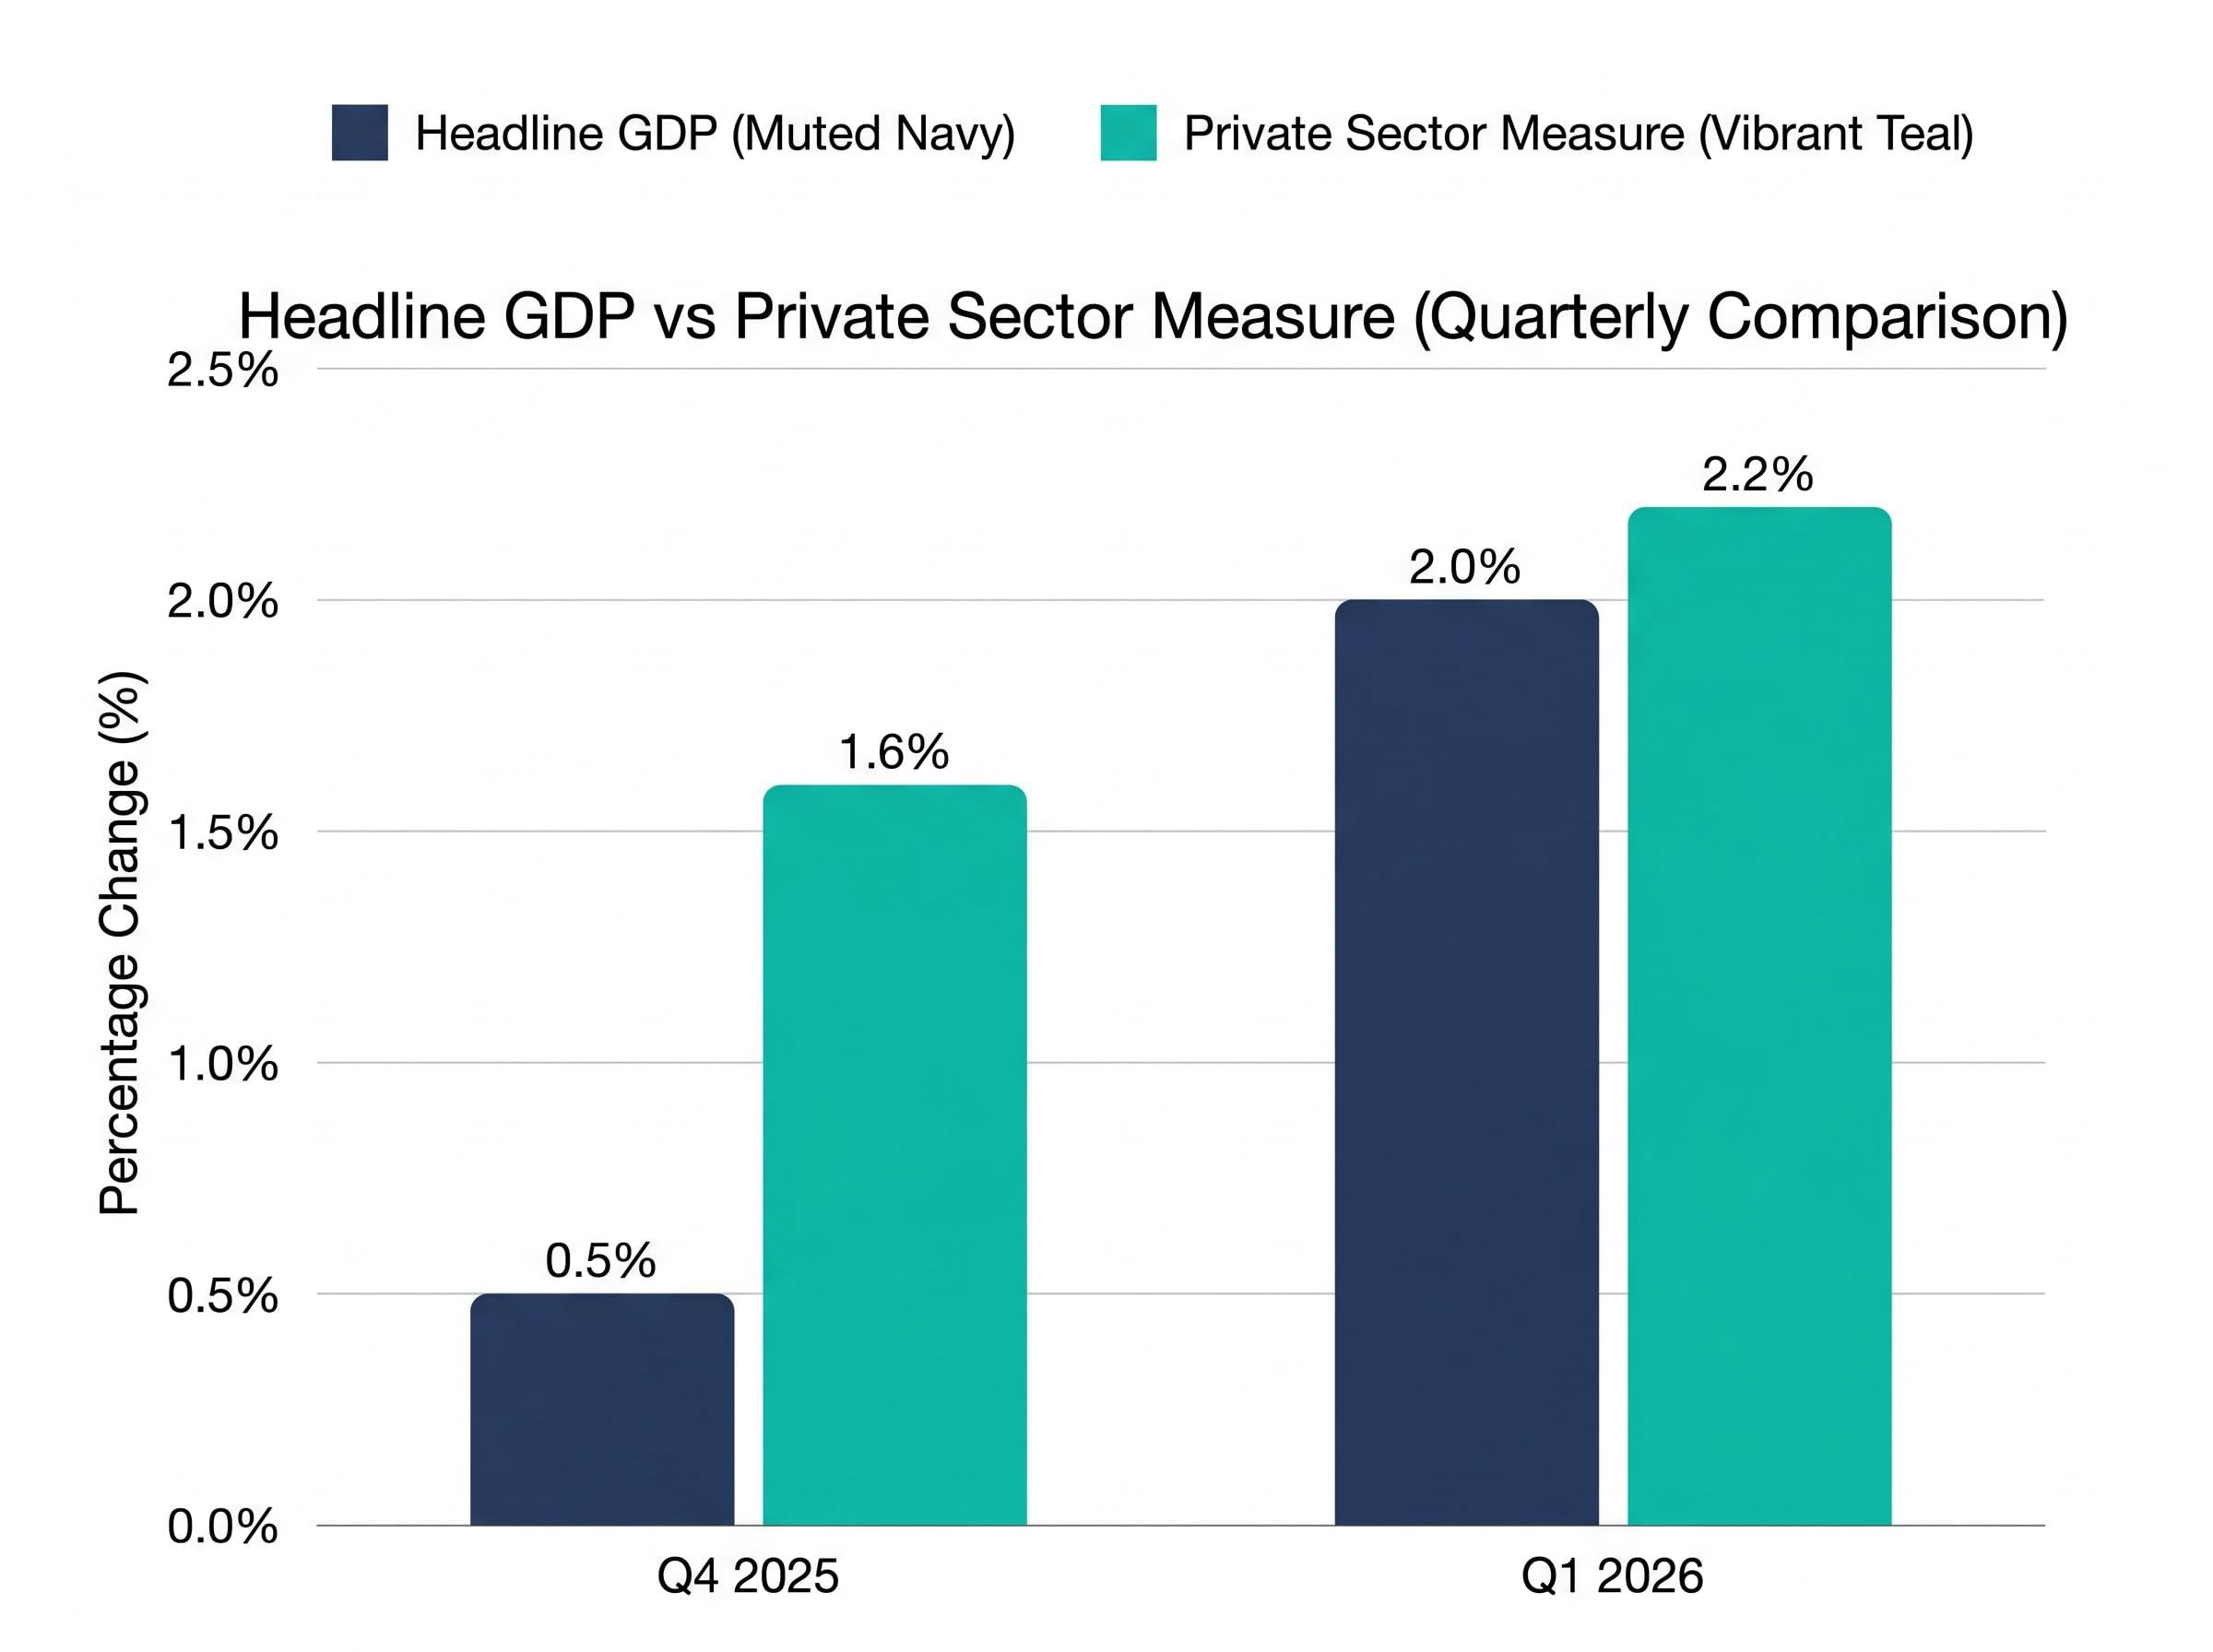
The headline number said 2.0%. The private sector told a different story. The Bureau of Economic Analysis released its Q1 2026 advance GDP estimate on 30 April, showing annualised growth of 2.0%, a meaningful rebound from Q4 2025’s downwardly revised 0.5%. But that headline figure, shaped by government shutdown distortions in the prior quarter and import volatility in the current one, obscures a private sector running at a stronger underlying pace than most casual readers of the report would conclude. What follows is a component-level dissection of the Q1 2026 GDP report: what the headline misses, where growth is actually concentrated, how inflation complicates the picture, and what the data signals about the US economy’s trajectory heading into mid-2026.
Strip away government spending swings and trade noise, and the private sector is outrunning the headline. Real final sales to private domestic purchasers, a measure combining consumer spending, business investment, and residential investment, accelerated to 2.2% annualised in Q1 2026 from 1.6% in Q4 2025, according to FactSet data. That places private demand near the midpoint of its two-year range.
The BEA’s Q1 2026 advance GDP estimate places annualised growth at 2.0%, with component-level breakdowns confirming headline PCE at 4.5% and core PCE at 4.3%, the primary data foundation underlying the component analysis in this article.
The gap between headline GDP and this private measure is not a Q1 anomaly. It recurs in most quarterly prints, driven by whichever volatile component (government spending, inventories, net exports) happens to swing hardest that quarter. Readers who anchor to the top-line number routinely misread both the pace and direction of underlying demand.
| Measure | Q4 2025 (Annualised) | Q1 2026 (Annualised) |
|---|---|---|
| Headline GDP | 0.5% | 2.0% |
| Private Sector Measure | 1.6% | 2.2% |
| Government Contribution | Decreased (shutdown impact) | Increased (rebound) |
Q4 2025’s 0.5% headline was itself suppressed by a federal government shutdown that pulled government spending sharply lower. When federal nondefense spending rebounded in Q1 2026 following that shutdown-driven decrease, it inflated the quarter-on-quarter improvement in the headline figure. The comparison between Q4 and Q1 is therefore noisier than it appears: part of the headline rebound reflects a reversal of a one-off suppression, not a pure acceleration in economic activity. The private sector measure, less affected by these swings, tells a cleaner story.
Total business fixed investment surged 10.4% annualised in Q1 2026, up from 2.4% in Q4 2025, its fastest quarterly pace since Q2 2023. The acceleration contributed 1.1 percentage points to headline GDP, according to FactSet data. The composition of that surge tells the story.
Information processing equipment ran at 43.4% annualised, following 37.0% in Q4 2025. Software investment hit 22.6%, up sharply from 4.8% the prior quarter. These two categories, tied directly to AI infrastructure and data centre buildout, are doing the structural work within the broader investment figure.
The acceleration extended beyond the technology core:
Haver Analytics identified business fixed investment as the “star” of the Q1 2026 GDP report, reflecting the breadth and intensity of the AI-driven capital expenditure cycle.
The transportation equipment drag is a legitimate offset, but it does not change the directional signal. The investment engine is running, and its fuel is AI. The concentration of strength in technology subcategories has direct implications for technology sector earnings, capital equipment suppliers, and the durability of this growth cycle’s investment phase.
Investors wanting to understand where the hardware and energy spending behind these numbers is actually flowing will find our deep-dive into AI infrastructure capital allocation covers the full breakdown: Wall Street’s $530 billion to $700 billion data centre forecast for 2026, the power grid capacity deficit, and which energy and hardware suppliers are positioned to capture the capex cycle.
Consumer spending decelerated modestly from 1.9% annualised in Q4 2025 to 1.6% in Q1 2026. It still contributed 1.1 percentage points to GDP, equal to business investment’s contribution, underscoring consumption’s continued centrality to the growth picture.
The temptation is to read the deceleration as softening demand. The composition argues otherwise. Consumer expenditure is dominated by non-discretionary services: healthcare, housing, insurance, utilities. These categories exhibit limited quarter-to-quarter swings and anchor the aggregate figure against sharp moves in either direction. A 1.6% print in this context reflects structural stability rather than emerging weakness.
EY-Parthenon has flagged an “uncomfortable balance” in the consumer spending data, noting that spending concentration among affluent consumers represents a structural vulnerability beneath the aggregate resilience.
Consumer savings depletion adds a layer of fragility to that stability reading: the US personal savings rate stood at 4.0% in February 2026, and spending concentration among upper-income households means the aggregate resilience in PCE figures may be masking deterioration in the mass-market consumer base that anchors discretionary retail and services.
The longer-term trend supports the stability reading. Real personal consumption expenditure (PCE) grew 0.2% month-over-month in March 2026, in line with its monthly average since January 2022, according to FactSet. Disposable personal income rose 0.6% month-over-month in March, though real DPI (adjusted for inflation) edged down 0.1%.
Since January 2022, real DPI and real consumer spending have tracked each other at roughly 0.2% monthly growth, a parallel that suggests spending is grounded in income rather than debt-fuelled overextension. Gasoline, despite its March price spike, represents only 1.7% of total consumer spending, limiting its impact as a broad consumption drag.
Goods imports rebounded 25.8% annualised in Q1 2026, and that rebound subtracted from the headline GDP figure through the net exports calculation. In GDP accounting, imports are subtracted from output because they represent spending on foreign-produced goods rather than domestic production. A surge in imports therefore mechanically pushes headline GDP lower, even if the imports reflect healthy domestic demand.
The Q1 rebound needs to be read within the full import cycle that preceded it:
This is not a new policy-driven front-loading episode. It is the import cycle returning toward trend after a year of distortion. The distinction matters: investors who treat import volatility as a demand signal rather than a measurement artefact will systematically misinterpret quarterly GDP prints. The private sector measure exists precisely to filter out this noise.
The GDP report delivered a constructive private sector reading. The inflation data complicated it. Headline PCE surged 4.5% annualised in Q1 2026, with March’s month-over-month increase of 0.7% marking the largest monthly gain since June 2022, according to FactSet.
The driver was specific: gasoline prices jumped 21.5% month-over-month in March. This is an energy price phenomenon, not broad-based inflationary pressure. Core PCE, which strips out food and energy, decelerated month-over-month from 0.4% in February to 0.3% in March, even as the annualised Q1 figure ran at 4.3%.
Energy price pass-through to core inflation is the transmission mechanism that separates a temporary gasoline spike from a durable inflation problem: oil prices above $100 per barrel embed themselves in logistics, retail shelf prices, and services costs over a 2-3 month lag, and that pipeline is relevant to whether March’s 0.7% monthly headline PCE reading stays isolated or begins feeding the core trend in Q2 2026.
| PCE Measure | Q1 2026 Annualised | March 2026 (MoM) | February 2026 (MoM) |
|---|---|---|---|
| Headline PCE | 4.5% | 0.7% | N/A |
| Core PCE | 4.3% | 0.3% | 0.4% |
Following the 30 April release, the S&P 500 rose 0.2% intraday, the 10-year Treasury yield increased 5 basis points to 4.15%, and the USD index strengthened 0.3%. The muted reaction reflected the tension between a slightly below-consensus growth print and hotter-than-expected inflation readings.
The distinction between headline and core PCE carries direct implications for Federal Reserve policy positioning. Elevated headline inflation constrains the rate-cut case even if core trends are more benign. Readers who can identify energy-driven headline spikes and separate them from underlying price trends are better positioned to assess rate path probabilities.
The Q1 2026 GDP report paints an economy that is resilient but not unambiguously strong. Private sector momentum is solid at 2.2%, and AI-led business investment is providing genuine structural support. Michael Pearce of Oxford Economics characterised the picture this way:
“The core of the economy remained solid… driven by the AI buildout and tax cuts.”
Full-year 2026 institutional forecasts cluster in a narrow band: Goldman Sachs at 2.1%, the IMF at 1.9%, and EY-Parthenon at 2.0-2.2%. Against 2025’s full-year actual of 2.1%, these projections suggest trend-like growth rather than meaningful acceleration or deterioration.
Beneath the aggregate, the growth picture rests on concentrated pillars. Residential investment contracted -8.0% annualised in Q1, subtracting approximately 0.3 percentage points from GDP and marking the seventh contraction in eight quarters. Housing represents roughly 3% of total GDP, but its persistent weakness narrows the base of growth.
Three variables will determine whether Q2 2026 data confirms or challenges this reading:
Geopolitical rate constraints extend the policy uncertainty well beyond the Q2 2026 data window: energy price shocks tied to Middle East conflict have frozen the rate-cut timeline in institutional forecasts through late 2027, and that extended higher-for-longer environment is a material input to whether AI investment durability and consumer spending breadth hold at the levels needed to sustain the 2.0-2.2% growth corridor that Goldman, IMF, and EY-Parthenon are projecting.
The headline figure, distorted by a government shutdown baseline, import volatility, and an energy-driven PCE spike, understates private sector momentum running at 2.2% and holding near its two-year midpoint. The economy is not accelerating dramatically, but neither is it fragile at the aggregate level. The risk sits in concentration: affluent consumers carrying consumption, AI carrying investment, and asset prices carrying confidence.
The component-level reading framework applied here, separating private demand from headline noise, tracking investment subcategories rather than the aggregate, and distinguishing energy-driven inflation from core pressures, is not specific to this quarter. It applies to every quarterly GDP print. The Q2 2026 advance estimate, expected in late July 2026, and subsequent monthly PCE releases will test whether March’s energy spike was a one-month event or the beginning of a broader inflation problem.
This article is for informational purposes only and should not be considered financial advice. Investors should conduct their own research and consult with financial professionals before making investment decisions. Past performance does not guarantee future results. Financial projections are subject to market conditions and various risk factors.
Real final sales to private domestic purchasers combines consumer spending, business investment, and residential investment to measure private sector demand, stripping out volatile government spending and trade swings. It rose to 2.2% annualised in Q1 2026, offering a cleaner picture of underlying US GDP growth than the 2.0% headline figure.
The 2.0% headline was dragged down by a goods import surge of 25.8% annualised, which mechanically subtracts from GDP accounting, and by a weak residential investment print of -8.0% annualised. The private sector measure, which filters out these distortions, ran at a stronger 2.2%.
Business fixed investment surged 10.4% annualised in Q1 2026, with information processing equipment rising 43.4% and software investment up 22.6%, both directly tied to AI infrastructure and data centre buildout. This contributed 1.1 percentage points to headline GDP and was identified by Haver Analytics as the star of the Q1 2026 report.
Headline PCE surged 4.5% annualised in Q1 2026, driven largely by a 21.5% monthly spike in gasoline prices, which constrains the Federal Reserve's case for cutting rates even though core PCE decelerated month-over-month from 0.4% in February to 0.3% in March. Whether the energy price spike feeds into broader core inflation in Q2 2026 is the key variable for the rate path outlook.
The three primary risks are whether the 10.4% AI-driven business investment pace can be sustained as initial infrastructure buildout matures, whether consumer spending broadens beyond upper-income households, and whether March's gasoline price spike proves transitory or passes through into core inflation in subsequent months.