KOSPI Drops 10% as Crowded AI Trade Unwinds Across Global Markets
11 hrs ago
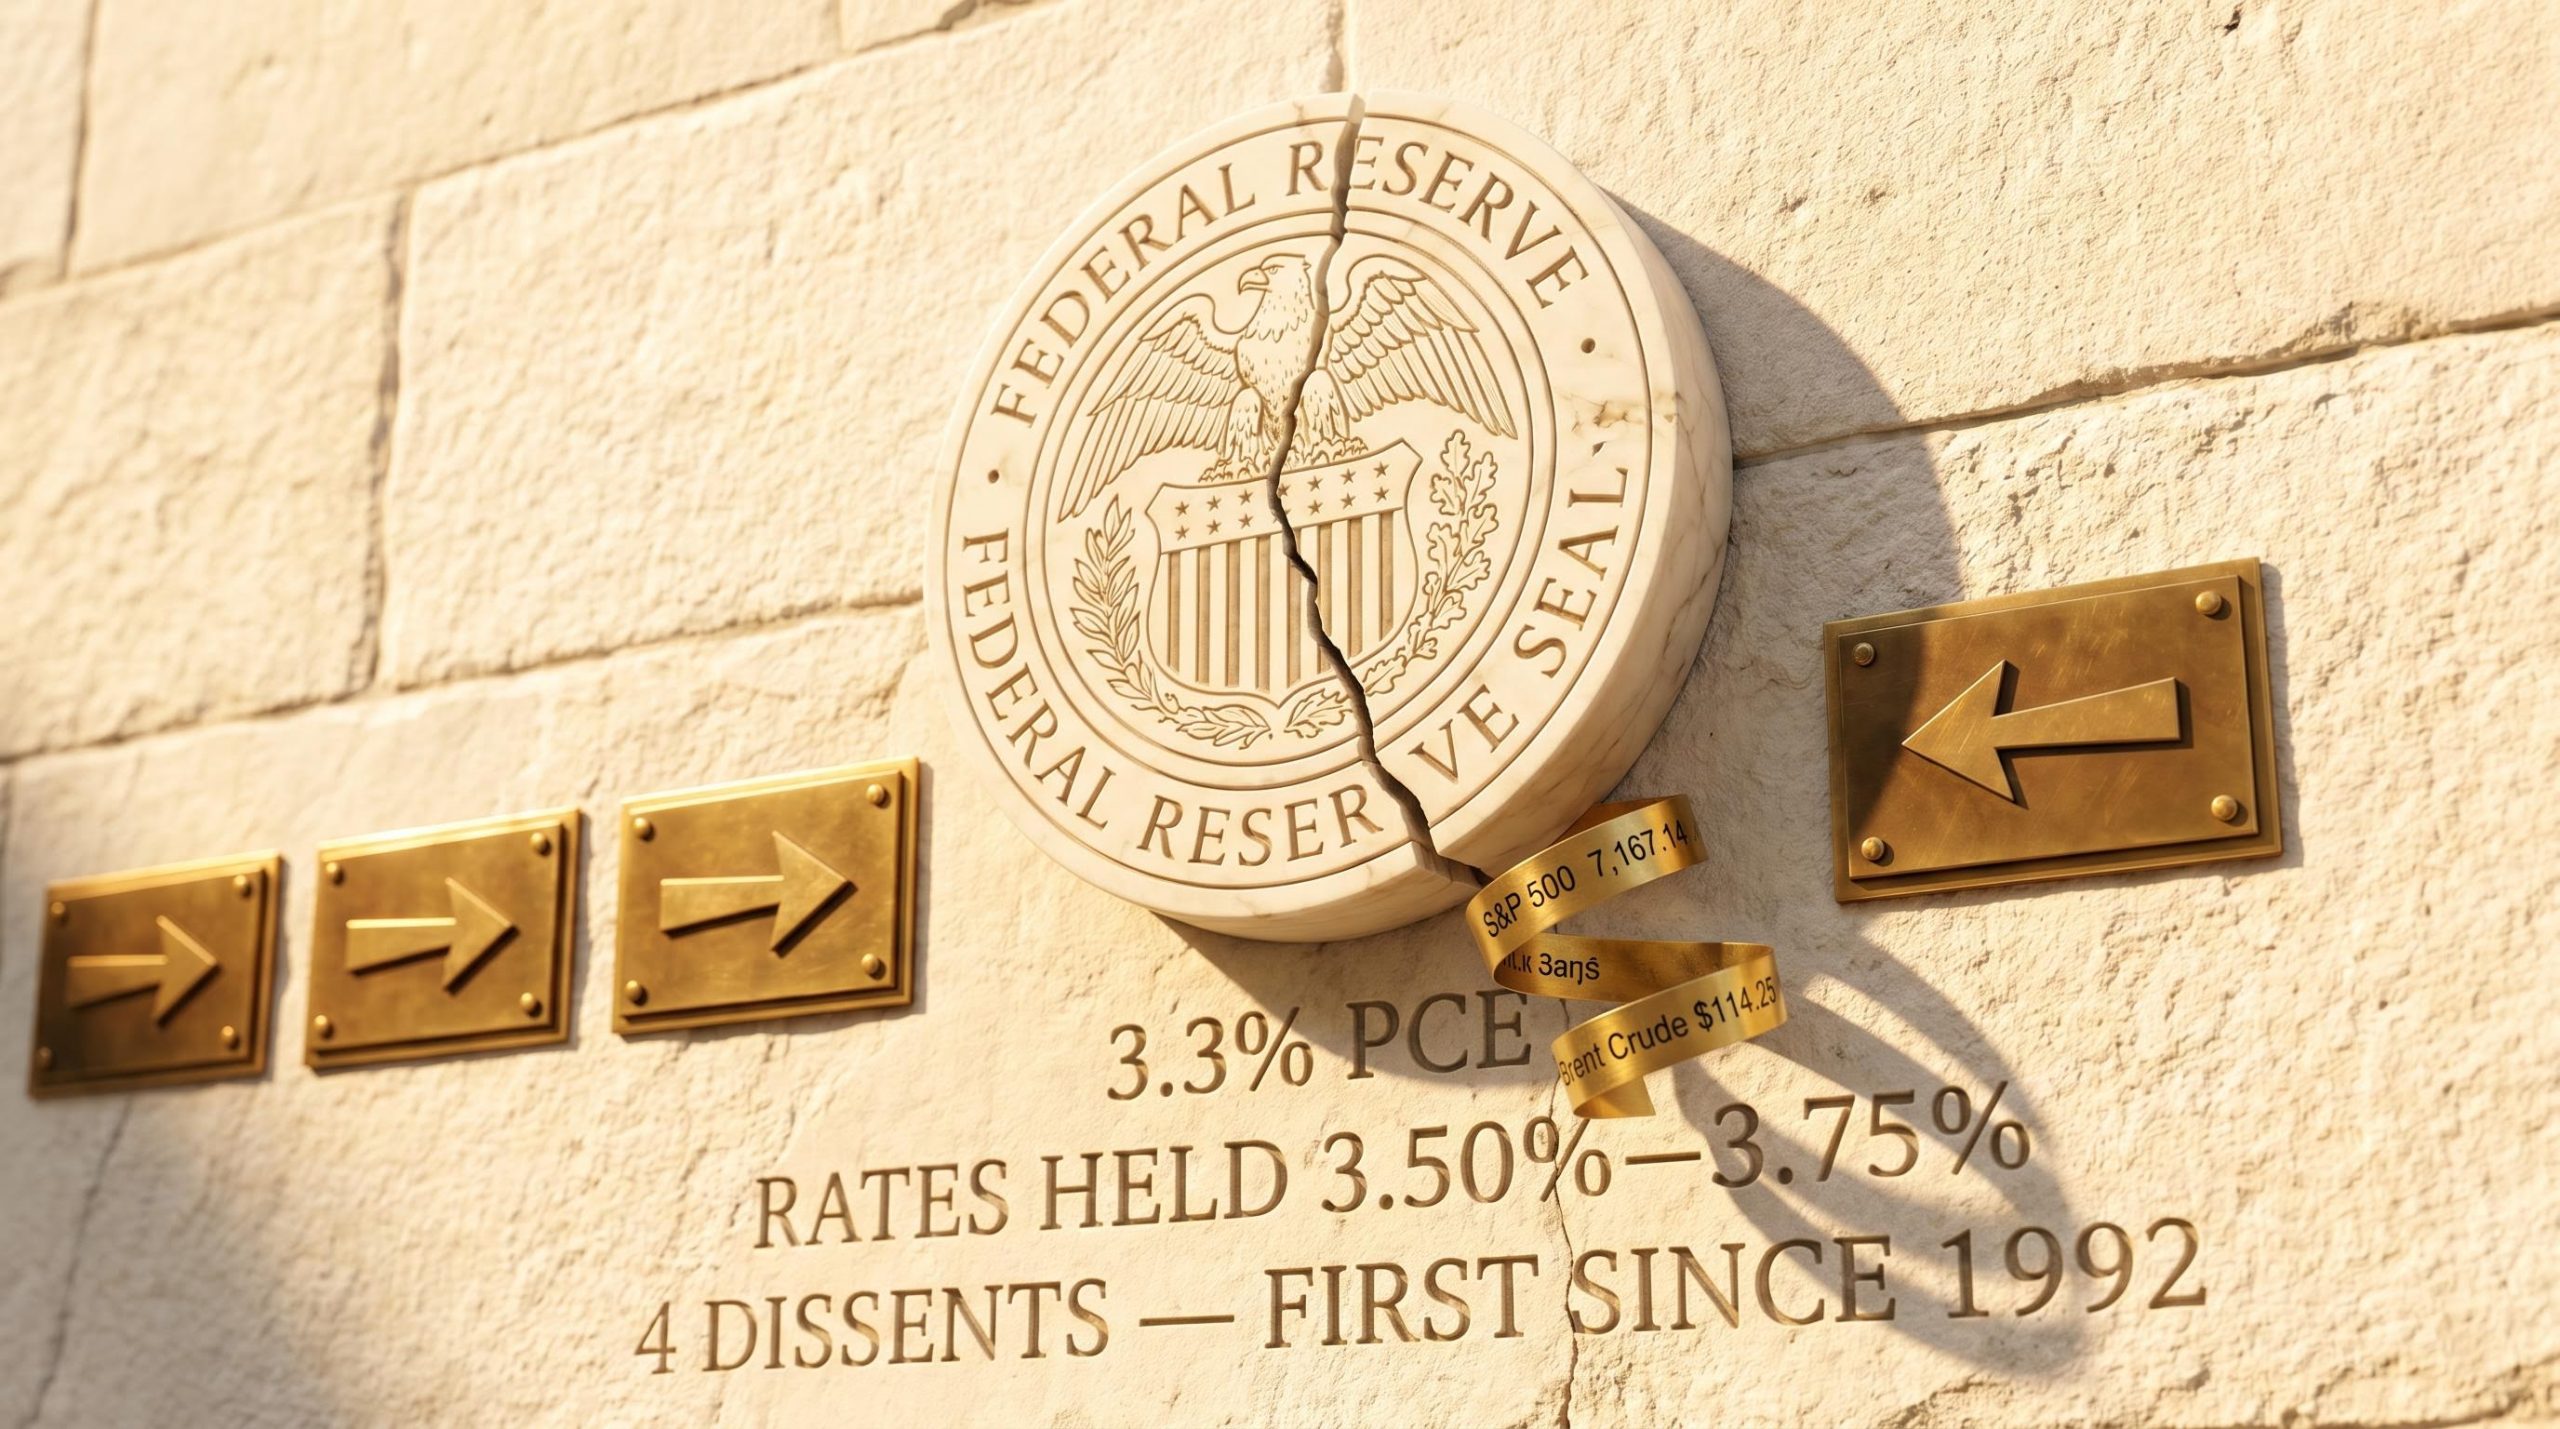
Four dissenting votes at a single Federal Open Market Committee (FOMC) meeting have not occurred since 1992. That number alone would warrant attention. Released alongside a three-year high in headline inflation and a GDP print that narrowly missed consensus, it signals something more consequential than a routine hold decision.
On 29 and 30 April 2026, three data releases landed within hours of each other: the Fed’s rate decision (with its historic dissent count), March Personal Consumption Expenditures (PCE) inflation data showing headline prices at 3.3% year-over-year, and a Q1 GDP advance estimate of 2.0% annualised. Each would be significant in isolation. Together, they reframe the interest rate outlook for the remainder of 2026. What follows is an examination of what each data point means, how they interact, and what the combined picture implies for investors navigating equity and fixed income positions in a higher-for-longer rate environment.
The Fed held rates at 3.50%-3.75%. The decision was not unanimous. Four members dissented, the highest count at a single meeting since 1992, and the nature of that disagreement matters more than the number itself.
Stephen Miran favoured a 25-basis-point cut. Three other members opposed the easing-bias language retained in the post-meeting statement. One dissenter wanted to move faster toward relief. Three wanted to pull back from even signalling it.
Analyst commentary following the decision pointed to expectations for “more dissents in the near term and more volatility in the rates markets.”
A bloc of four dissents all pushing in one direction would signal a coherent minority view building toward a future shift. This is different. Dissents pulling in opposite directions indicate the committee’s centre is fracturing on a more fundamental question: whether the economy’s current condition calls for patience or active restraint.
That distinction erodes the reliability of the Fed’s forward guidance. When the committee cannot agree on the diagnosis, the prescription embedded in the statement becomes harder for markets to trust as a durable signal.
The intersection of supply-side inflation and monetary policy limits is not unique to the current cycle; similar dynamics played out during the 1970s oil embargo, when the Fed’s rate tool was poorly matched to a price shock originating in physical supply constraints rather than demand excess, producing a prolonged period of stagflation.
Headline PCE rose to 3.3% year-over-year in March 2026, the highest reading in approximately three years. The monthly increase was 0.7%. Those numbers, taken alone, would suggest a straightforward case for tighter policy. The composition tells a more complicated story.
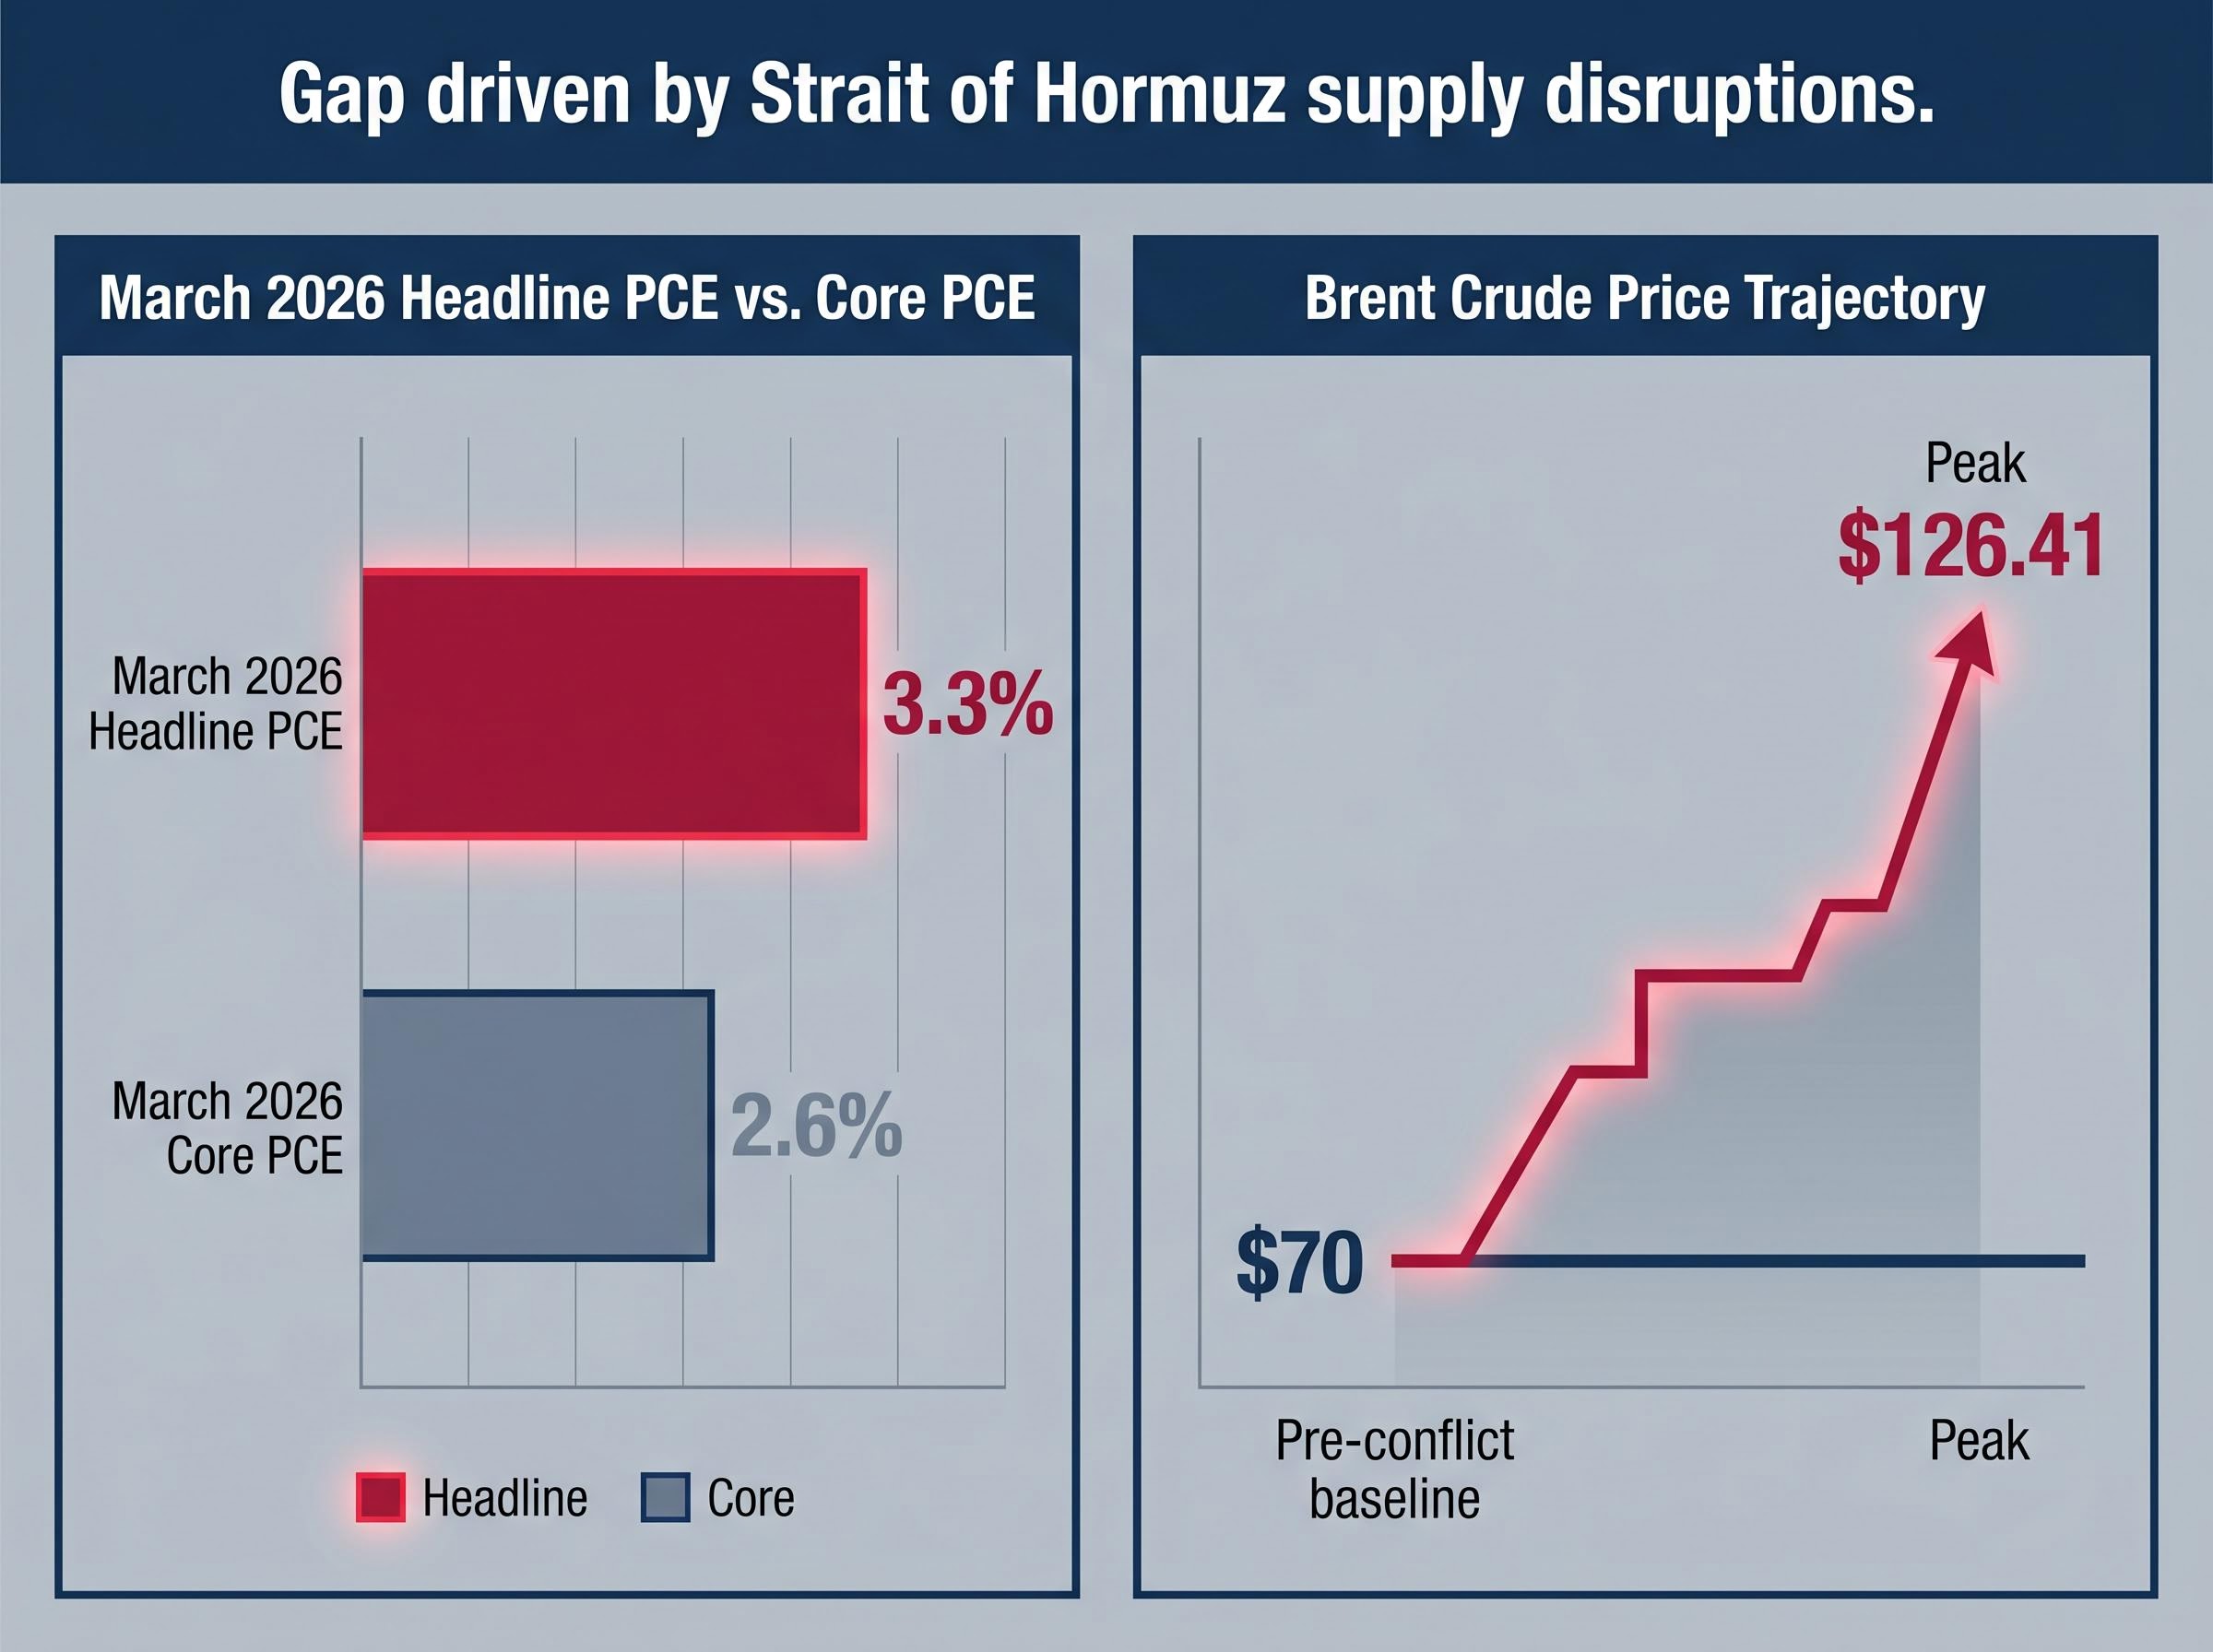
Core PCE, which strips out food and energy, came in at 2.6% year-over-year. The gap between headline and core is almost entirely energy-driven, a direct consequence of the Iran conflict and Strait of Hormuz supply disruptions that pushed Brent crude to a peak of $126.41 per barrel, roughly double the pre-conflict baseline of approximately $70.
The Fed’s rate tool does not reach energy supply shocks. Raising rates cannot reopen a shipping lane or resolve a geopolitical standoff. Yet headline inflation remains the number households experience and the number that shapes inflation expectations, which the Fed does care about controlling.
The distinction between headline and core PCE matters precisely because central bank inflation tools are calibrated to address demand-pull pressures, not supply-side shocks; when the dominant inflation driver is a maritime blockade rather than overheating household spending, the standard rate-hike transmission mechanism loses much of its force.
SIEPR research on monetary policy and energy shocks finds that rate tightening has limited transmission to inflation driven by imported energy supply disruptions, a finding that maps directly onto the Fed’s current position: core PCE remains above target for reasons rate hikes can address, but the headline overshoot is being driven by a geopolitical supply constraint that rate policy cannot resolve.
One softening signal exists inside the data. Monthly core PCE decelerated to 0.3% in March from 0.4% in February. It is a single month and a modest move, but it is the only directional improvement in an otherwise deteriorating picture.
| Indicator | February 2026 | March 2026 | Goldman Year-End Forecast |
|---|---|---|---|
| Headline PCE (YoY) | — | 3.3% | 3.4% |
| Core PCE (YoY) | — | 2.6% | — |
| Core PCE (MoM) | 0.4% | 0.3% | — |
| Brent Crude | ~$70 (pre-conflict baseline) | $126.41 (peak) | — |
Goldman Sachs revised its year-end 2026 headline PCE forecast upward to 3.4%, from a prior estimate of 3.1%, citing the ongoing U.S.-Iran deadlock and its sustained pressure on energy prices.
Energy-driven headline inflation above target, with core inflation also above target, leaves the Fed with no clean path toward cuts. The part it can influence remains too high. The part it cannot influence is making the headline number worse.
Q1 2026 GDP came in at 2.0% annualised, a meaningful rebound from Q4 2025’s 0.5% and just below the 2.1% consensus estimate. The economy is growing, and it is growing for reasons that reinforce the higher-for-longer case.
Growth drivers in Q1 included:
The labour market reinforced the same picture. Unemployment held at 4.3% in March 2026.
Initial jobless claims for the week ending 25 April fell to 189,000, the lowest level since 1969.
Goldman Sachs projects full-year 2026 GDP at 2.4%. That is not an economy in distress. It is an economy generating enough momentum to sustain corporate earnings while simultaneously removing any urgency for rate relief.
This is the bind. Strong growth is good news for equity earnings and employment. It is bad news for anyone waiting on rate cuts. A Fed facing 3.3% headline inflation and a labour market at multi-decade tightness has no recessionary emergency compelling it to ease. For investors, the data validates equity exposure but argues against positioning for near-term rate relief.
K-shaped consumer fragility complicates the growth picture further: aggregate spending data and headline GDP can appear resilient while lower-income households deplete savings and credit capacity at a pace that, if it accelerates, creates a delayed demand signal the Fed will not see clearly until well after policy decisions have been made.
The leadership timeline at the Fed is now concrete:
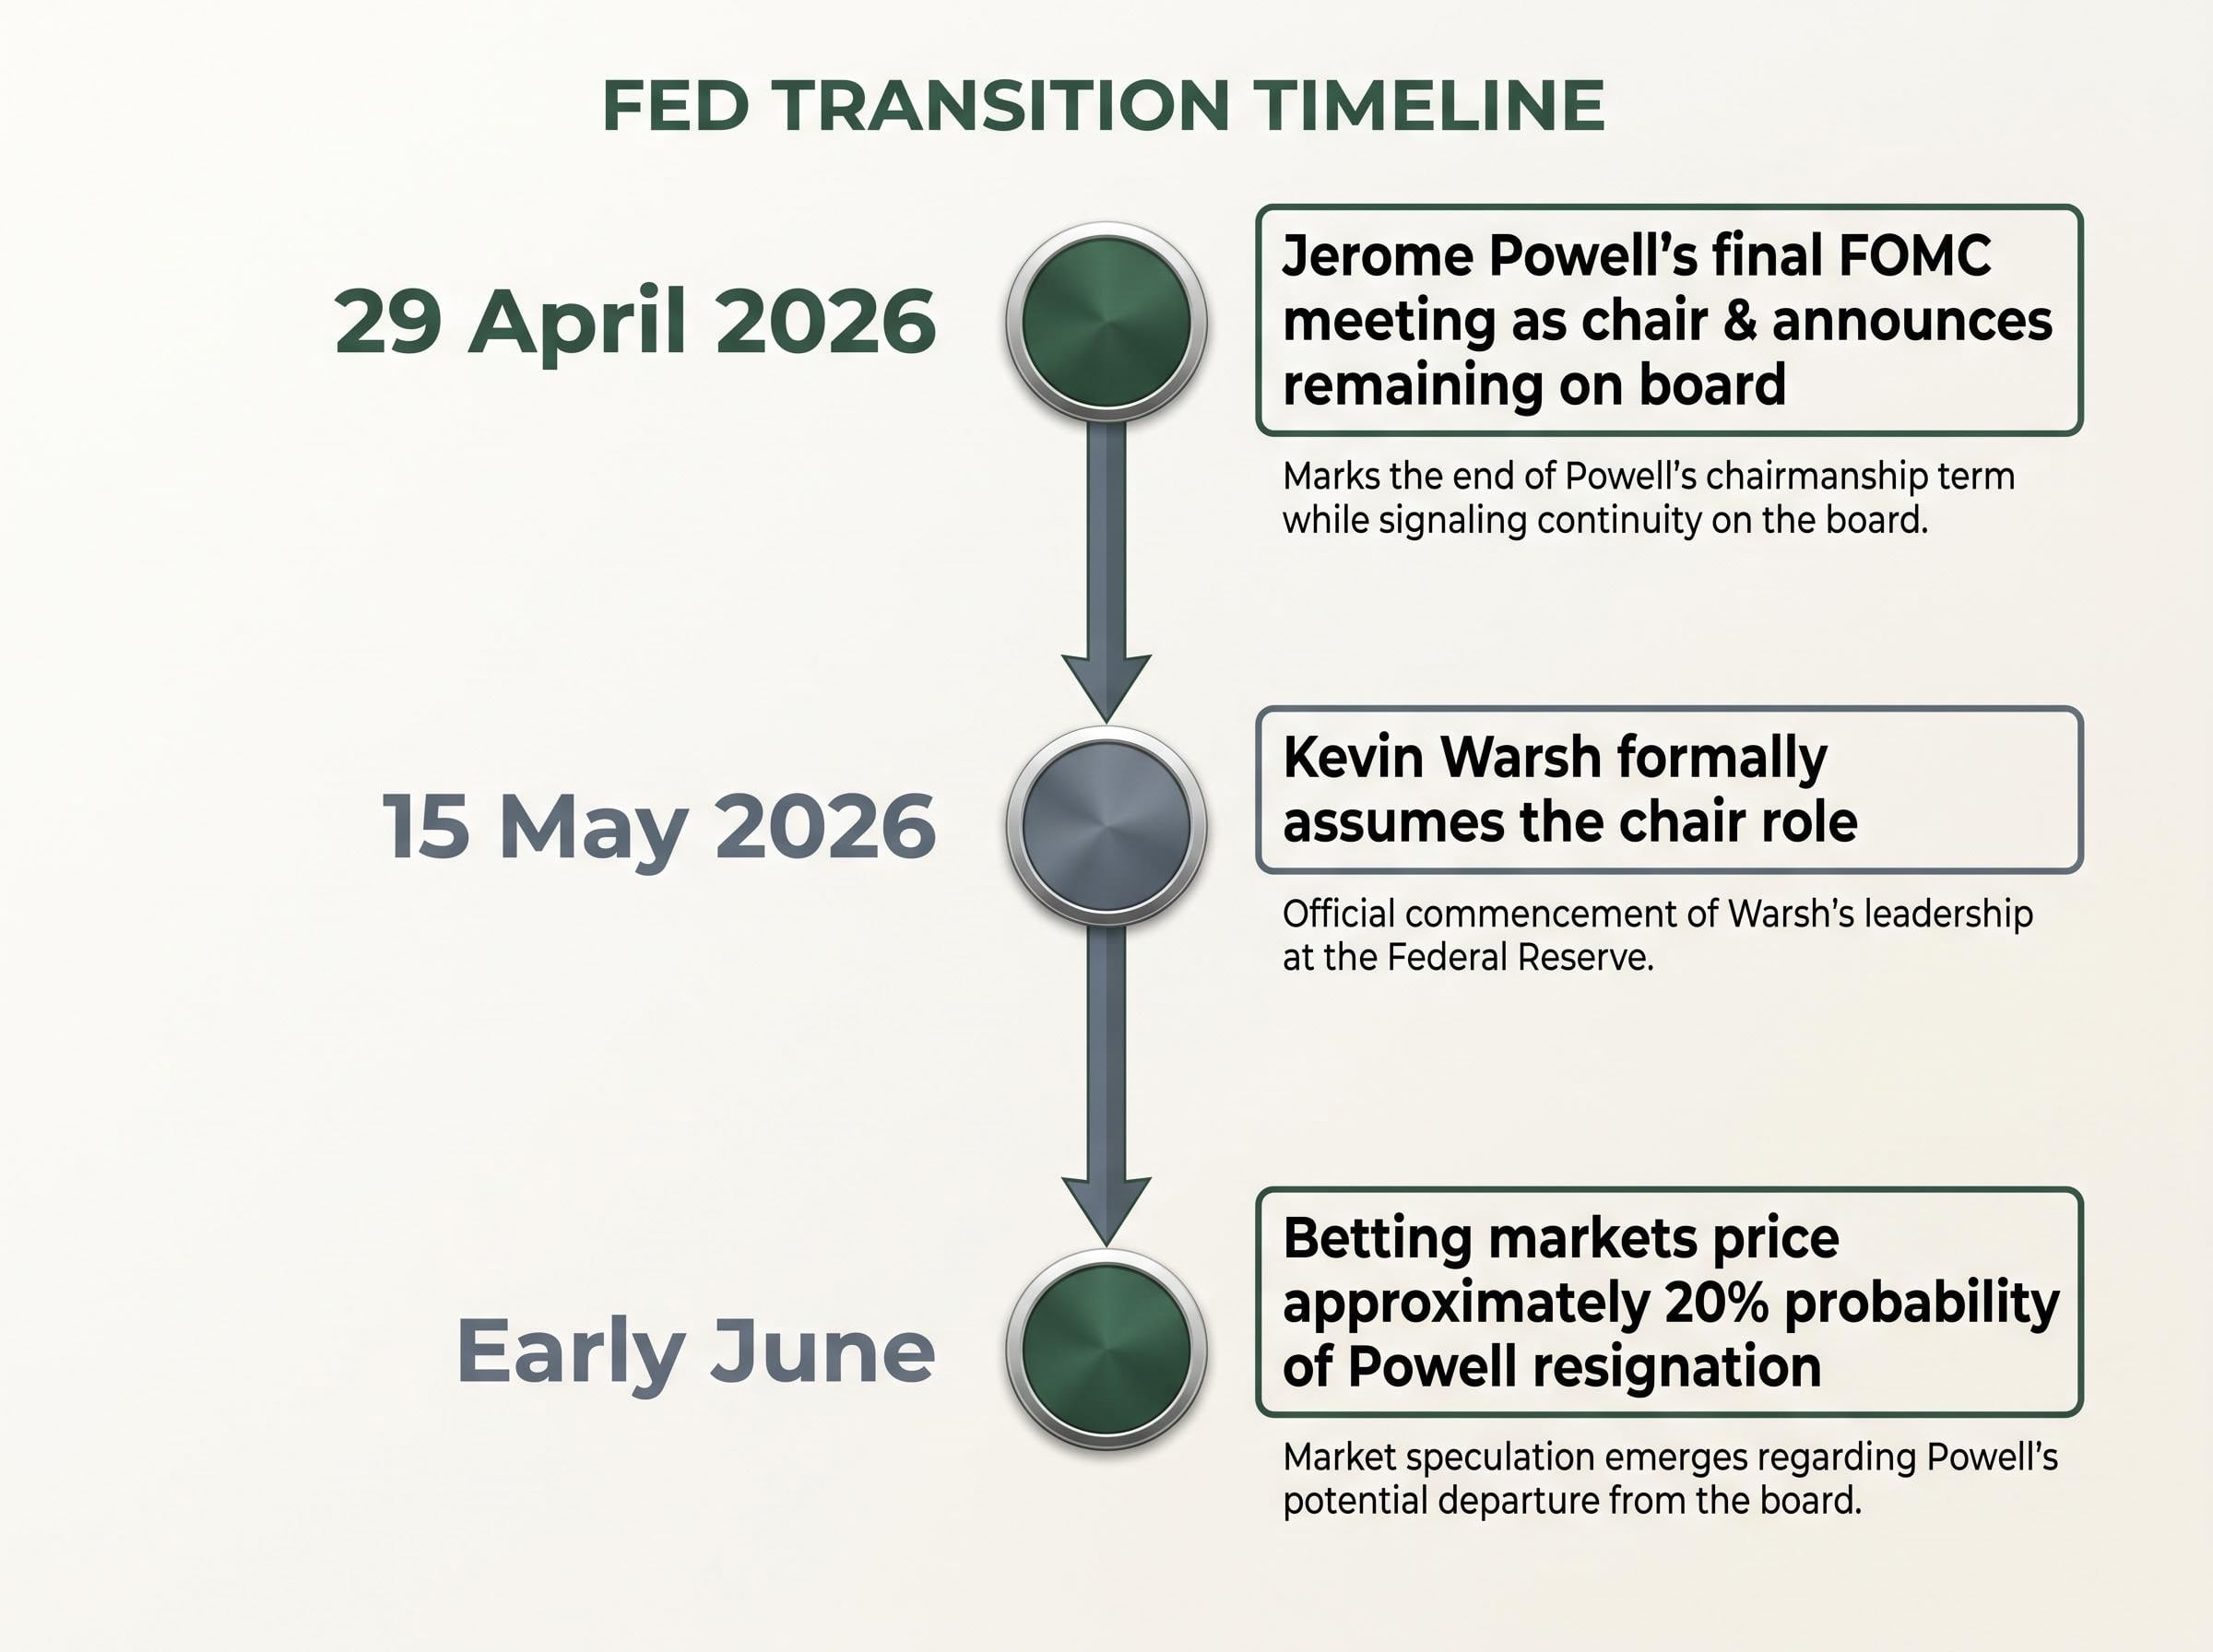
The prior week, the Department of Justice suspended a criminal inquiry into Powell’s management of Fed renovation spending. That backdrop shaped the context for his board-stay announcement, which markets received poorly despite its institutional framing.
Stocks lost ground following the announcement. A decision framed as preserving institutional continuity produced the opposite market reaction, one that read as prolonged uncertainty rather than resolution.
The concern is structural. A Powell presence on the board could complicate Warsh’s ability to build a new policy consensus, particularly given four members already broke with the committee’s position at the final meeting under Powell’s leadership. Warsh inherits a divided FOMC and a board configuration that may resist rapid alignment around a new chair’s preferred framework.
CFR analysis of Warsh’s monetary policy outlook drawn from his confirmation hearing suggests he holds a hawkish disposition on inflation and may be less inclined than Powell to retain forward guidance language that signals easing, a posture that could sharpen the FOMC’s internal divisions rather than resolve them.
CME FedWatch data as of 30 April provides the clearest single summary of how all the above is being priced collectively.
| Meeting Date | No-Change Probability | Cut Probability |
|---|---|---|
| June 2026 | 93% | 7% |
| July 2026 | 84% | 16% |
One FOMC member voted for a cut. The market sees a 93% chance the committee does not deliver one in June. That gap between internal Fed sentiment and external market pricing reflects how thoroughly sticky inflation and resilient growth have closed the window for near-term easing.
Equity markets on 30 April showed mixed signals: the S&P 500 rose 0.4% to 7,167.14, the Dow gained 1.3% to 49,492.73, and the Nasdaq edged up 0.1% to 24,698.23. Earnings from the Magnificent 7 provided structural support, with combined Q1 capital expenditure reaching $130.65 billion, up 71% year-over-year. Meta raised its 2026 capex guidance by $20 billion to a $125-$145 billion range, though its shares fell more than 9%. Alphabet climbed more than 7% on strong cloud results.
The asset class implications break down accordingly:
The analytical threads above converge on a single timeframe. The second half of 2026 is where the interest rate outlook will either shift meaningfully or lock in for longer.
Three conditions determine which outcome materialises. Investors monitoring the rate path should track them in this order:
Goldman Sachs estimates a global oil supply deficit of approximately 9.6 million barrels per day, a structural shortfall driven by Iranian storage constraints and deteriorating cartel coordination that places a structural floor under energy prices regardless of near-term diplomatic developments.
Goldman Sachs forecasts headline PCE at 3.4% and full-year GDP at 2.4% for 2026, representing the institutional consensus baseline. The Iran conflict represents the primary upside risk to that forecast.
If energy prices normalise and core PCE continues decelerating, a late-2026 cut becomes viable. If the conflict escalates and core inflation stalls, rates remain on hold into 2027. The structural supports, AI capex momentum and tax cut tailwinds, keep the growth floor firm in either scenario, but they do not solve the inflation problem that is keeping the Fed’s hand frozen.
A divided Fed, a three-year inflation high, and an economy growing at 2.0% with near-record employment collectively argue against any near-term rate cut. The data released on 29 and 30 April did not introduce ambiguity. It removed it, at least for the next two meetings.
Genuine positives exist within this picture. The labour market remains exceptionally tight. AI-driven capital expenditure is providing durable earnings support. Q1 GDP rebounded meaningfully from Q4’s soft patch.
None of those positives, however, create conditions for rate relief. They create conditions for a hold.
Three variables will determine when the outlook shifts:
This article is for informational purposes only and should not be considered financial advice. Investors should conduct their own research and consult with financial professionals before making investment decisions. Past performance does not guarantee future results. Financial projections are subject to market conditions and various risk factors.
The Federal Reserve held rates at 3.50%-3.75% in late April 2026, with CME FedWatch pricing a 93% probability of no cut in June and 84% in July, pointing to a higher-for-longer environment at least through mid-2026.
Four members dissented at the April 2026 FOMC meeting, the highest count since 1992, with one member favouring a 25-basis-point cut and three opposing the easing-bias language in the statement, reflecting a deeply divided committee on the economic diagnosis.
March 2026 headline PCE rose to 3.3% year-over-year, driven largely by energy prices from the Iran conflict, while core PCE came in at 2.6%; the Fed cannot cut rates while both measures remain above target, even though the headline overshoot is partly supply-driven.
Investors should monitor three key variables: developments in the Iran conflict and their effect on energy prices, Kevin Warsh's first policy signals after assuming the Fed chair role on 15 May 2026, and the monthly core PCE trajectory in the April data releases.
Equity markets showed mixed signals on 30 April 2026, with the S&P 500 rising 0.4% and the Dow gaining 1.3%, supported by strong Magnificent 7 earnings and AI capital expenditure momentum, despite the higher-for-longer rate environment.