Two ETFs from the same issuer, built on near-identical architecture, applying the same leverage to the same type of strategy, yet their distribution records since launch tell sharply different stories: one has expanded its payouts by roughly 24% while the other has barely moved at 2%. That gap is not noise. It is a signal worth understanding before deciding how much of each to own.
QQCL and USCL are leveraged covered call ETFs from Global X. Both apply 25% leverage to an underlying covered call fund, producing approximately 125% exposure. The only structural variable separating them is the index each tracks: the Nasdaq 100 for QQCL, the S&P 500 for USCL. For income investors, that single difference has compounded into meaningfully different outcomes, not just in distributions, but in what each fund’s trajectory reveals about how covered call income actually works.
Here is what the data settles, what it complicates, and how to think through the hold, tilt, or diversify decision in practical terms. The distribution gap is real, but total return data adds a layer most income investors overlook, and the right allocation answer depends on your existing portfolio more than on either fund’s headline yield.
A 24% versus 2% income gap from funds that look nearly identical
QQCL, which launched on 10 October 2023, has delivered distribution growth of approximately 24% across its lifetime. USCL launched slightly earlier on 5 July 2023 and has posted a comparatively modest 2.17% over the same period. The yield gap is equally notable on a forward basis, with QQCL currently at 13.52% against USCL’s 11.4%.
The structural similarity makes the divergence harder to dismiss. Same issuer. Same leverage level. Same ETF-of-ETF architecture, where each fund holds another covered call ETF and applies a 25% leverage overlay. Same covered call mechanics underneath. The only difference is the index.
USCL’s distribution trajectory adds a wrinkle. Its payouts ran ahead of what market conditions could sustain, then pulled back once tariff-driven volatility hit. QQCL’s distributions moved higher and largely held those gains. The result is a lifetime growth gap that has widened over time rather than narrowing.
The Nasdaq 100 covered call income gap observed in QQCL and USCL is not an isolated pair comparison: it holds across multiple managers and both Canadian and US markets, confirming the distribution divergence is driven by index construction rather than any single fund’s methodology.
The central question: Why has QQCL grown distributions by approximately 24% while USCL has managed roughly 2%, when the two funds are structurally near-identical? The answer shapes how you weight each one.
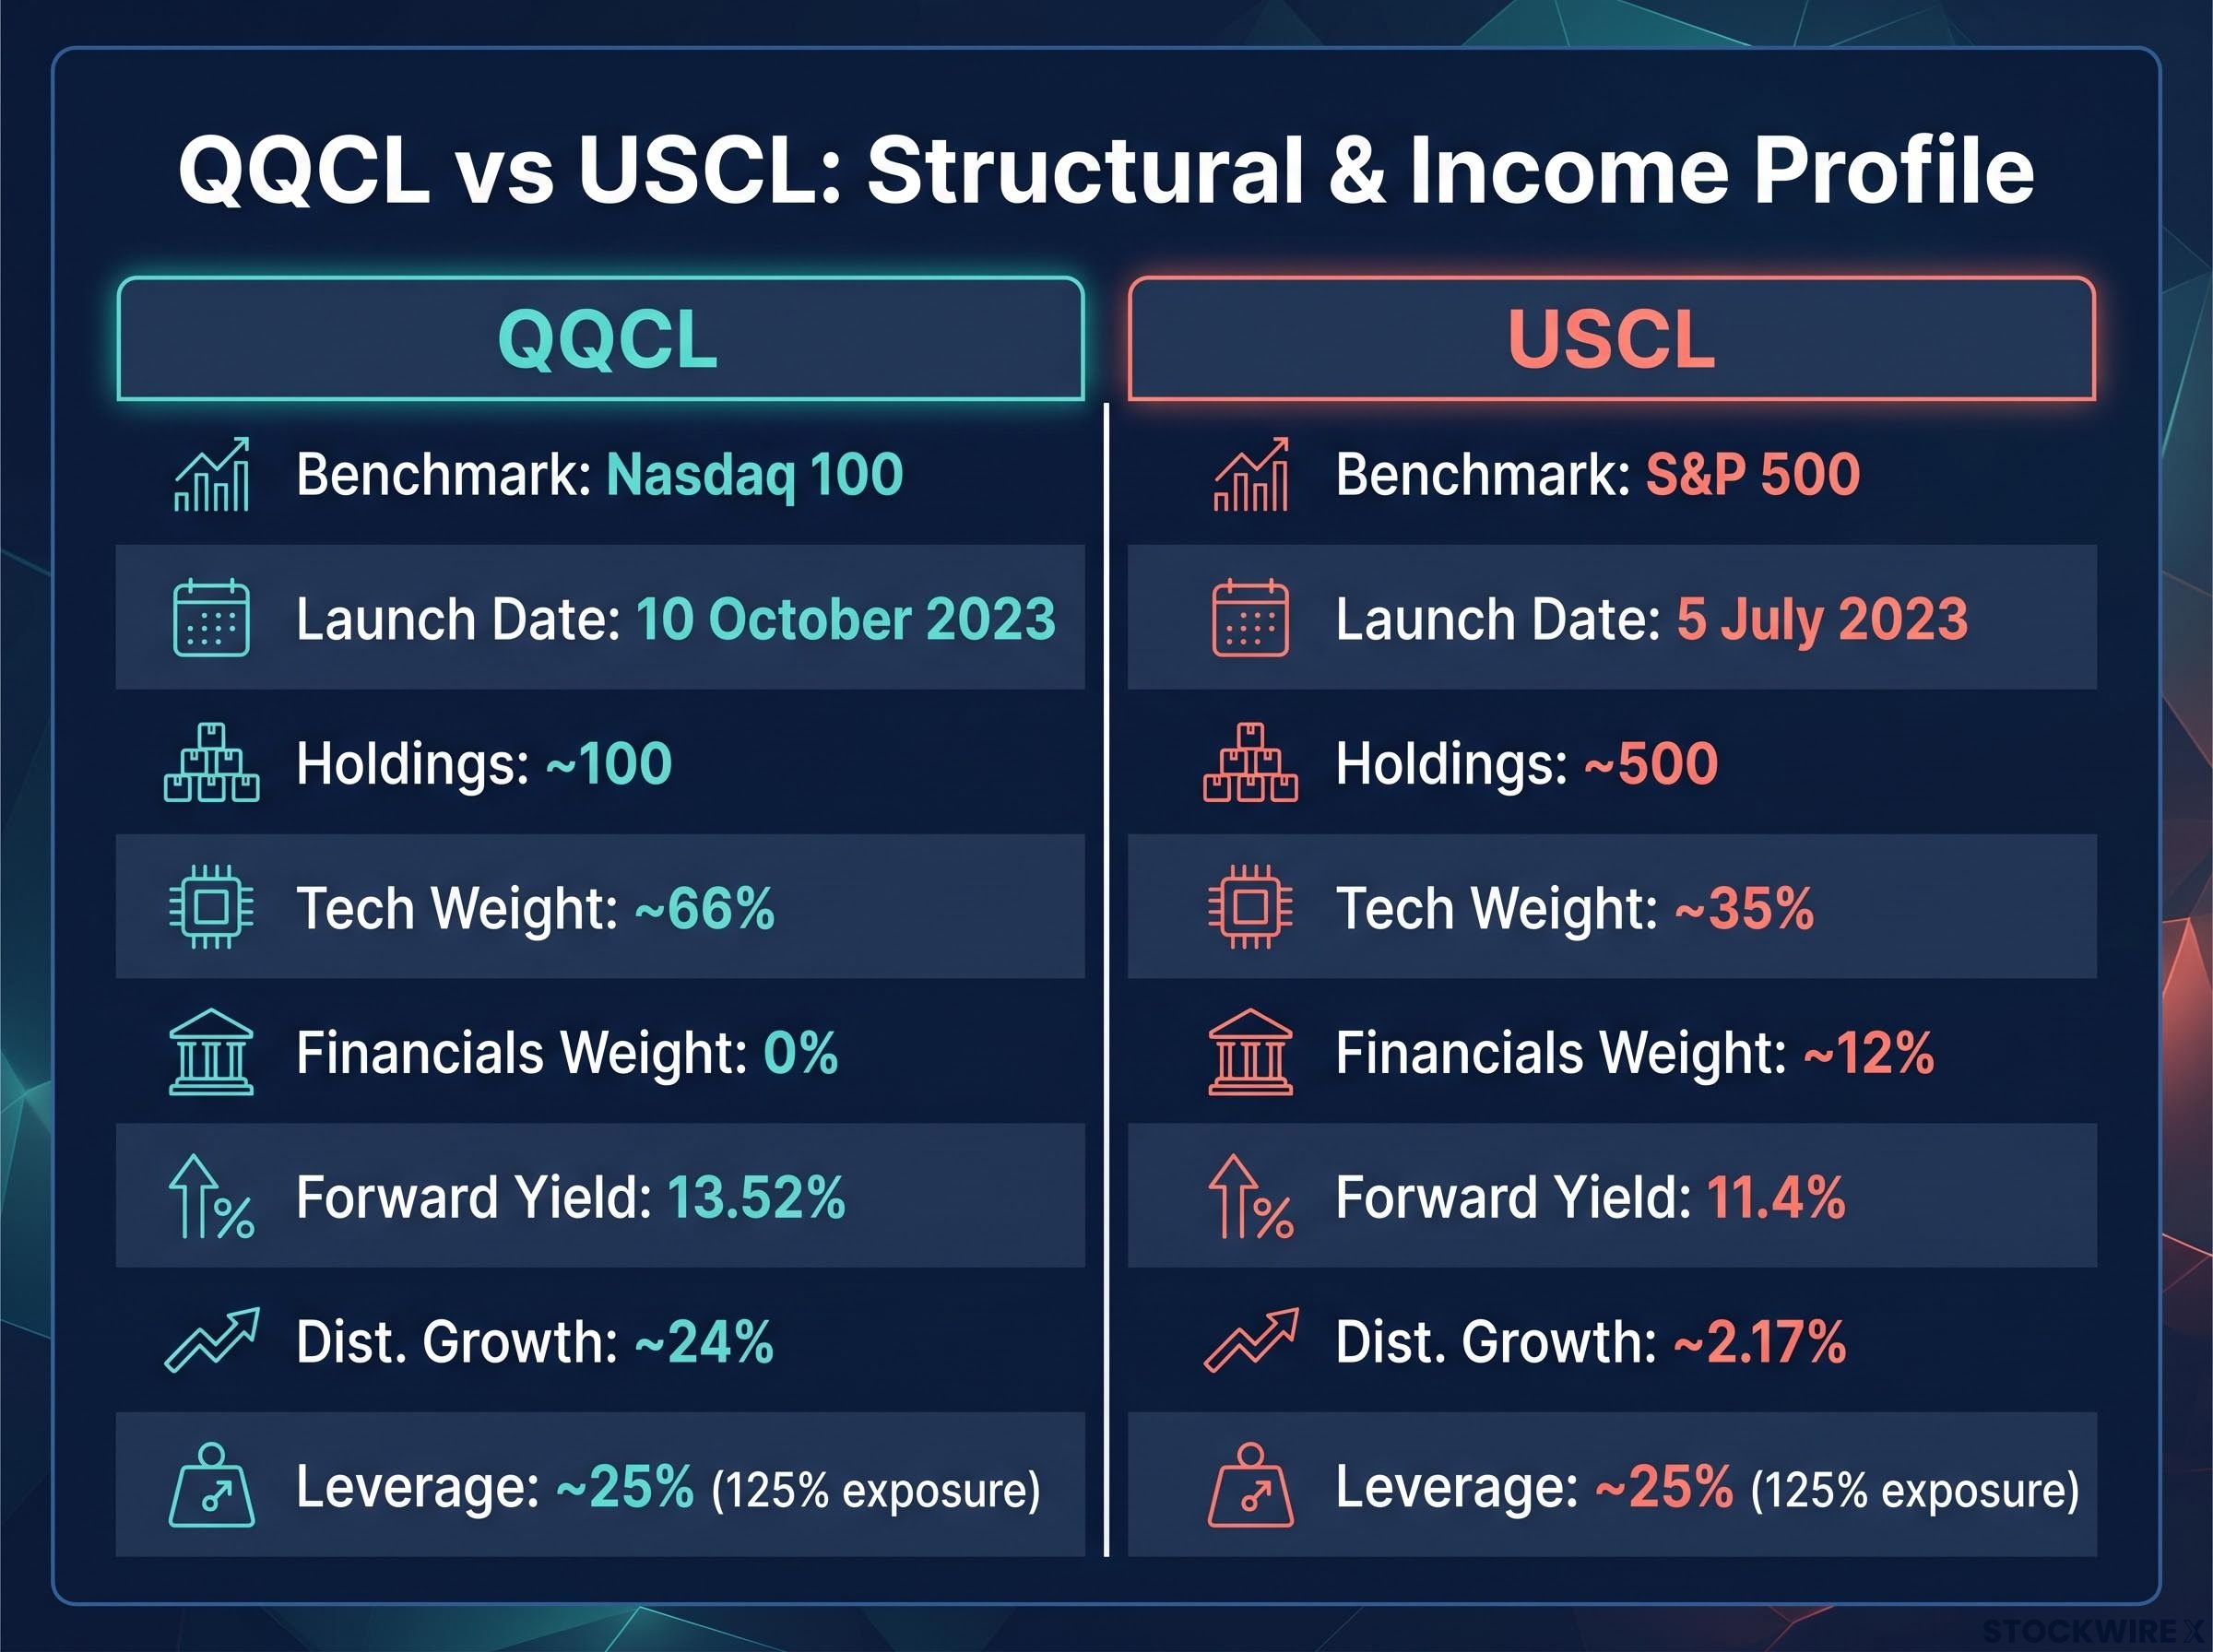
| Metric | QQCL | USCL |
|---|---|---|
| Inception date | 10 October 2023 | 5 July 2023 |
| Underlying fund | QQCC (Nasdaq-100 covered call) | USCC (S&P 500 covered call) |
| Benchmark index | Nasdaq 100 | S&P 500 |
| Leverage applied | ~25% (125% exposure) | ~25% (125% exposure) |
| Lifetime distribution growth | ~24% | ~2.17% |
| Forward 12-month yield | 13.52% | 11.4% |
That 12-percentage-point gap in forward yield and the divergent distribution trajectories tell you something important: fund structure alone does not determine income outcomes. The index underneath is doing most of the work, and understanding which index generates richer premiums is the prerequisite to any allocation decision.
When big ASX news breaks, our subscribers know first
What covered call income actually depends on (and why the index is the whole game)
Start with what you already know from the numbers above: one fund pays more. The question is why, and the answer sits in how covered call ETFs generate income in the first place.
A covered call ETF writes (sells) call options on its holdings. Call options give the buyer the right to purchase shares at a set price by a set date. The fund collects the price of that option, called the premium, and distributes it to shareholders as income. The tradeoff is that the fund caps its upside: if the stock rises above the option’s strike price, the fund misses that gain.
Three factors determine how much premium a fund collects each time it writes options:
The Cboe BXM covered call index, which tracks a systematic buy-write strategy on the S&P 500, provides the foundational research framework showing how option premium income fluctuates with implied volatility conditions across different market regimes.
- Implied volatility level: Higher implied volatility means more expensive options and more premium income per unit of exposure. Implied volatility is the market’s estimate of how much a stock or index could move, priced into option contracts.
- Time to option expiration: Longer-dated options carry more premium, though most covered call ETFs write short-dated options on a rolling basis.
- Distance between current price and strike price: Options written closer to the current price collect more premium but cap upside sooner.
Of these three, implied volatility is the dominant driver of income differences between two otherwise similar covered call funds. The 25% leverage both QQCL and USCL apply scales up whatever premium income the underlying index’s options environment already produces. The leverage itself does not create income independently of that base.
Why the Nasdaq 100 operates in a structurally richer premium environment
The Nasdaq 100’s approximately 66% technology sector concentration creates a base of higher-volatility constituents compared to the S&P 500’s approximately 35% tech weight. Tech and growth stocks tend to have more volatile earnings, more sensitivity to interest rates, and bigger price swings around news events, all of which raise implied volatility and push option prices higher.
Roughly 12% of the S&P 500 sits in financials, a sector with no representation in the Nasdaq 100 at all. Financials carry more subdued implied volatility characteristics, which tempers the overall premium richness at the S&P 500 index level. Financials have performed well over the past year, contributing to price returns, but their steadier trading patterns do not generate the same richness in options pricing.
With approximately 100 holdings versus approximately 500, the Nasdaq 100’s concentration amplifies the volatility of its largest constituents into the index’s overall options pricing. The Nasdaq 100’s implied volatility curve tends to be sharper and more elevated, whereas the S&P 500’s profile is comparatively flatter and more contained.
Once you grasp that implied volatility is the actual income engine, you can immediately predict which of any two covered call funds will generate more income simply by asking which index moves more. That is the evaluative lens you need before comparing any covered call ETFs, not just these two.
Total return tells a more complicated story than distributions alone
Before you write USCL off based on its distribution history, consider what total return data shows. Both funds are outperforming their respective benchmarks on a year-to-date total return basis, but the size of that outperformance flips the narrative.
| Fund | Benchmark | Benchmark YTD total return | Fund YTD total return | Outperformance gap |
|---|---|---|---|---|
| QQCL | Nasdaq 100 | 17.51% | ~20.5% | ~3 percentage points |
| USCL | S&P 500 | 10.52% | 14.63% | ~4 percentage points |
USCL’s 4-percentage-point outperformance of the S&P 500 is proportionally larger than QQCL’s approximately 3-percentage-point gap over the Nasdaq 100. The fund with the weaker distribution growth story is actually doing more relative work against its benchmark.
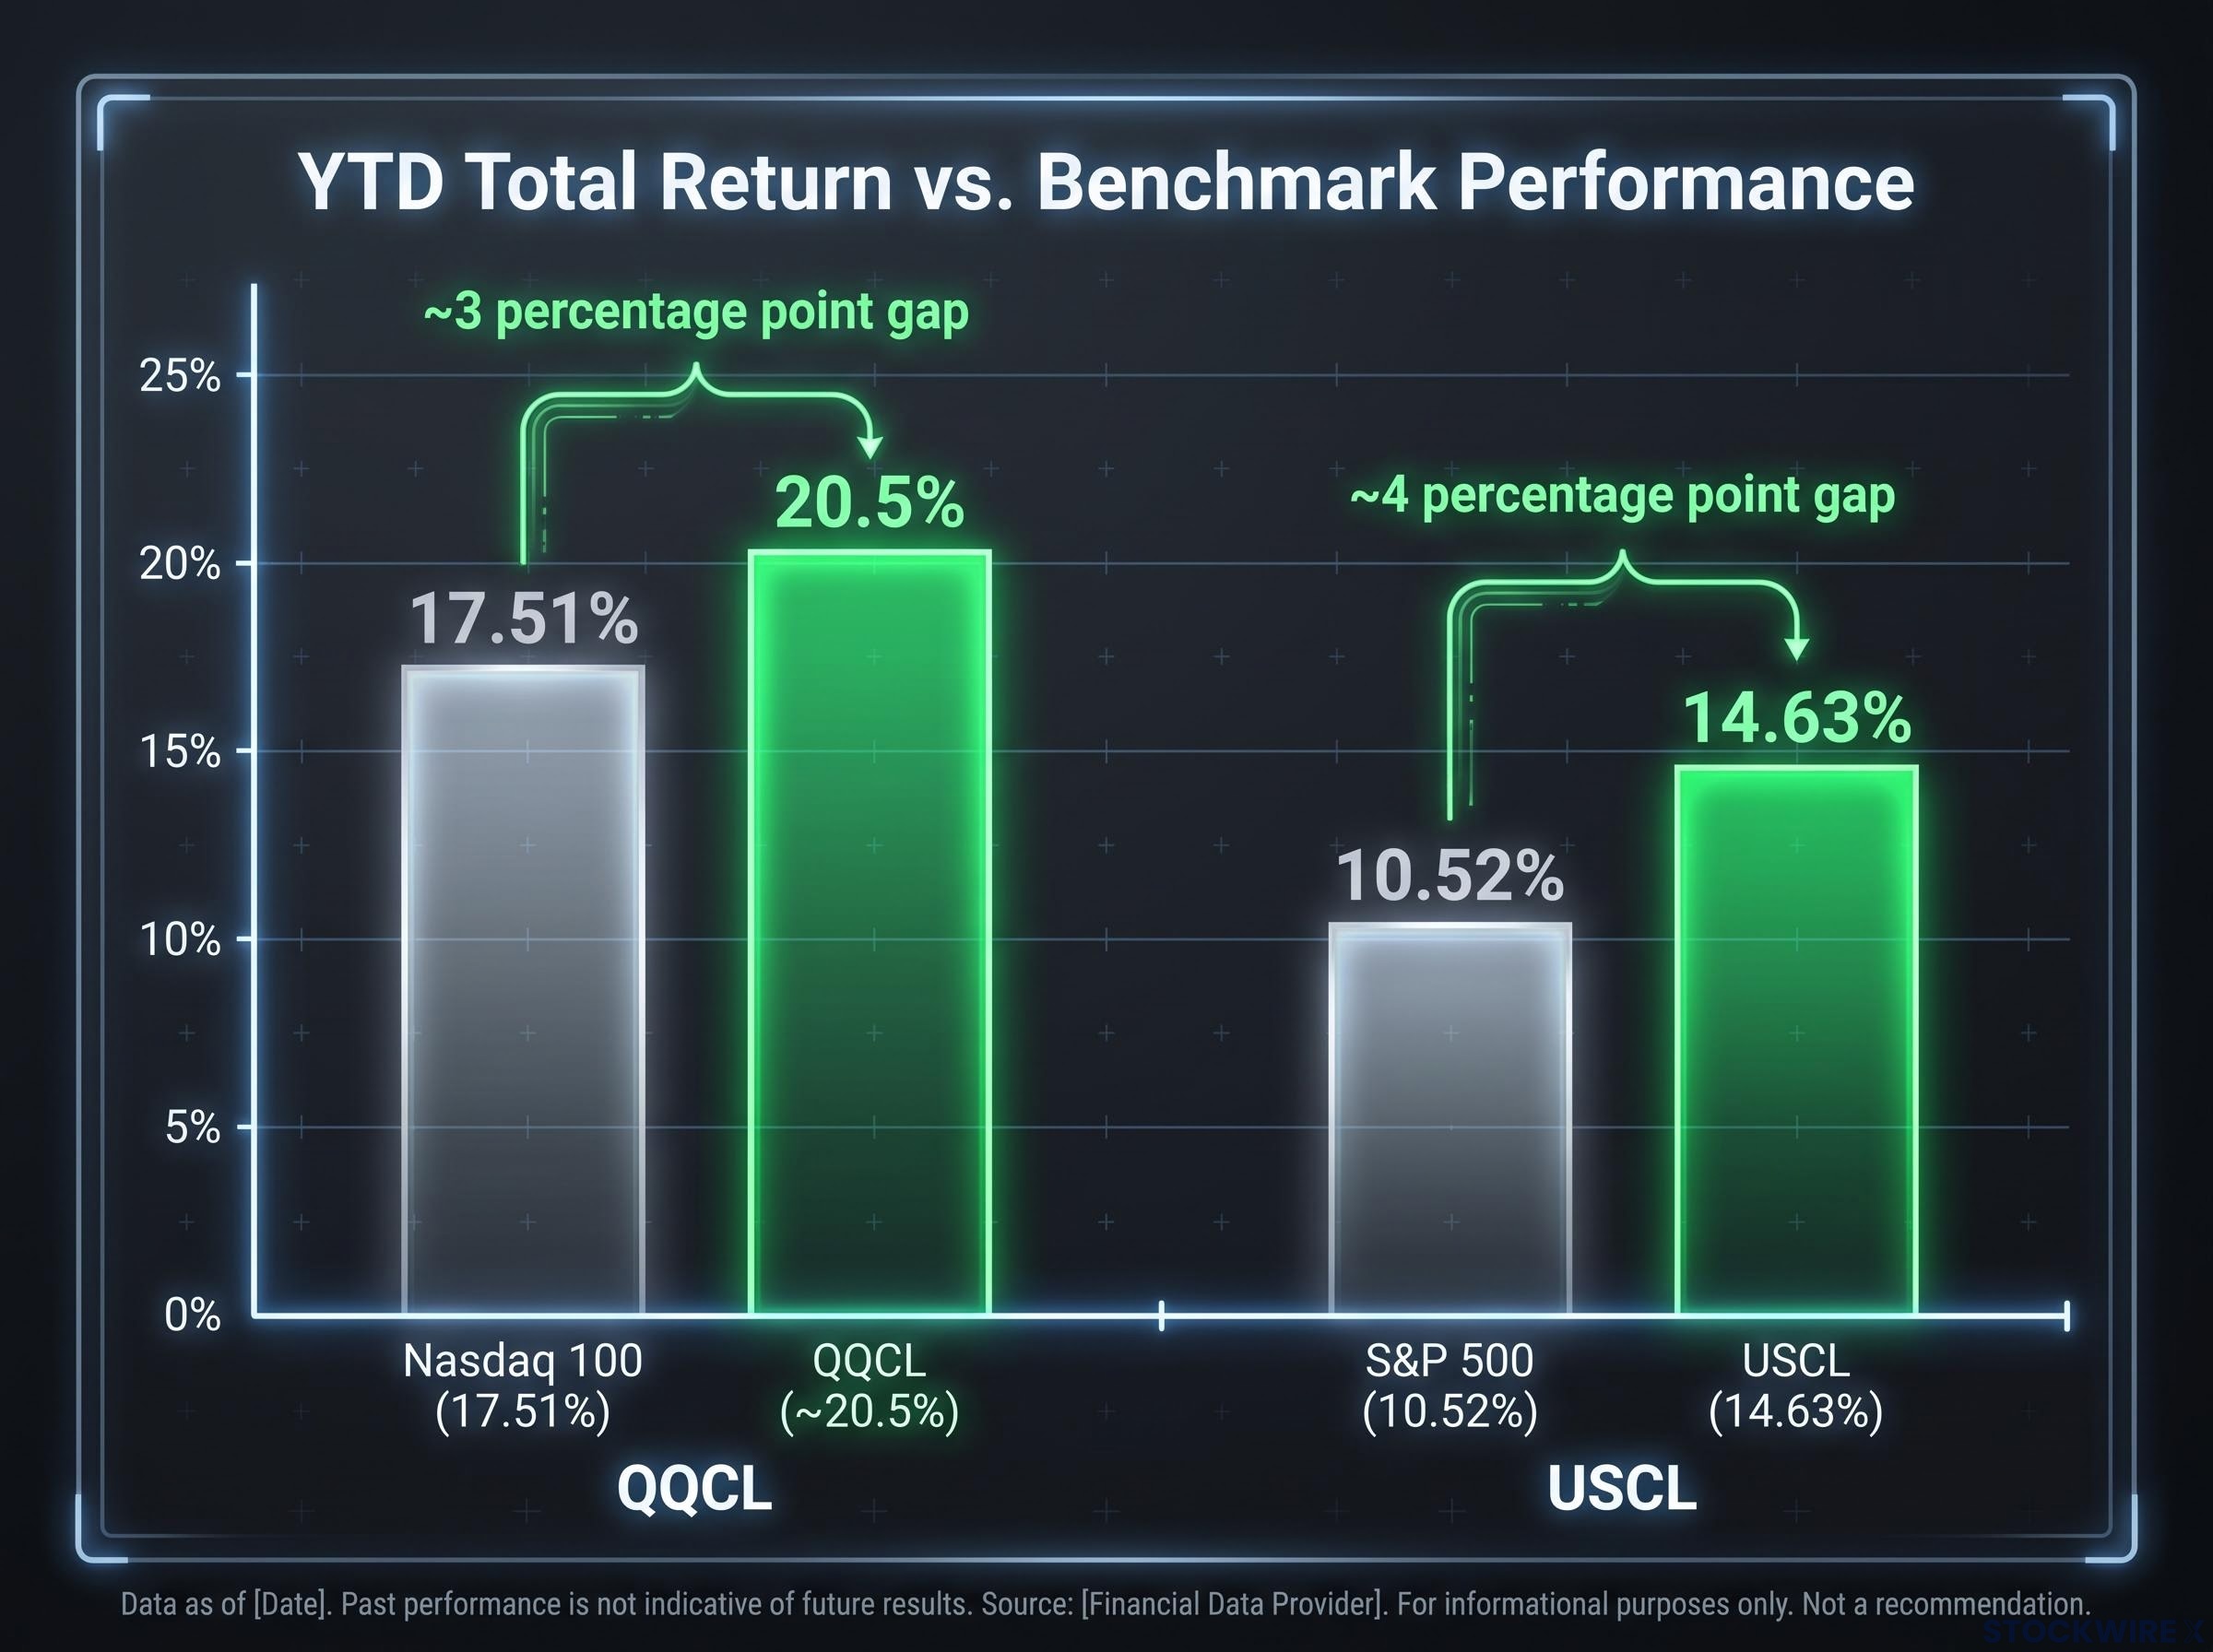
USCL’s year-to-date total return of 14.63% against the S&P 500’s 10.52%**** translates to a roughly 4-percentage-point margin of outperformance, which is the wider relative gap between either fund and its benchmark.
Early distribution “overshoots” followed by normalisation are structurally common in covered call funds when options premiums spike temporarily. They do not necessarily indicate a broken fund. USCL’s retreating distributions look concerning in isolation; its total return relative to its benchmark does not.
What this tells you is that a fund can have a flat or declining distribution history and still be doing its job effectively relative to its benchmark. Distribution growth and total return are measuring different things, and income investors need both lenses before making a switch decision.
Rigorous covered call ETF evaluation requires looking beyond headline yield to distribution streak length, lifetime payout growth rate, and total return context; the QQCL and USCL comparison in this article applies exactly that three-metric lens, where distribution trajectory and benchmark-relative return together produce a fuller picture than either measure alone.
How sector composition shapes risk, not just income
The same structural features that give QQCL its income advantage also shape its risk profile. Higher premiums and heavier drawdowns come from the same source: concentration in volatile sectors.
- Nasdaq 100: ~100 holdings, ~66% technology, 0% financials, higher volatility profile
- S&P 500: ~500 holdings, ~35% technology, ~12% financials, lower volatility profile
The S&P 500’s exposure to financials, industrials, energy, consumer staples, and utilities provides a broader cushion during market stress, even though those sectors add less to options premium income. The Nasdaq 100 tends to experience steeper declines in falling markets precisely because of its concentration in the sectors that generate the richest premiums.
The risk tradeoff is explicit: QQCL offers higher income growth potential paired with more pronounced sensitivity to tech sector volatility and drawdowns. USCL offers lower income growth potential paired with more resilience across a broader range of market environments.
When the leverage overlay amplifies the index difference
25% leverage on a high-volatility, premium-rich base compounds income growth over time more than the same leverage applied to a smoother, lower-volatility base. Leverage is a multiplier on the underlying dynamic, not a corrective force. It does not reduce the income gap between the two funds, and it does not reduce the drawdown sensitivity gap either.
The 25% leverage overlay both QQCL and USCL apply is one expression of a broader product category: leveraged covered call ETFs that combine fractional leverage with a call-writing overlay to produce portfolio deltas close to 1.0 while generating yields that can exceed 13%, a structural design that has accumulated over $3 billion in Canadian-listed AUM alone.
In stress environments, leveraged positions in tech-concentrated indexes tend to experience sharper mark-to-market losses than leveraged positions in broader, more diversified indexes. If you already hold significant technology exposure elsewhere in your portfolio, tilting heavily toward QQCL compounds that concentration risk. Your existing portfolio context should weigh on how much of each fund to hold.
Hold, tilt, or combine: building the allocation decision
The QQCL versus USCL question is not a binary choice. It is a calibration exercise where the right answer depends on what you already own, what your income priorities are, and how much concentration risk you can tolerate.
- Tilt toward QQCL if income growth is your primary objective, you are comfortable with tech-heavy exposure and higher volatility, and your portfolio has limited existing Nasdaq 100 exposure. The structural premium advantage of the Nasdaq 100’s volatility profile means QQCL is likely to continue generating richer distributions over time, though that comes with sharper drawdowns when tech sells off.
- Maintain USCL if you want sector diversification across financials, industrials, energy, and utilities that the Nasdaq 100 entirely excludes. USCL’s approximately 4-percentage-point year-to-date outperformance of the S&P 500 provides a substantive reason to retain it beyond distribution growth optics. If your portfolio already carries significant technology weighting, USCL acts as a counterbalance rather than a drag.
- Hold both as the analytically supported default. They tap different volatility and sector profiles, so their income and return patterns will diverge across market cycles. Tech volatility could compress in future periods, potentially narrowing QQCL’s income advantage and making USCL’s broader base more competitively positioned. The source analysis behind this article reached the same endpoint: reviewing USCL purely through the lens of distribution figures raised questions about retaining it, but examining total return performance alongside that data made the case for keeping both funds intact.
For most income-focused investors already holding both funds, the decision is not whether to exit USCL but how to weight the two funds relative to overall portfolio technology exposure and cash-flow targets.
This article is for informational purposes only and should not be considered financial advice. Investors should conduct their own research and consult with financial professionals before making investment decisions. Past performance does not guarantee future results, and the total return and distribution figures referenced are historical and subject to change based on market conditions.
What the income gap actually settles, and what it leaves open
The divergence in lifetime distribution growth, roughly 24% for QQCL against 2% for USCL, follows directly from implied volatility differences between the Nasdaq 100 and the S&P 500. Higher premiums flow from higher volatility, and the Nasdaq 100 structurally produces both. This is a mechanical explanation, not a verdict on USCL’s management or fund design. That question is closed.
What remains open is how the comparison evolves from here. Changes in tech sector implied volatility, sector rotation affecting S&P 500 premium dynamics, and the role of leverage in amplifying any directional shift in either index’s volatility regime could all narrow or widen the gap over time. Both funds have delivered positive total return outperformance versus their respective benchmarks year-to-date as of mid-2026, which confirms the mechanics are working on both sides.
The gap between implied versus realised volatility is a critical context variable for covered call income in 2026: through mid-June, implied volatility ran above 23% while realised volatility remained below 14%, a spread that elevated option premiums beyond what actual price movement would historically justify and contributed to the richer distribution environment both QQCL and USCL operated in year-to-date.
The practical reframing is this: the right question is not “which fund performs better” but “which fund’s income and risk profile fits my portfolio right now.” Four takeaways to carry forward:
- Implied volatility is the income engine. The index underneath determines premium richness, not the fund wrapper around it.
- Total return is the corrective lens. Distribution growth alone can mischaracterise a fund that is outperforming its benchmark.
- Leverage is a multiplier, not a transformer. It amplifies whatever the underlying dynamic already produces, on both the income and drawdown sides.
- Holding both is the analytically grounded default for diversified income investors, because it hedges against volatility regime shifts that neither fund can control.
—