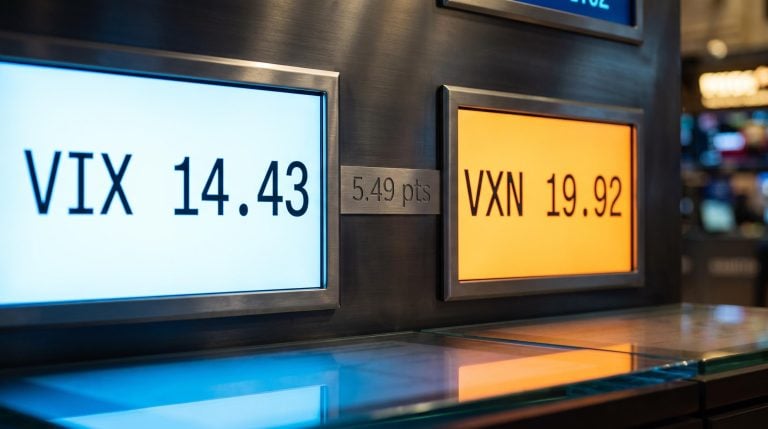
Two covered call ETFs. Same manager. Same fee structure. Same distribution policy. One tracks the Nasdaq 100. The other tracks the S&P 500. After several years, their lifetime distribution histories look nothing alike.
Income investors comparing Nasdaq 100 covered call ETFs against their S&P 500 equivalents, across both Canadian and US markets, keep encountering the same pattern: the Nasdaq 100 versions have grown their distributions materially faster. The gap is not small, and it is not confined to one fund house or one country. It is consistent enough to warrant a structural explanation, not just a passing observation.
Here is what the distribution data actually shows, why the gap exists, and how to think about it before choosing between these two fund types.
Why option premiums are not equal across indices
Covered call income is monetised volatility. A covered call ETF holds an index and sells call options against it, collecting premiums that flow to investors as distributions. The size of those premiums depends directly on implied volatility, which is the market’s expectation of how much the underlying index will move. Higher implied volatility means richer option premiums. Lower implied volatility means thinner ones.
The relationship between implied volatility and premium size is well-established in academic literature; volatility risk premium research on options pricing confirms that higher implied volatility systematically produces richer premiums, which is the foundational mechanism driving the distribution gap between Nasdaq 100 and S&P 500 covered call strategies.
The Nasdaq 100’s composition, dominated by growth and technology names with volatile earnings profiles and faster sentiment cycles, produces structurally higher implied volatility than the S&P 500’s broader, more diversified mix. That premium difference compounds every month or quarter when new options are written.
Implied volatility is not a static feature of any index; it rises and compresses with earnings cycles, macro events, and sector sentiment shifts, which is why the Nasdaq 100’s structural premium over the S&P 500 on this measure can widen significantly during periods of intense scrutiny of mega-cap technology earnings.
The appreciation base effect
There is a second layer to the gap. Covered call strategies write options at or near the current index level, and premiums are expressed as a percentage of the underlying price. A higher-appreciation index produces larger absolute dollar premiums even if percentage volatility holds constant. Over the past decade, the Nasdaq 100 has delivered a stronger capital appreciation trajectory than the S&P 500. That rising base feeds directly into steadily larger option premiums, which in turn support faster distribution growth.
The third factor is concentration. The Nasdaq 100 is heavily weighted toward a small cluster of mega-cap technology names, often referred to as the Magnificent Seven, which carry among the deepest options markets and highest implied volatilities in the large-cap universe. An S&P 500 covered call fund spreads exposure across hundreds of stocks, many carrying much lower volatility, diluting the aggregate premium yield.
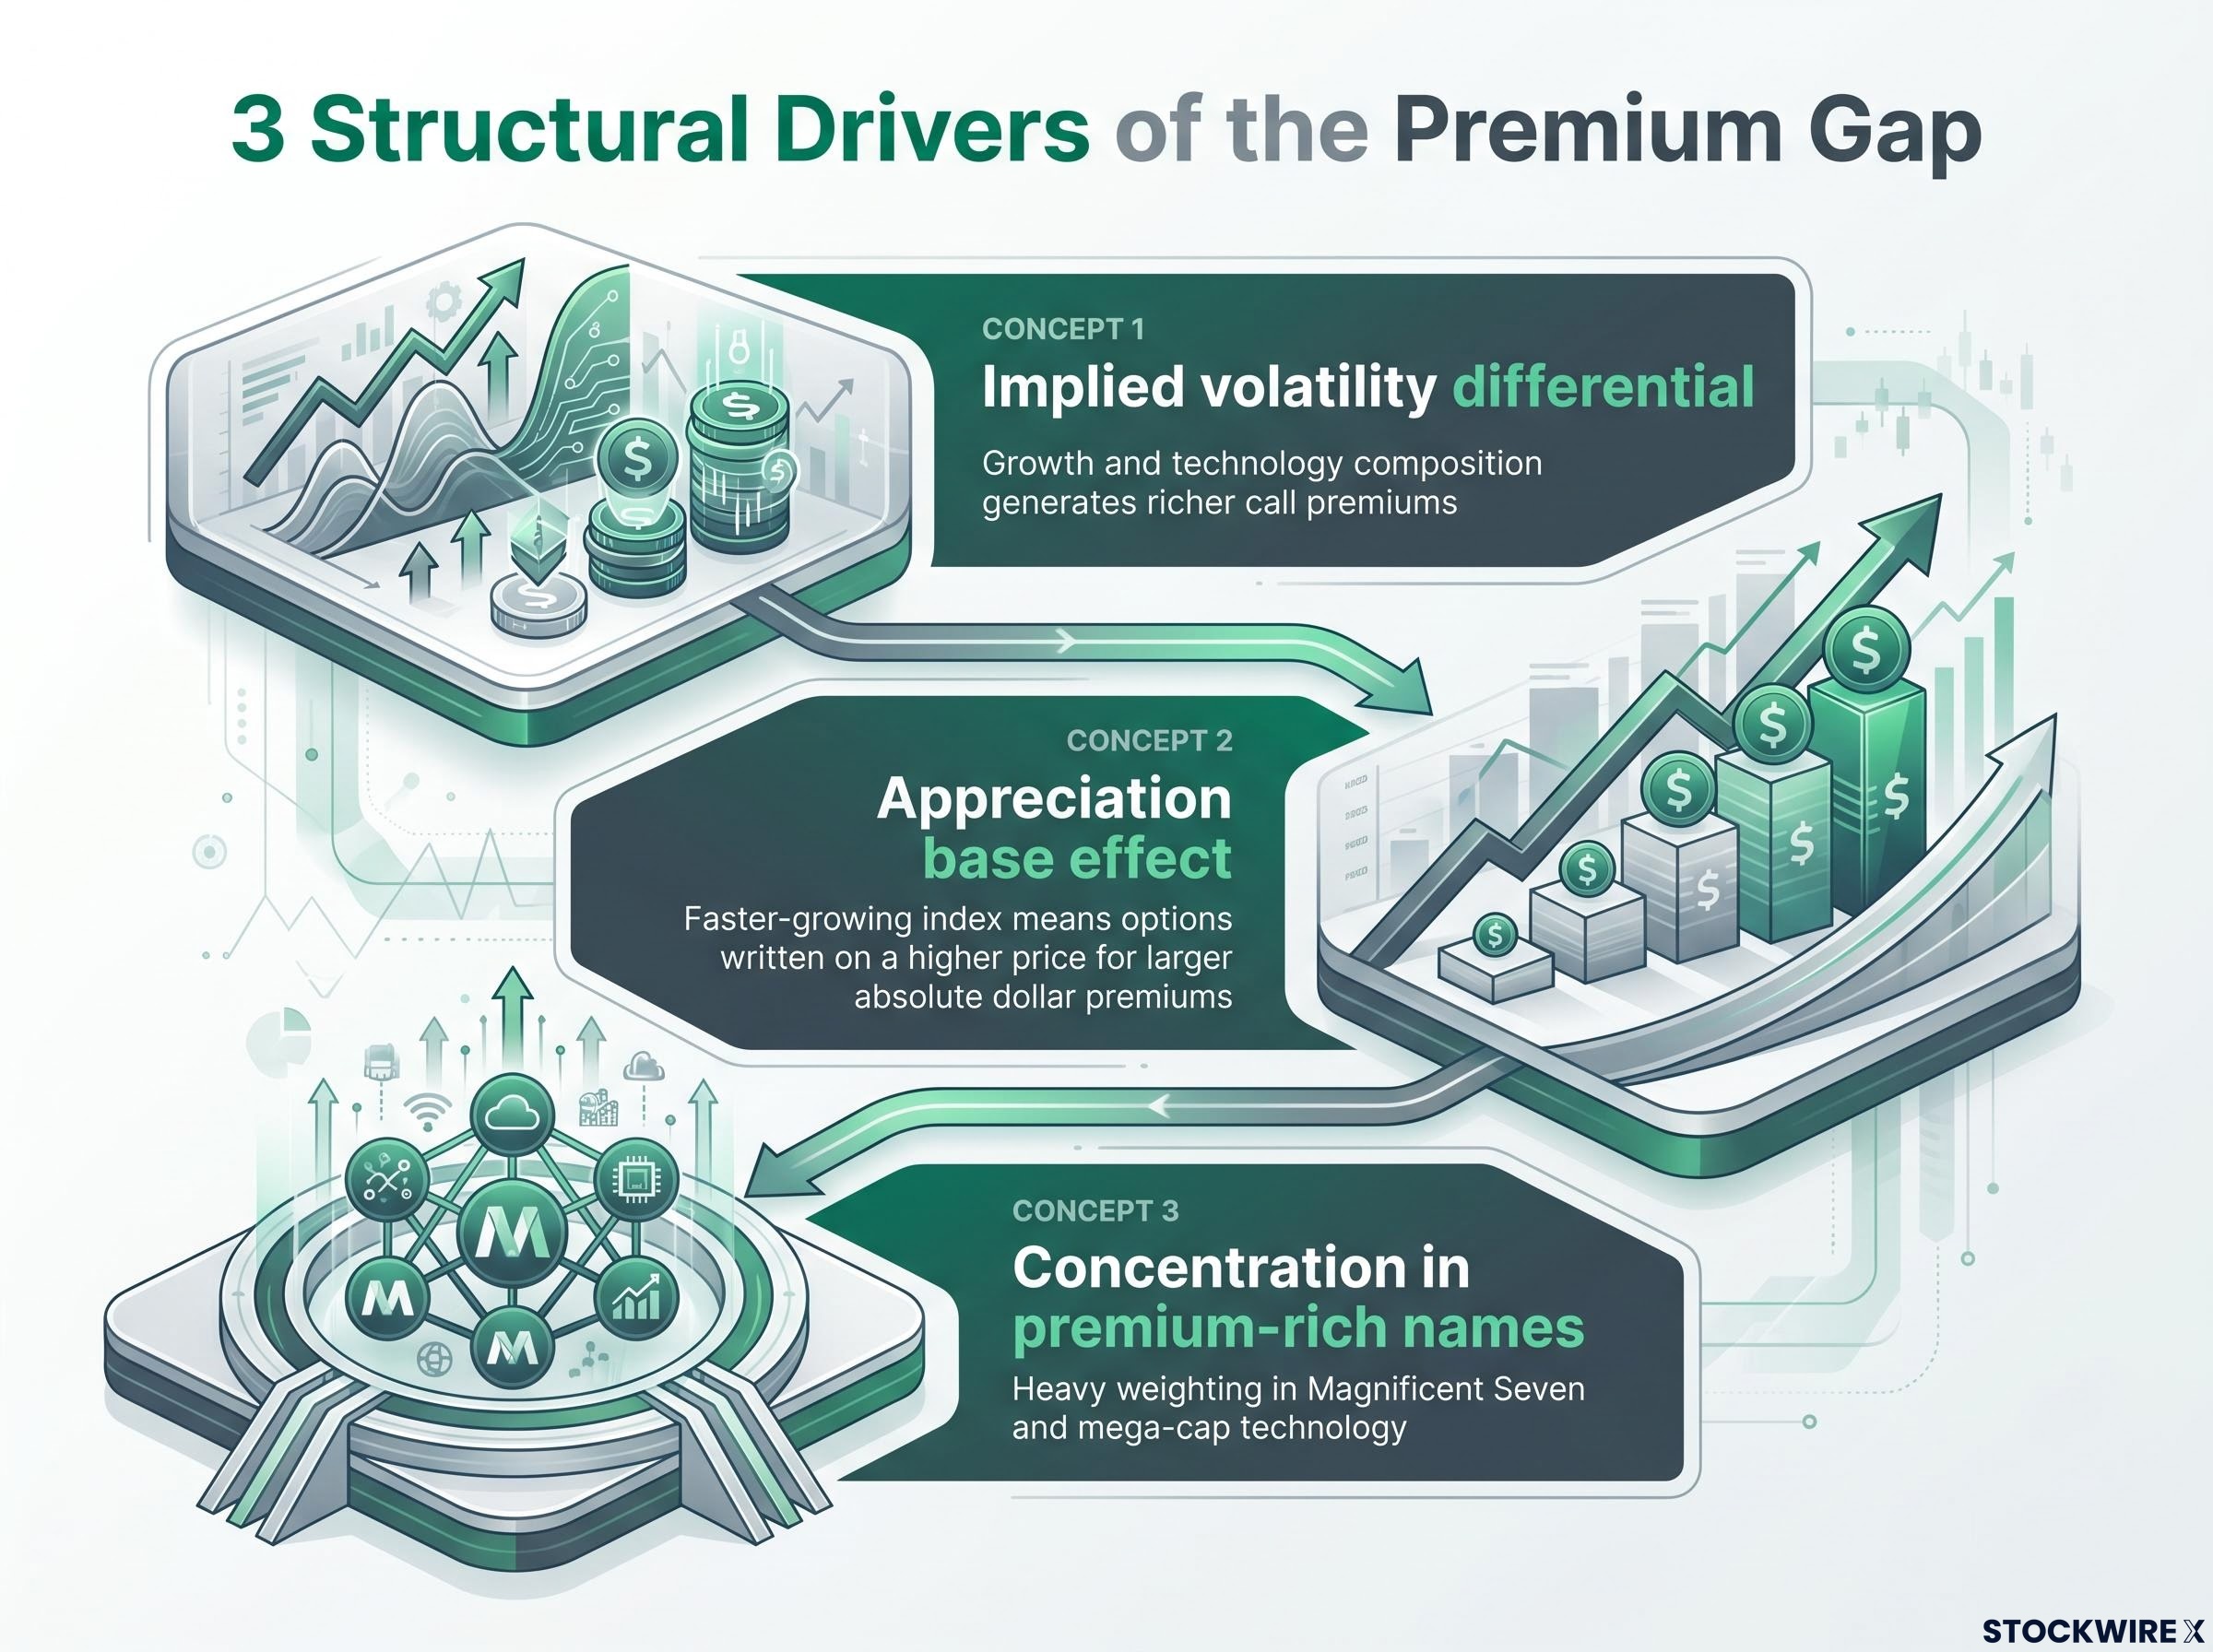
Three structural drivers explain why the gap persists:
- Implied volatility differential: The Nasdaq 100’s growth and technology composition generates richer call premiums at each reset cycle than the S&P 500’s broader, lower-volatility mix.
- Appreciation base effect: A faster-growing index means each new round of options is written on a higher price, producing larger absolute dollar premiums over time.
- Concentration in premium-rich names: Heavy weighting in mega-cap technology creates a cluster of deeply liquid, high-premium options that broader index exposure cannot replicate.
The premium gap is not random and it is not managerial. It is baked into the structural composition of the two indices, which means it will persist as a long-run tendency for as long as the Nasdaq 100 retains its growth and volatility character.
When big ASX news breaks, our subscribers know first
What the fund data actually shows
The Canadian market offers the cleanest signal. Canadian covered call ETFs frequently use managed distribution policies that smooth month-to-month noise, making lifetime payout trajectories directly comparable when manager, fees, and structure are held constant.
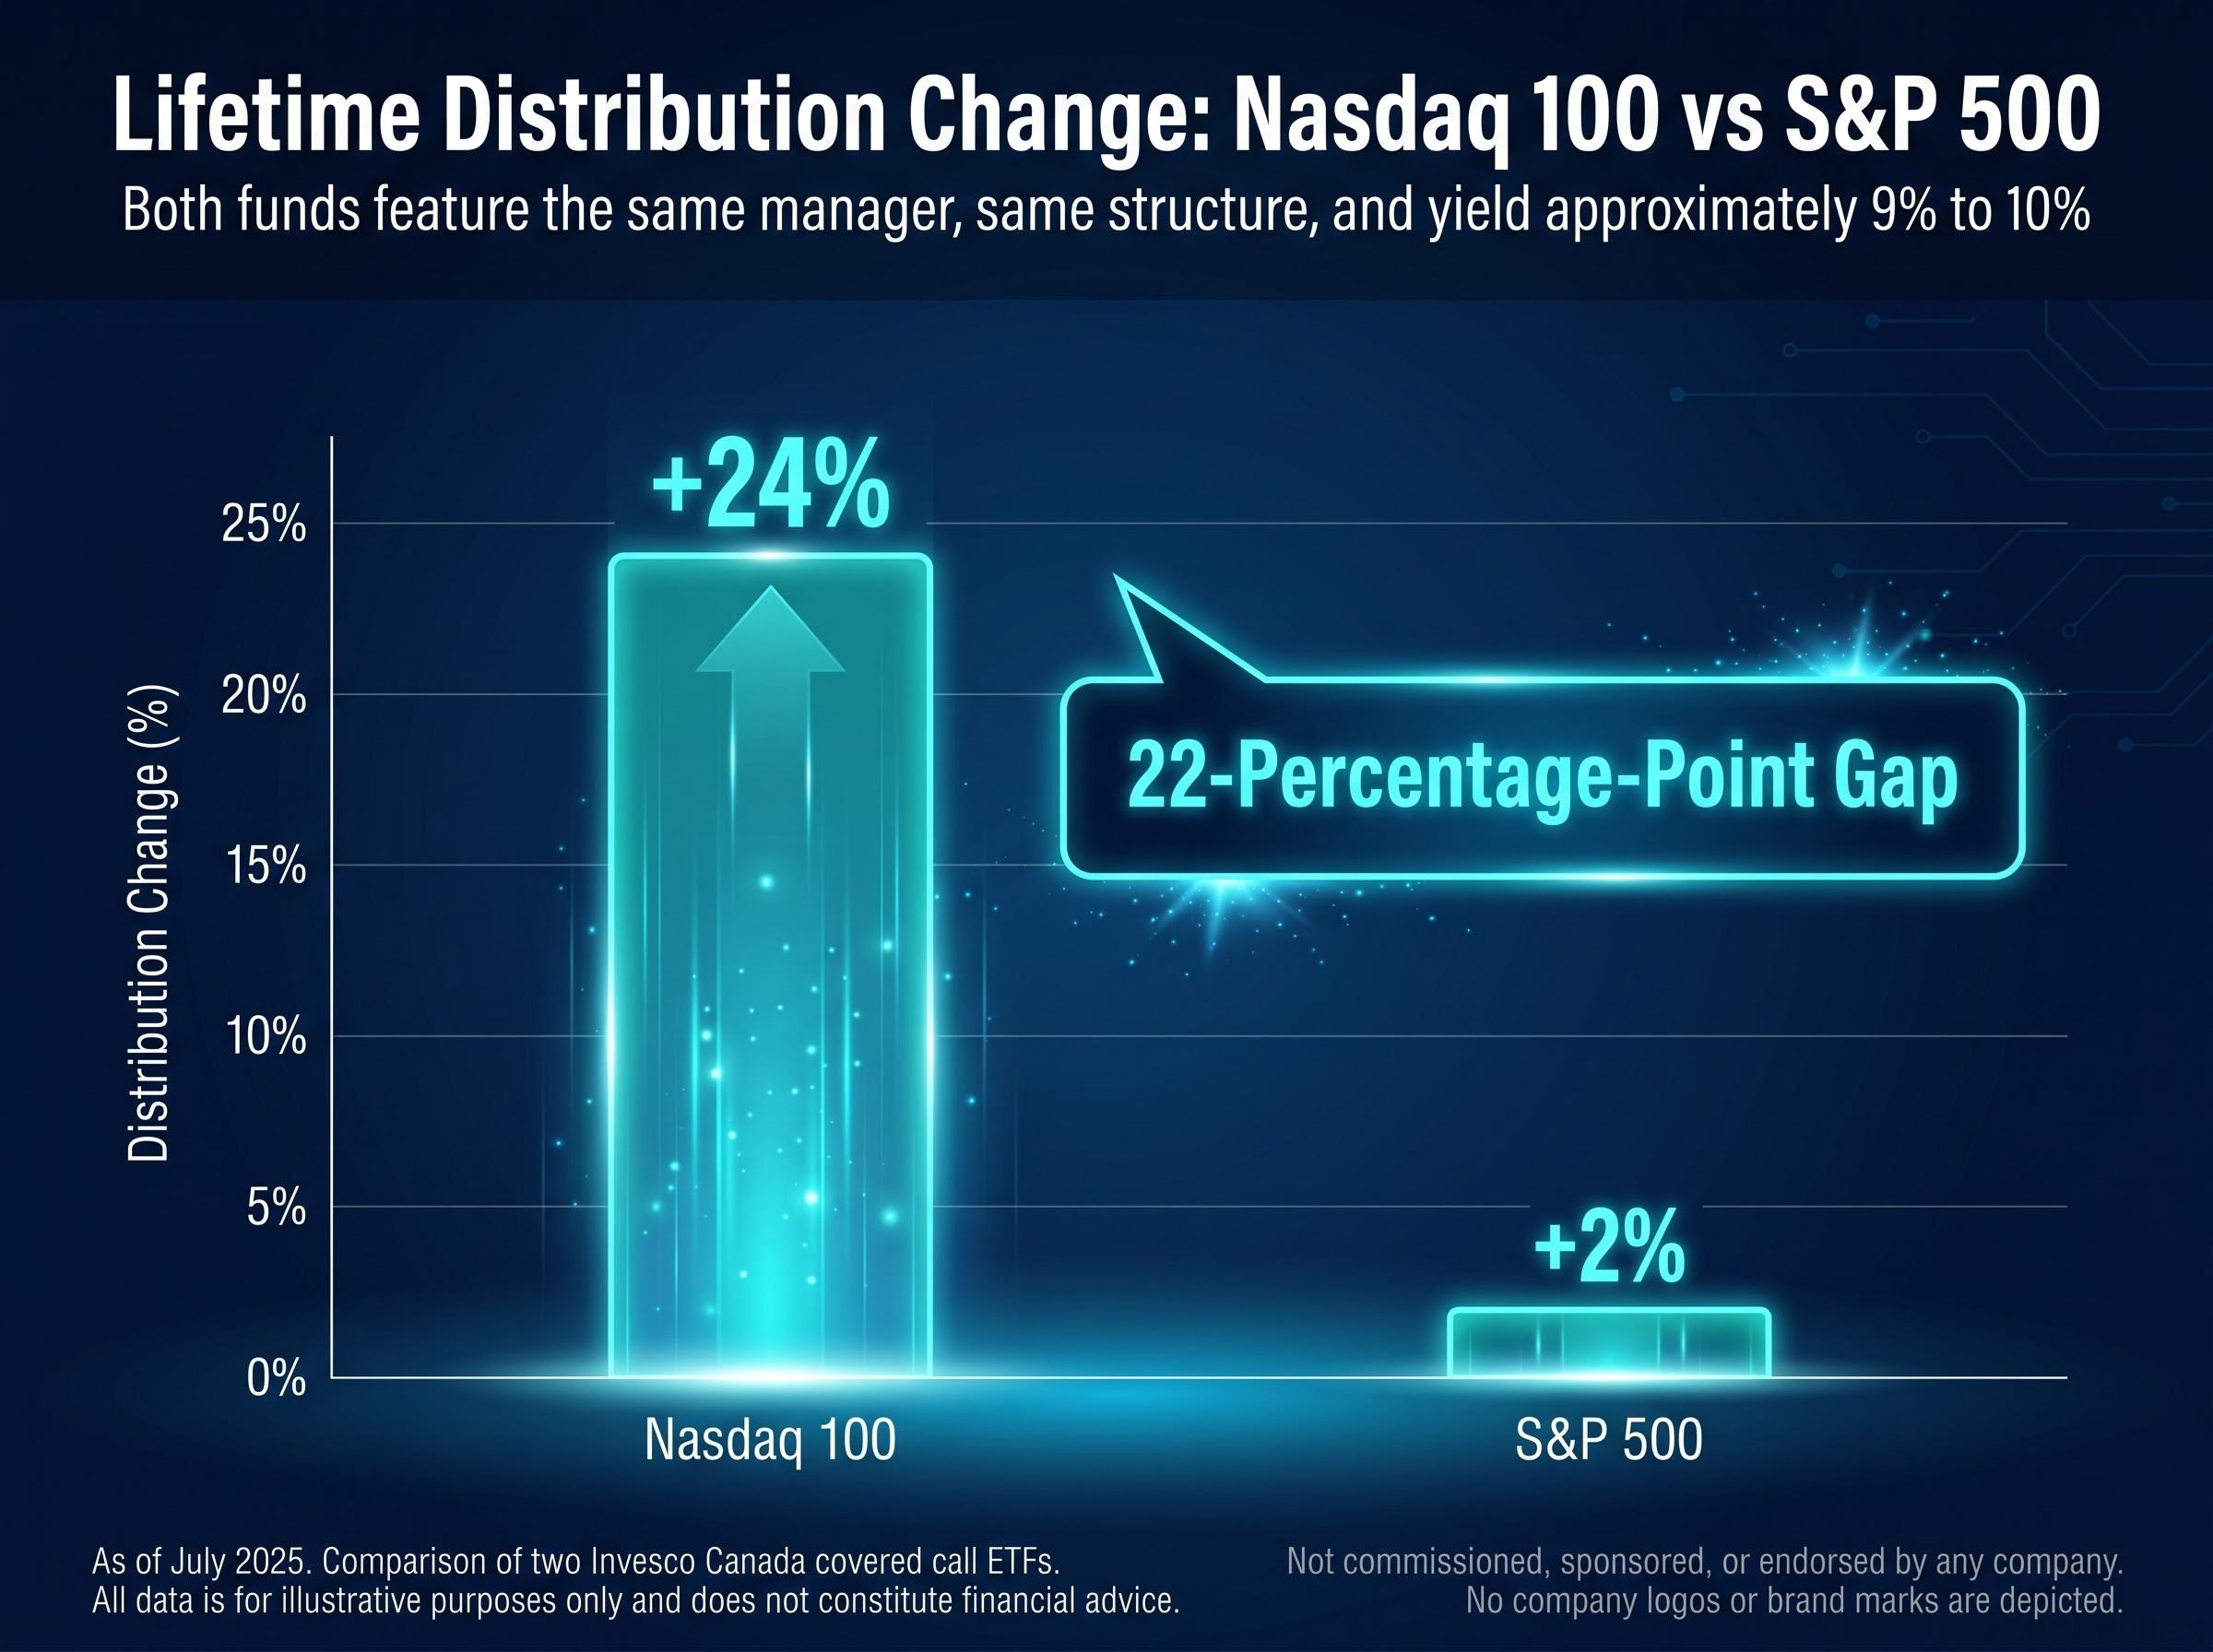
The Invesco Canada comparison is the anchor data point. Invesco’s Nasdaq 100 covered call ETF showed a lifetime distribution change of approximately +24% as of July 2025. Its S&P 500 equivalent, from the same manager with the same fee structure, showed approximately +2%. That is roughly a 22-percentage-point gap from identical fund architecture, with only the underlying index changed.
The pattern holds across management teams. SQMX (a Nasdaq 100 proxy fund) versus SMAX (an S&P 500 proxy fund), from a separate Canadian manager, showed a consistent directional gap, confirming the Invesco result is not a single-manager anomaly.
Comparing lifetime distribution changes rather than current yield requires a consistent evaluation framework, and distribution streak length is one of three metrics that separates funds generating genuine income growth from those masking stagnation behind an unchanged headline rate.
US fund data is noisier. Unlike their Canadian counterparts, many American covered call ETFs operate on fully variable payout structures that can produce month-over-month distribution swings of 200% to 300%, a level of volatility in payouts that is entirely routine in that market. But the pattern holds over longer windows. GPIC, a Nasdaq 100-linked US fund, appeared in the top distribution increase rankings; its S&P 500 equivalent T6 did not.
One comparison illustrates why short measurement windows can mislead. Tap Alpha’s TDAC (Nasdaq 100-linked, with modest leverage, launched January 2025) reported a lifetime distribution change of approximately +3.57% as of the July 2025 snapshot, while its S&P 500 equivalent TSPA showed approximately +8.88% over the same period. Both funds are barely six months old, and the research explicitly flags this as an example of short-window distortion. TDAC’s approximately 20% month-over-month distribution increase signals underlying Nasdaq 100 momentum that is likely to reassert the structural direction over time.
The approximately 22-percentage-point lifetime distribution growth gap from the Invesco Canada comparison, replicated directionally across multiple managers and both countries, is the clearest signal that this is an index-driven effect worth factoring into fund selection, not noise.
| Fund | Index Exposure | Lifetime Distribution Change | Notes |
|---|---|---|---|
| Invesco Canada (Nasdaq 100) | Nasdaq 100 | ~+24% | As of July 2025 |
| Invesco Canada (S&P 500) | S&P 500 | ~+2% | As of July 2025; same manager, same structure |
| SQMX | Nasdaq 100 proxy | Consistent with Invesco pattern | Separate manager; confirms cross-manager pattern |
| SMAX | S&P 500 proxy | Lower than SQMX | Separate manager; consistent with Invesco gap |
| GPIC | Nasdaq 100 | Top distribution increase ranking | US market; appeared in top-performers list |
| T6 | S&P 500 | Did not rank | US market; S&P 500 equivalent of GPIC |
| TDAC | Nasdaq 100 (modest leverage) | ~+3.57% | Launched Jan 2025; short window caveat applies |
| TSPA | S&P 500 | ~+8.88% | Launched Jan 2025; short window temporarily inverts expected pattern |
How covered call structures actually work for income investors
If you want income from a stock portfolio without selling your holdings, a covered call ETF is one of the most direct mechanisms available. The structure is straightforward:
- The ETF holds index exposure. It owns the stocks in the Nasdaq 100 or S&P 500, giving you participation in the underlying index.
- Call options are written against those holdings at regular intervals. The fund sells call options, typically monthly or quarterly, which gives the buyer the right to purchase the index at a set price. In exchange, the fund collects a premium.
- Premiums collected are paid out as distributions to unitholders. That premium income is what you receive as your distribution, which is why covered call ETFs can offer yields well above what dividends alone would produce.
The trade-off is direct: selling calls caps some of the index’s upside. If the Nasdaq 100 surges past the strike price, the fund does not fully participate in that rally. You are exchanging maximum capital growth for current income.
What drives the distribution level over time
Invesco’s Canadian covered call ETFs in this comparison yield approximately 9% to 10%, illustrating the income level these strategies can generate in practice. But the distribution is not fixed. Because the income stream resets with each new round of options, distribution levels adjust over time with market conditions, specifically with the volatility and price level of the underlying index.
That last point is where the choice of index becomes the dominant variable. If you are evaluating these funds primarily on headline yield today, you are asking the wrong question. The more meaningful question is which underlying index is structurally better positioned to grow those payouts over time, not just sustain the current level.
When the Nasdaq 100 advantage narrows or reverses
The structural advantage is real, but it is not unconditional. In a prolonged technology bear market, or a regime where growth stocks underperform value, the Nasdaq 100’s implied volatility can change character. Capital appreciation can stall or reverse. The distribution edge can shrink or disappear entirely.
Historical precedent from the early-2000s technology bust demonstrates that Nasdaq-centric income strategies can experience deep distribution cuts when the sector is out of favour for extended periods.
Leveraged covered call ETFs occupy a specific position within this framework: by combining 1.25x equity exposure with a call-writing overlay, they attempt to amplify both the premium income and the appreciation base simultaneously, though the leverage also amplifies drawdown risk during the technology sector corrections that represent the primary cyclical threat to Nasdaq 100-linked strategies.
Measurement window risk compounds the cyclical risk. The TDAC versus TSPA comparison illustrates this directly: two funds launched in January 2025, and by the July 2025 snapshot, the S&P 500 version temporarily led on lifetime distribution growth. In the US market, fully variable distribution structures mean that individual funds can register month-over-month payout moves of 200% to 300%, making any short-window single-fund comparison unreliable for inferring structural index effects.
The structural thesis is most visible in managed-distribution structures and over longer time horizons, not in any single month’s payout.
Three conditions under which the Nasdaq 100 covered call distribution advantage is most likely to narrow:
- Extended technology sector drawdowns that compress Nasdaq 100 valuations and reduce the appreciation base for premium calculations.
- Rising-rate environments where growth valuations compress broadly, reducing the implied volatility premium that technology names command.
- Short measurement windows from recently launched funds, where a few months of path-dependent option outcomes can temporarily invert the expected direction.
The Nasdaq 100 distribution edge is a tendency to account for in a longer-term portfolio construction decision, not a guarantee to act on in a single reporting period.
Translating the pattern into a portfolio positioning decision
The choice between Nasdaq 100 and S&P 500 covered call exposure is not binary. It is a portfolio construction question, and your answer depends on what you are optimising for.
There is a meaningful distinction between distribution yield and distribution growth. A high current yield with weak growth is a fundamentally different proposition from a moderate yield with strong growth. If your priority is keeping income ahead of inflation and building long-term purchasing power, the growth path of distributions matters as much as the starting payout level.
| Investor Priority | Preferred Index Exposure | Trade-off to Accept |
|---|---|---|
| Distribution growth over time | Nasdaq 100 | Higher volatility, technology concentration risk |
| Distribution stability and diversification | S&P 500 | Lower long-run payout growth |
| Balance of growth and stability | Combination of both | Requires active monitoring of both sleeves |
The pattern holds across Canadian and US markets and across multiple fund managers, strengthening the case that index selection is the dominant variable. But idiosyncratic fund factors, including option coverage ratios, strike selection, leverage, and tax treatment, can cause individual fund pairs to deviate from the pattern, reinforcing the need to compare like-for-like structures.
Three practical steps for evaluating fund options:
- Identify funds from the same manager with equivalent structures. Holding the manager constant isolates the index effect from fund design differences.
- Compare lifetime distribution changes rather than current yield. The growth trajectory tells you more about forward income potential than today’s annualised payout.
- Extend the comparison window to reduce short-inception noise. Funds with less than a year of history can produce temporarily misleading results, as the TDAC versus TSPA example demonstrates.
For an investor building an income-oriented portfolio today, the practical takeaway is that adding a Nasdaq 100 covered call allocation alongside a diversified income base is the approach most consistent with capturing the structural distribution growth edge while managing downside risk during technology sector corrections.
An index-driven edge with limits worth knowing
The Nasdaq 100 covered call distribution growth advantage is structural, cross-manager, cross-country, and traceable to three specific mechanical factors: higher implied volatility, a faster-growing appreciation base, and concentration in premium-rich mega-cap technology names. It is not luck. It is not manager skill. It is architecture.
The advantage is also conditional. It can compress in technology bear markets, and investors who understand this are better positioned to hold these strategies through cycles rather than reacting to short-term distribution moves.
For investors wanting to stress-test the appreciation base assumption before committing to a Nasdaq 100 covered call allocation, our deep-dive into Nasdaq 100 valuation risk examines the specific technical resistance levels and earnings delivery requirements that determine whether the index’s price trajectory remains supportive of the premium growth thesis.
The evidence supports treating Nasdaq 100 covered call ETFs as a deliberate income growth component within a broader income portfolio, not as a replacement for more diversified income sources. Investors should conduct their own research and consult with financial professionals before making investment decisions.
This article is for informational purposes only and should not be considered financial advice. Past performance does not guarantee future results. Distribution projections are subject to market conditions and various risk factors.
—