Two companies that have raised their dividends every single year for 54 consecutive years, through the dot-com crash, the 2008 financial crisis, and the COVID-19 pandemic, are trading at price-to-earnings multiples the market has not assigned them since trough periods. That is not a typo. It is a valuation anomaly hiding in plain sight.
The reason is timing. Premium valuations in mid-2026 are concentrated in AI and technology names, leaving businesses in healthcare and consumer staples temporarily repriced. A reader scanning the market right now would not naturally land on Becton Dickinson (BDX) or Kimberly-Clark (KMB) as undervalued dividend kings. That mismatch is precisely where the opportunity sits, if the discount is real rather than deserved.
Here is what you walk away with: a data-driven framework for determining whether the compression in each company represents a genuine entry point or a value trap, and a clear map of which investor profile each stock actually suits. The numbers do the talking. Your job is to decide what they mean for your portfolio.
What 54 consecutive years of dividend increases actually signals
A Dividend King is a company that has raised its dividend for at least 50 consecutive years. That is a higher bar than the more commonly cited Dividend Aristocrat designation, which requires only 25 years. Fewer than 50 companies in the entire US market carry the Dividend King label.
54 years sounds like a marketing statistic. It is not. Consider what the streak survived:
- Both BDX and KMB maintained uninterrupted dividend increases through the dot-com crash, the 2008 financial crisis, and the COVID-19 pandemic
- KMB has paid dividends for 92 consecutive years, a record stretching back to the Great Depression era
- BDX has been in operation for more than 120 years, delivering healthcare products through segments of the sector that carry less volatility than pharmaceuticals
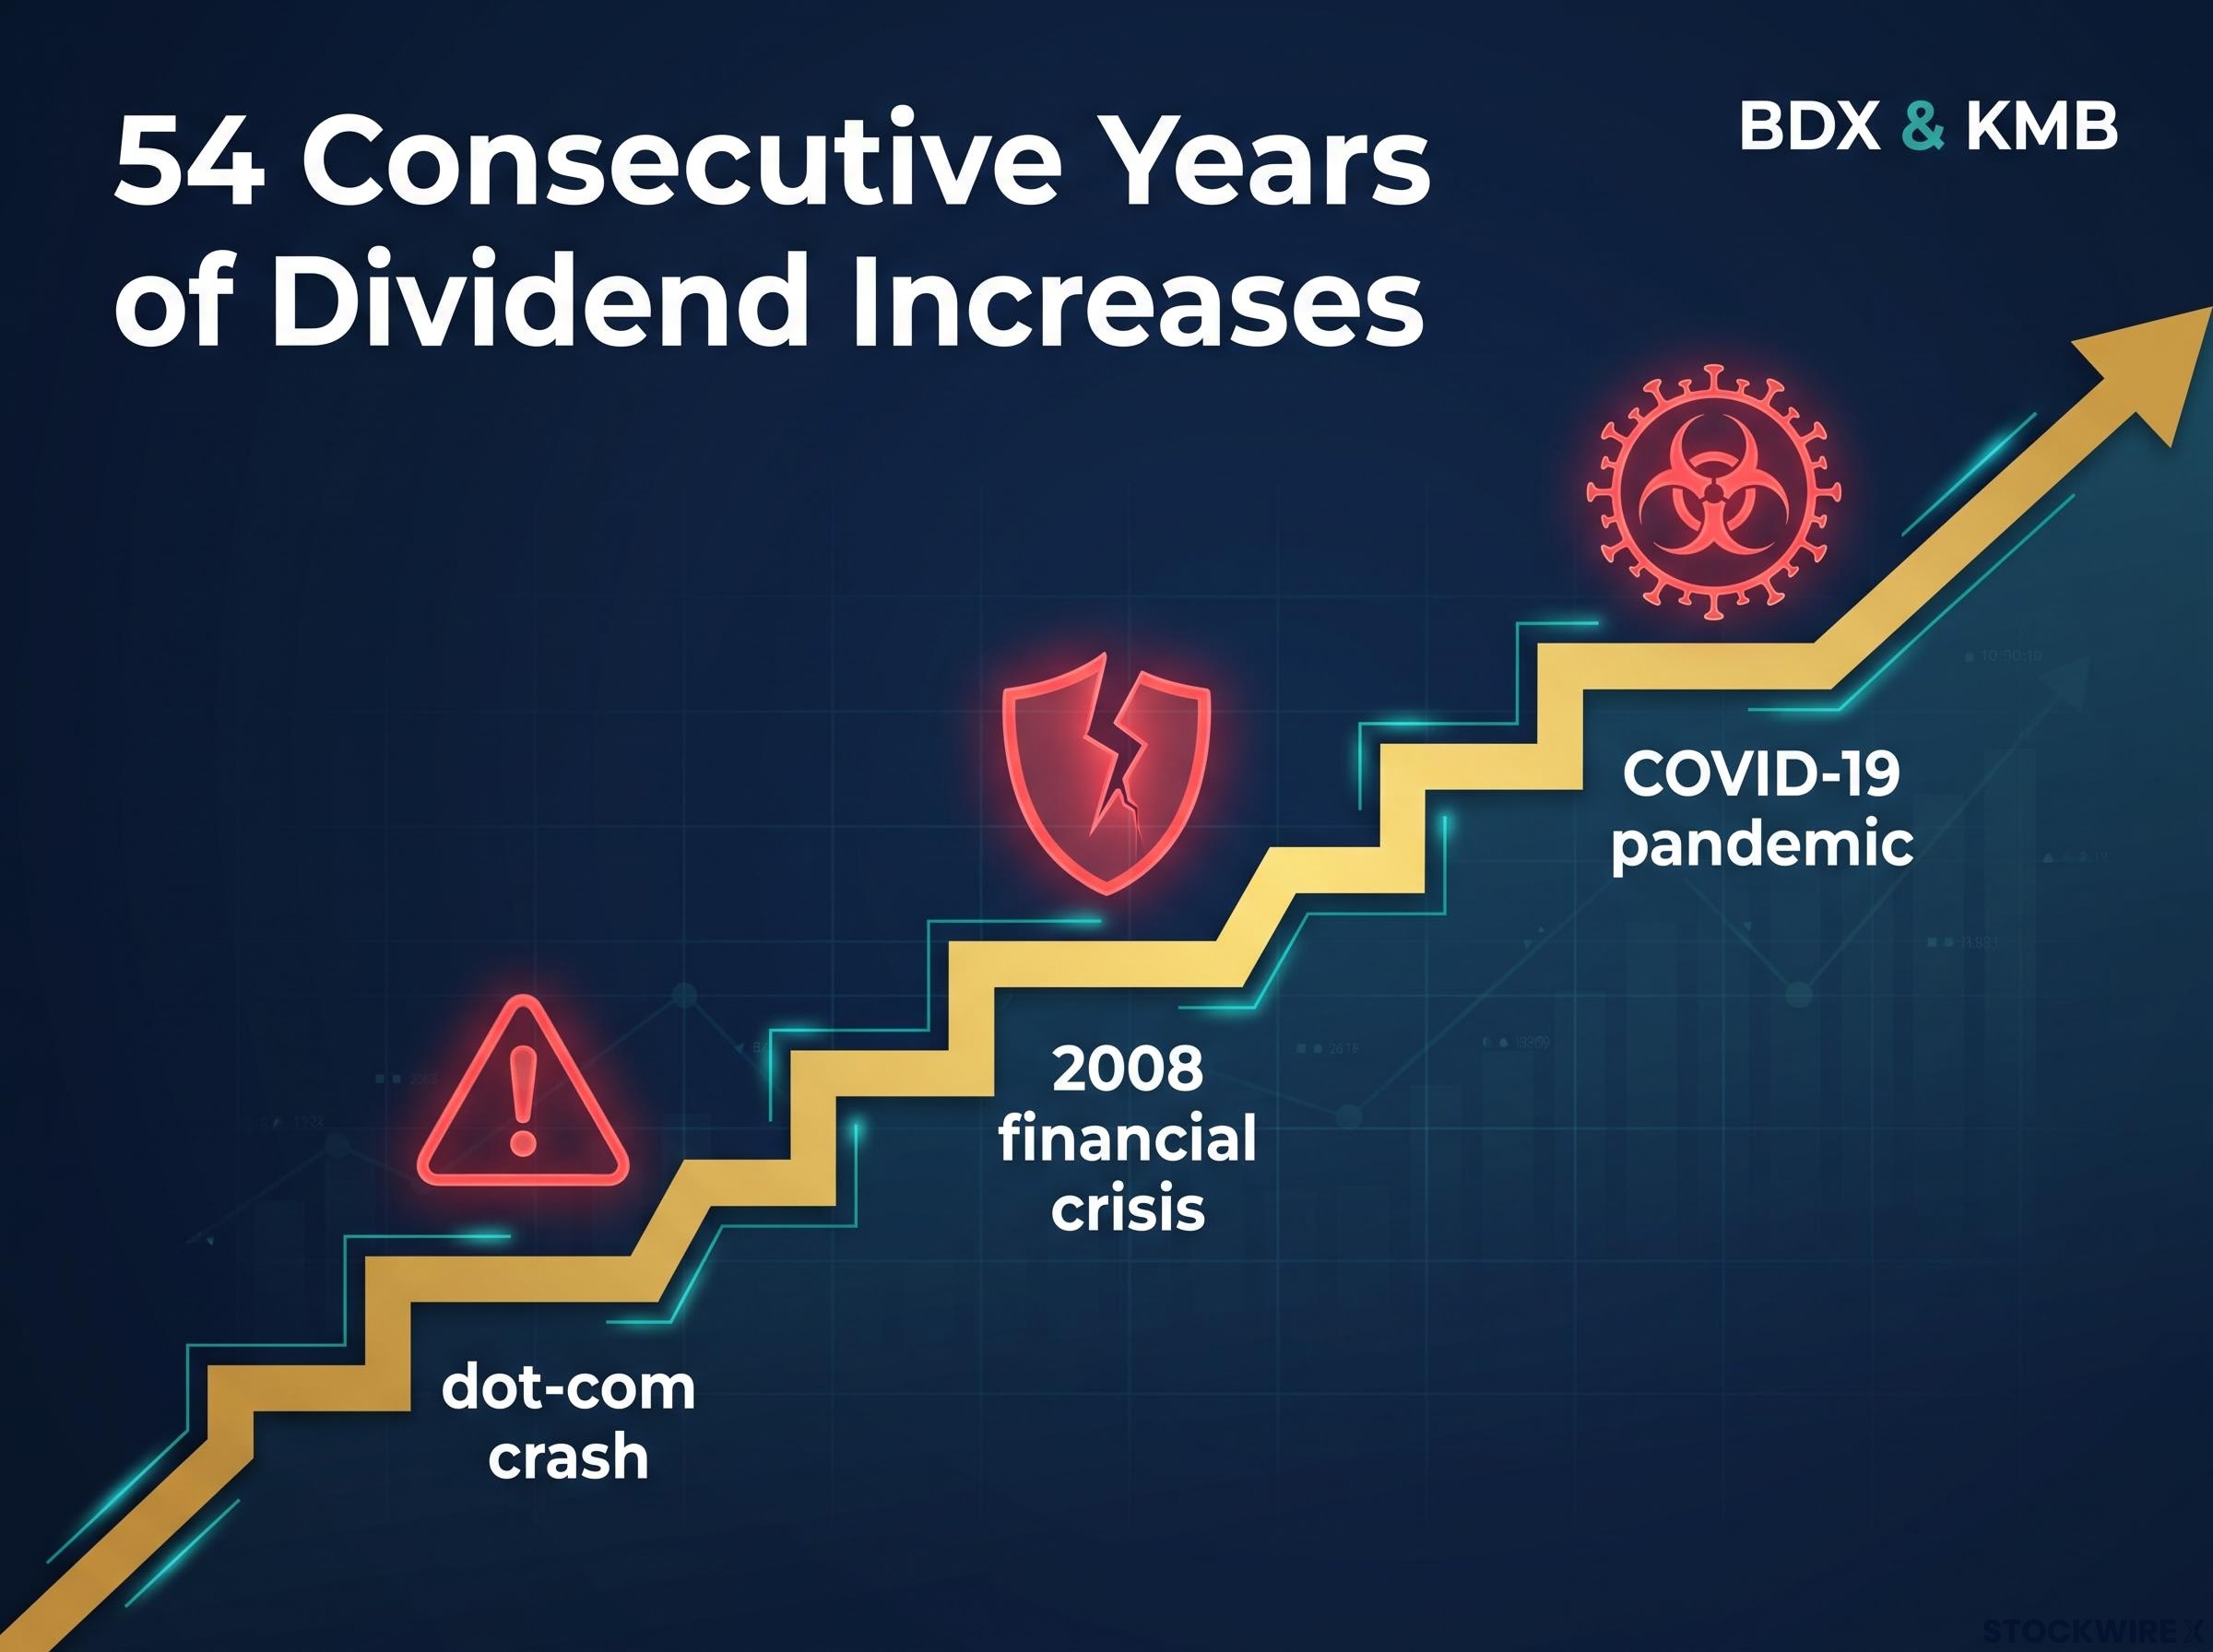
The consecutive-increase record functions as a capital-allocation signal, revealing how management behaves when conditions deteriorate. Compressed earnings, frozen credit markets, vanishing revenue visibility: in each of those environments, these boards elected to raise the dividend rather than preserve cash by cutting it. That choice reflects a fundamentally different risk profile than a high-yield stock whose payout history has never been stress-tested through a genuine downturn. For an investor weighing entry today, that track record is the most substantive evidence on offer that these businesses are not conventional yield traps.
When big ASX news breaks, our subscribers know first
Reading the valuation discount: what P/E compression at this depth means
Start with the framework. FastGraphs, a widely used equity valuation platform, produces two metrics that anchor the analysis here. A “blended P/E” combines trailing and forward earnings estimates into a single current-valuation reading. A “normal P/E” calculates the average multiple the market has assigned a stock over a defined historical period, typically 10 or 20 years. The gap between the two tells you how far current pricing has drifted from what investors have historically been willing to pay.
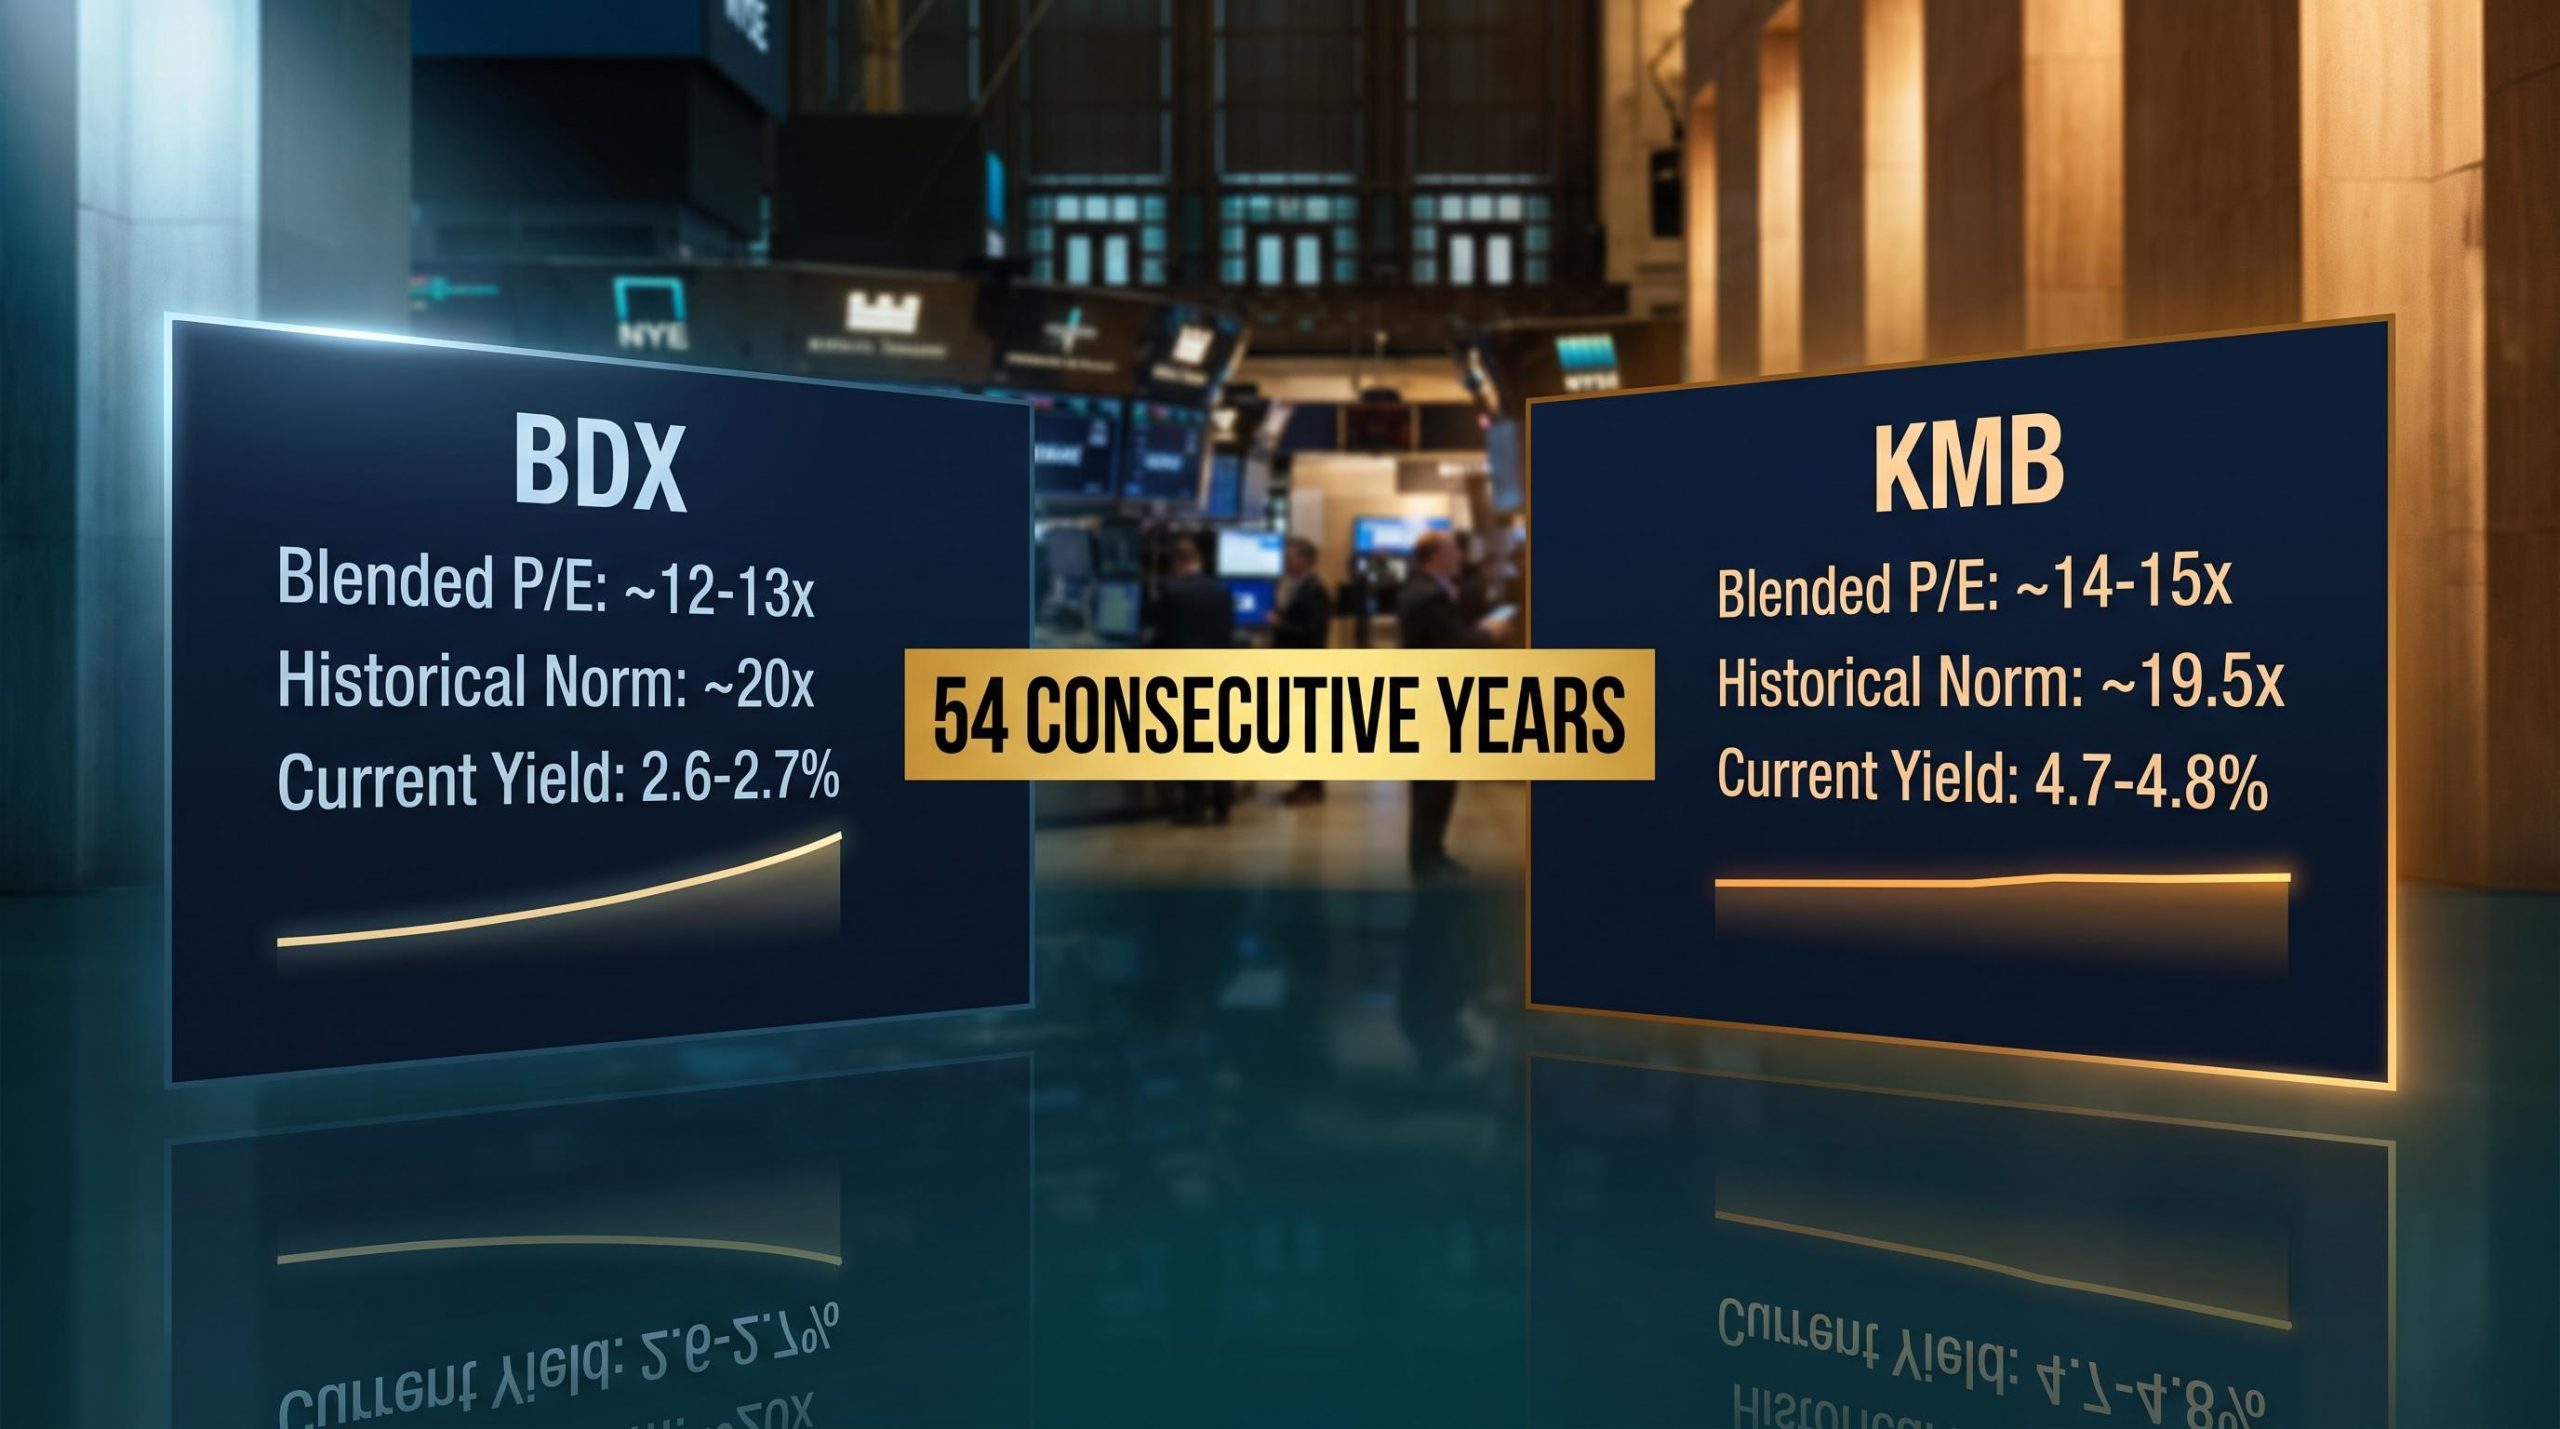
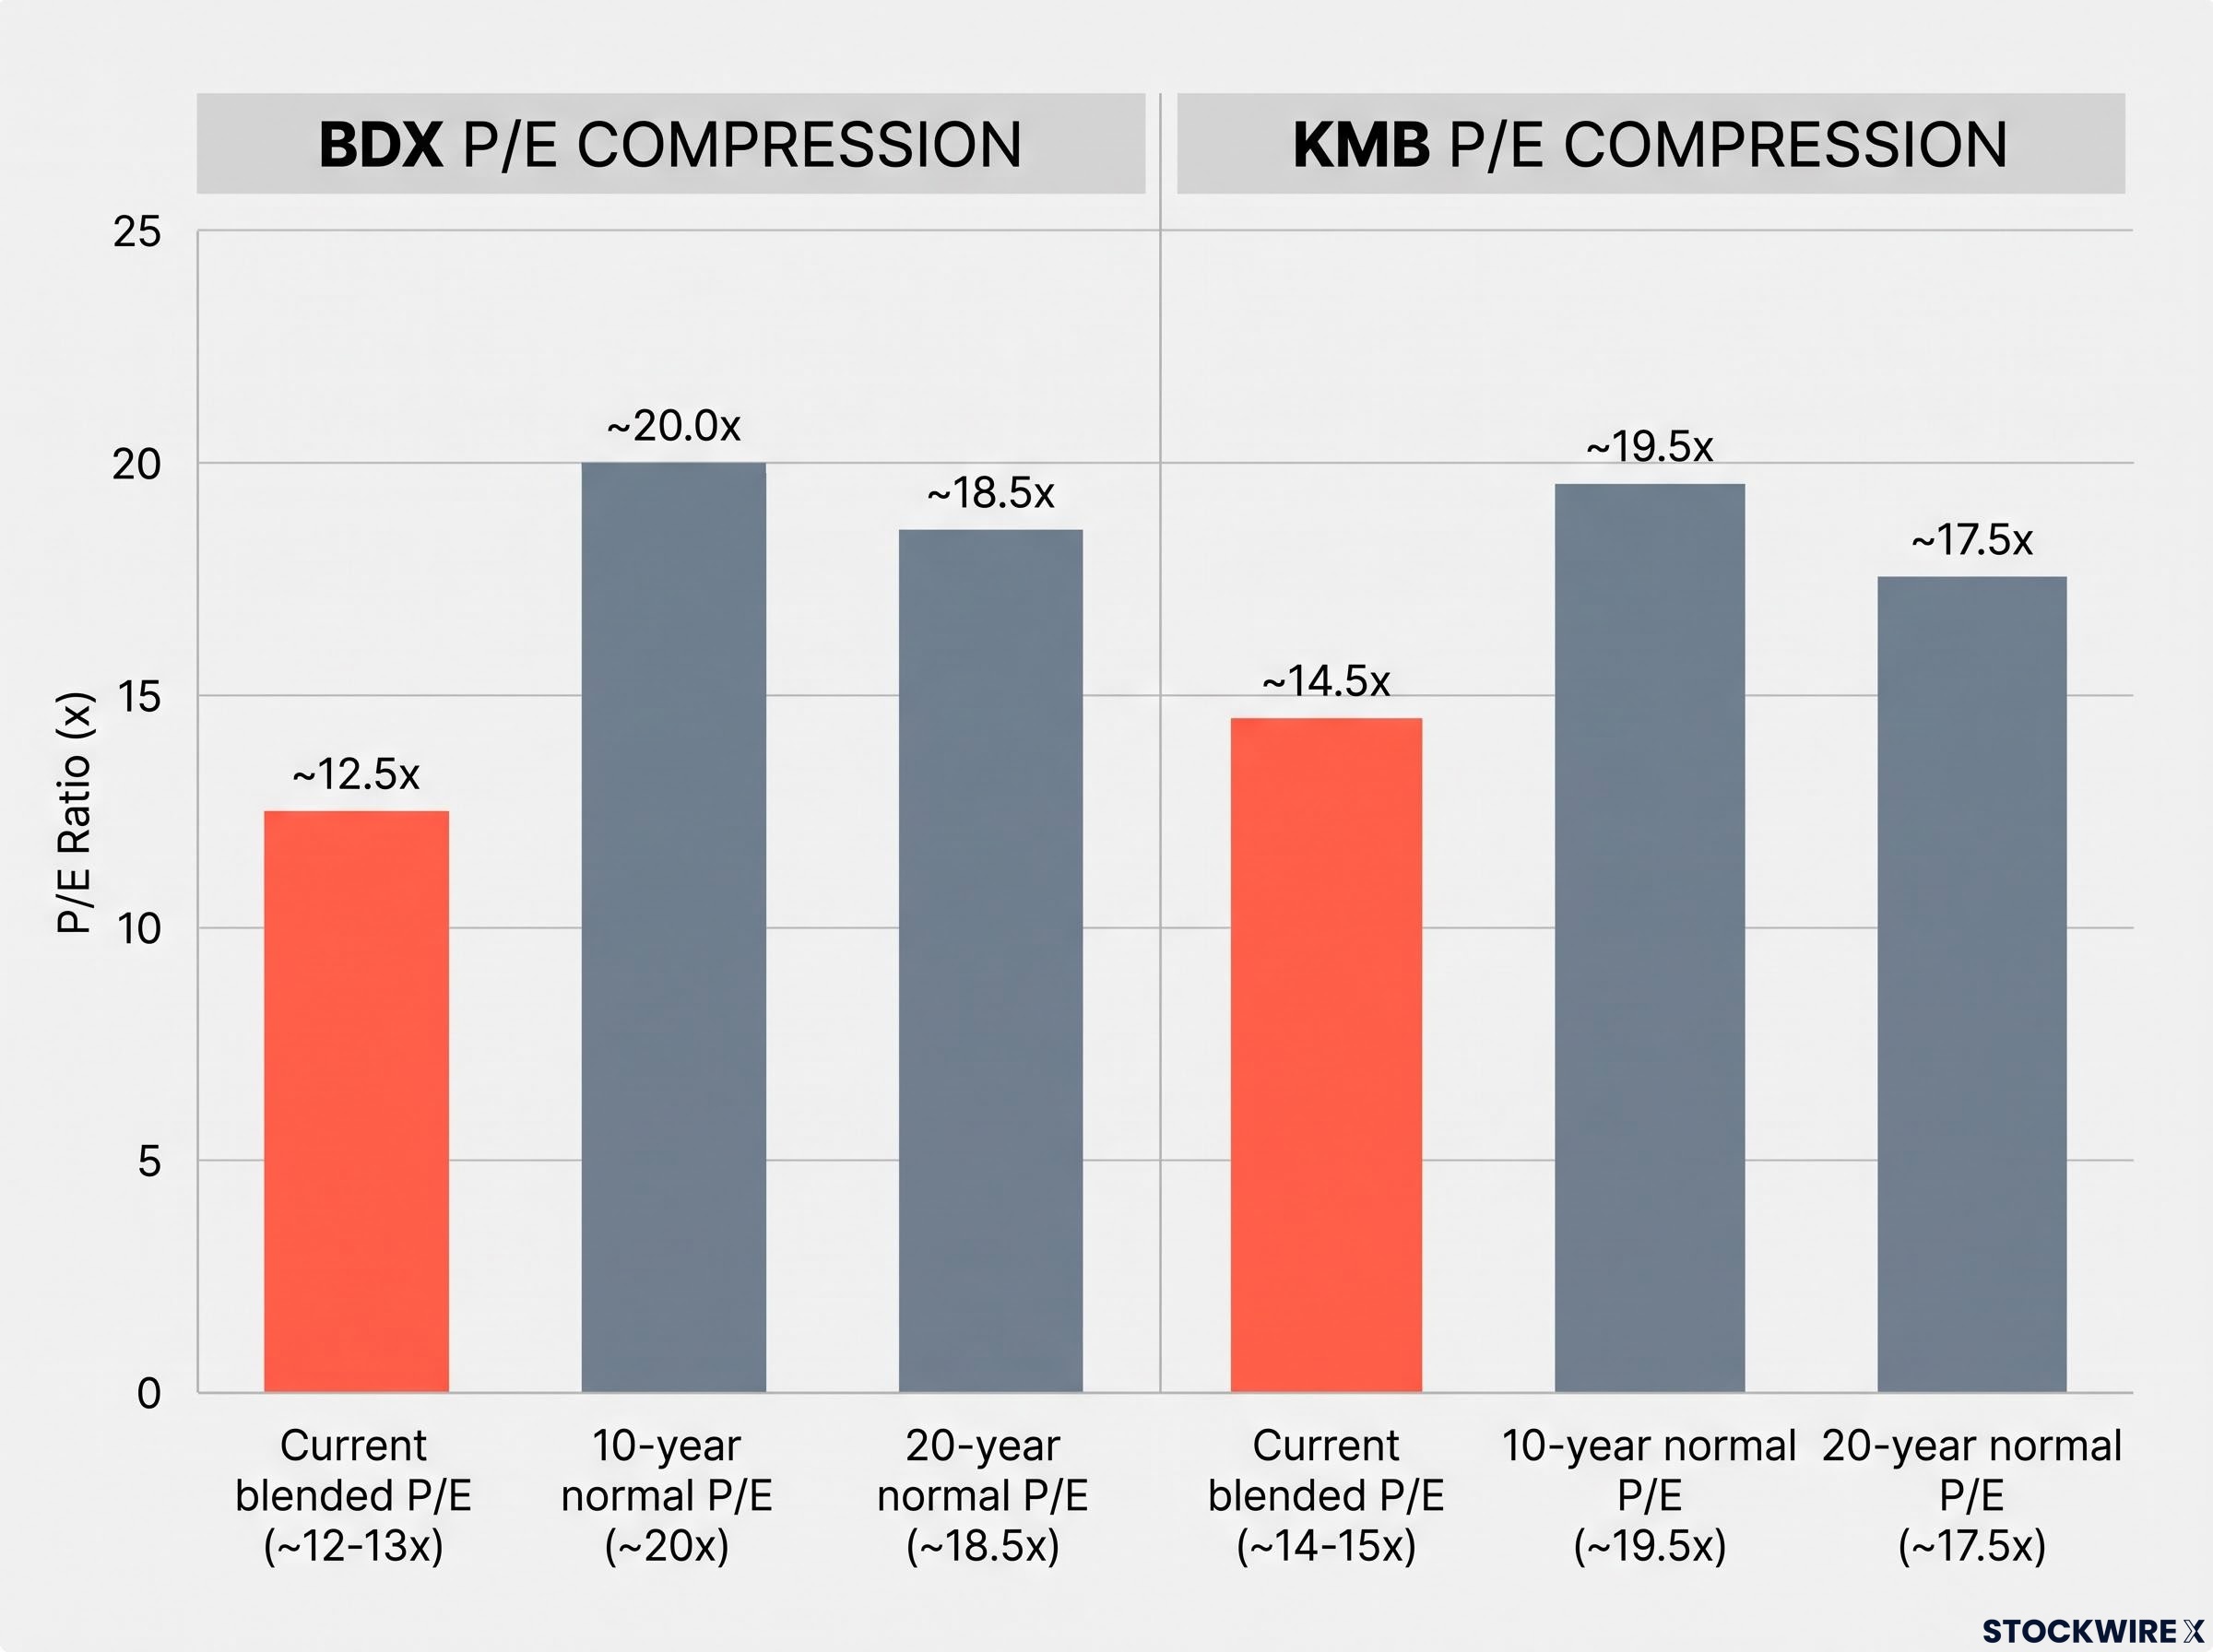
BDX trades at a blended P/E of approximately 12-13x. Its 10-year normal P/E sits at approximately 20x. Its 20-year normal P/E is approximately 18.5x. That is a compression of roughly 35-40% below the long-term average, a valuation level the stock has not seen since roughly the 2007-2012 trough period.
KMB trades at a blended P/E of approximately 14-15x. Its 10-year normal P/E is approximately 19.5x. Its 20-year normal P/E sits just above 17.5x. The stock is near the lowest valuation of the past decade.
| Metric | BDX | KMB |
|---|---|---|
| Current blended P/E | ~12-13x | ~14-15x |
| 10-year normal P/E | ~20x | ~19.5x |
| 20-year normal P/E | ~18.5x | ~17.5x |
Note: All P/E figures are derived using FastGraphs methodology. “Blended P/E” combines trailing and forward estimates; “normal P/E” reflects the historical average multiple over the stated period. These are analytical framework outputs, not consensus targets.
The gap between current multiples and historical norms is not noise. At this depth, the market has either permanently repriced these businesses, or a meaningful rerating opportunity exists for patient investors who get the diagnosis right.
Dividend yield as a valuation signal: what expansion above historical norms tells you
P/E compression is one signal. Dividend yield provides a second, independent check. The relationship is mechanical: when a stock’s price falls and the dividend stays constant or grows, the yield rises. A yield sitting materially above a company’s own historical average tells you the price has dropped further than the dividend trajectory can explain.
Both companies confirm the pattern:
- BDX current yield: approximately 2.6-2.7%, against a historical average range of roughly 1.4-2.0%. Annual dividend: $4.20 ($1.05 per quarter). 10-year dividend growth rate: approximately 6.5% per year.
- KMB current yield: approximately 4.7-4.8%, against a 4-year historical average of approximately 3.9%. Annual dividend: $5.12. 10-year dividend growth rate: approximately 3-3.5% per year.
The growth-rate gap matters over time. BDX‘s 6.5% annual dividend growth roughly doubles the payout every 11 years. KMB‘s 3-3.5% growth keeps pace with inflation but does not compound wealth at the same rate. For an investor reinvesting dividends over a 15-year horizon, that gap widens considerably.
When two independent valuation signals, P/E compression and yield expansion above historical norms, point in the same direction simultaneously, the probability that current prices reflect a genuine discount rather than random variation rises materially. Minor platform-level variation exists in reported yields across FastGraphs, MarketBeat, and StockAnalysis; cross-checking before acting on specific figures is advised.
Two different investors, two different stocks
The temptation is to rank these and pick a winner. That misses the point. These are two different stocks for two different investors, and the distinction is more useful than a single verdict.
KMB is the income stock. Its yield of approximately 4.7-4.8% delivers immediate cash flow. Its brands (Kleenex, Huggies, Cottonelle, Depends) sell regardless of economic conditions. Its payout ratio of approximately 79% means most of the earnings go directly to shareholders. The trade-off is lower dividend growth of roughly 3-3.5% annually and less flexibility for the company to reinvest in growth. If you are near or in retirement, and you need the dividend to cover living expenses rather than reinvesting it, KMB fits that profile.
BDX is the compounding stock. Its yield of approximately 2.6-2.7% is lower today, but its 6.5% annual dividend growth rate and forward payout ratio of approximately 31-33% give it substantial room to grow the payout over time. Structural tailwinds from ageing global demographics drive demand for healthcare infrastructure, and a low payout ratio means the company retains meaningful earnings for reinvestment. If you have a longer horizon and are reinvesting dividends to build wealth, BDX fits that profile.
| Metric | KMB | BDX | Investor implication |
|---|---|---|---|
| Current yield | ~4.7-4.8% | ~2.6-2.7% | KMB delivers more income today |
| Dividend growth rate | ~3-3.5%/yr | ~6.5%/yr | BDX compounds faster over time |
| Payout ratio | ~79% | ~31-33% | BDX retains more for reinvestment |
| Sector | Consumer staples | Healthcare/medtech | Different cycle sensitivity |
| Investor profile | Income, near/in retirement | Total return, longer horizon | Match to your situation |
Which stock is right depends on a personal question: do you need the dividend to live on now, or are you reinvesting it to grow wealth over a longer horizon?
The next major ASX story will hit our subscribers first
Projected return scenarios and the value trap question
Scenario returns versus conservative estimates
Applying a FastGraphs valuation-normalisation framework, a rerating of BDX from its current roughly 12-13x blended P/E back toward the 19.5-20x historical norm by the close of 2028 would imply an annualised total return exceeding 31%, equivalent to a cumulative gain of more than 83% across approximately 2.5 years. That is the optimistic case.
The conservative case looks different. SureDividend estimates approximately 12-13% annualised total returns over a 5-to-7 year horizon, driven by 5-8% earnings growth, 1.8-2.4% dividend yield, and modest P/E expansion.
The gap between the scenario-based return (over 31% annualised for BDX) and the conservative estimate (12-13%) tells you how much of the upside depends on the market deciding to reprice this business. That variable, the rerating, is something no earnings model can guarantee.
Should KMB recover to approximately 19x earnings by end of 2028, the FastGraphs normalisation model implies an annualised total return of roughly 19% for that period. Both figures are scenario outputs contingent on valuation mean reversion within the stated timeframe, and neither represents consensus analyst guidance.
Where the value trap risk actually lives
The 54-year streak materially lowers but does not eliminate the risk. Here is where the specific vulnerabilities sit:
BDX risks:
- Multiple compression in a higher-rate environment could delay or limit valuation normalisation
- Acquisition integration challenges; BDX has a history of material medtech acquisitions
- Regulatory, reimbursement, and competitive risks specific to the medtech sector
KMB risks:
- Private-label competition and consumer price sensitivity could structurally compress margins
- Dividend growth of 3-3.5% may not meaningfully exceed inflation over time
- A payout ratio of approximately 79% leaves less financial flexibility than BDX‘s 31-33%
The 54-year streak differentiates both companies from untested high-yield situations. But past performance does not guarantee future results, and both sets of risks are genuine.
Making a considered call on two deeply discounted income compounders
The analytical picture is consistent across both lenses. BDX at approximately 12-13x versus a historical normal of 18.5-20x, and KMB at approximately 14-15x versus 17.5-19.5x, represent meaningful discounts to long-term valuation norms. Yield expansion corroborates the P/E signal in both cases. The 54-year dividend streak provides a structural differentiator that most discounted stocks cannot offer.
The decision variables for your own assessment:
- Valuation discount confirmed by two independent signals (P/E compression and yield expansion)
- Investor profile fit: KMB for near-retirement income, BDX for longer-horizon dividend growth
- Rerating timeline is unknown; patient capital is the operative assumption
- Specific risk factors identified for each company and unresolved
The combination of corroborating valuation signals and a half-century dividend track record does not make the decision for you. It narrows the set of outcomes you need to plan for. The rerating may take longer than any model assumes, or it may not arrive at all.
This analysis is for informational purposes only and should not be considered financial advice. All projections are scenario-based and involve uncertainty. Investors should verify current data across multiple platforms and consult with financial professionals before making investment decisions.