
As of 12 June 2026, 27 of the 112 S&P 500 trading sessions this year have produced daily moves exceeding 1% in either direction. That statistic has fuelled a steady drumbeat of commentary about a uniquely dangerous market, one where investors are supposedly navigating conditions that demand caution, hedging, and defensive repositioning. Nearly a century of daily-return data, stretching back to January 1928, tells a different story. The year has been choppy, not chaotic. The S&P 500 opened 2026 with a drawdown of roughly 4% through early April, absorbed a geopolitical shock tied to conflict near the Strait of Hormuz, weathered a VIX that breached 30 in March, and still recovered to post a positive year-to-date total return of approximately 9-11% by mid-June. What follows is an evidence-based assessment of whether 2026 market volatility is genuinely elevated by historical standards, why it feels worse than it is, and why the count of large daily swings is the wrong metric for measuring risk.
What the 2026 trading data actually shows
The raw numbers are worth sitting with before layering on interpretation. Through 12 June 2026, FactSet data records 27 sessions out of 112 with daily moves exceeding 1% in either direction, a rate of 24.1%.
27 of 112 trading sessions (24.1%) have recorded daily moves exceeding 1% in 2026 so far, per FactSet data through 12 June.
Extrapolating that pace across the full 251 scheduled trading days in 2026 yields a projected full-year tally of approximately 60 such sessions. That figure is a rough estimation, not a forecast, but it would place 2026 modestly above 2025 levels and modestly below 2023.
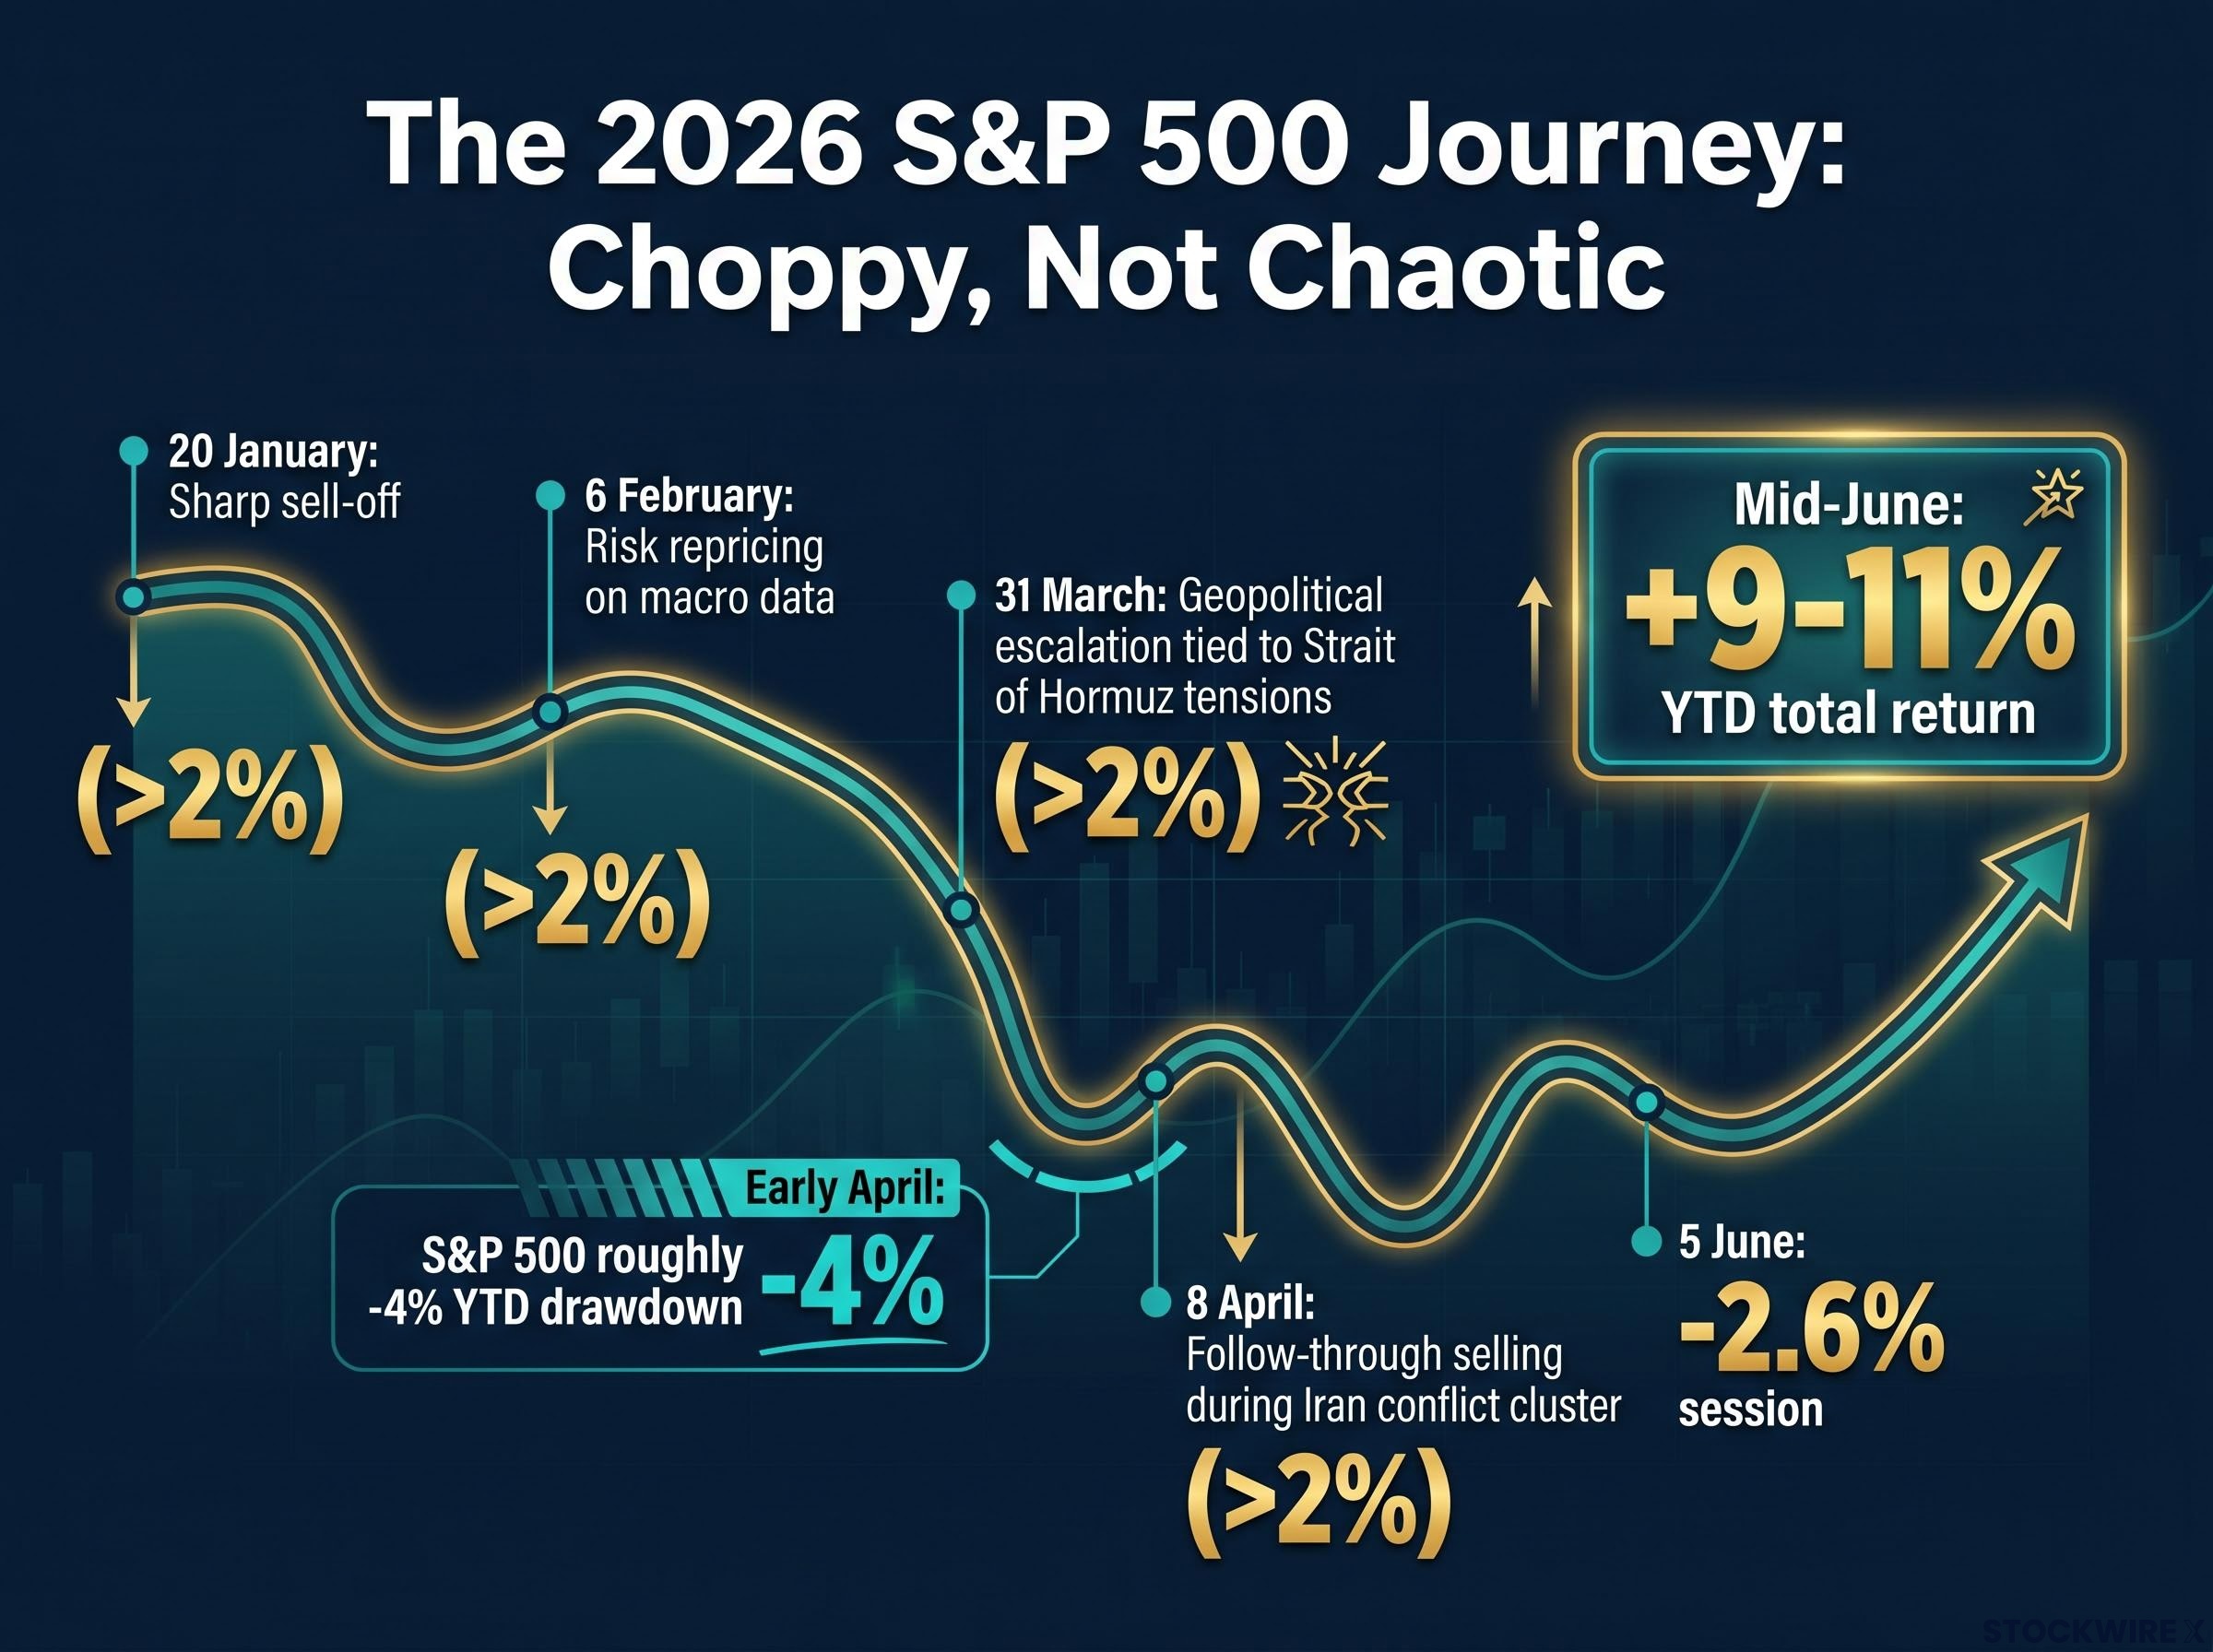
Five specific sessions produced moves exceeding 2% in either direction:
- 20 January: sharp sell-off amid early-year positioning
- 6 February: risk repricing on macro data
- 31 March: geopolitical escalation tied to Strait of Hormuz tensions
- 8 April: follow-through selling during the Iran conflict cluster
- 5 June: a -2.6% session that opened the most recent volatile week
The index’s net direction, however, has been positive. From a roughly -4% year-to-date drawdown through early April, the S&P 500 recovered to post a total return of approximately +9-11% by mid-June. The path was bumpy. The destination, so far, has been upward.
When big ASX news breaks, our subscribers know first
A century of S&P 500 swings puts 2026 in its place
The full FactSet dataset spans 4 January 1928 through 12 June 2026, covering nearly 25,000 trading sessions across depressions, world wars, stagflation, financial crises, and a pandemic. That spectrum puts the 2026 figures in a perspective that headline counts alone cannot provide.
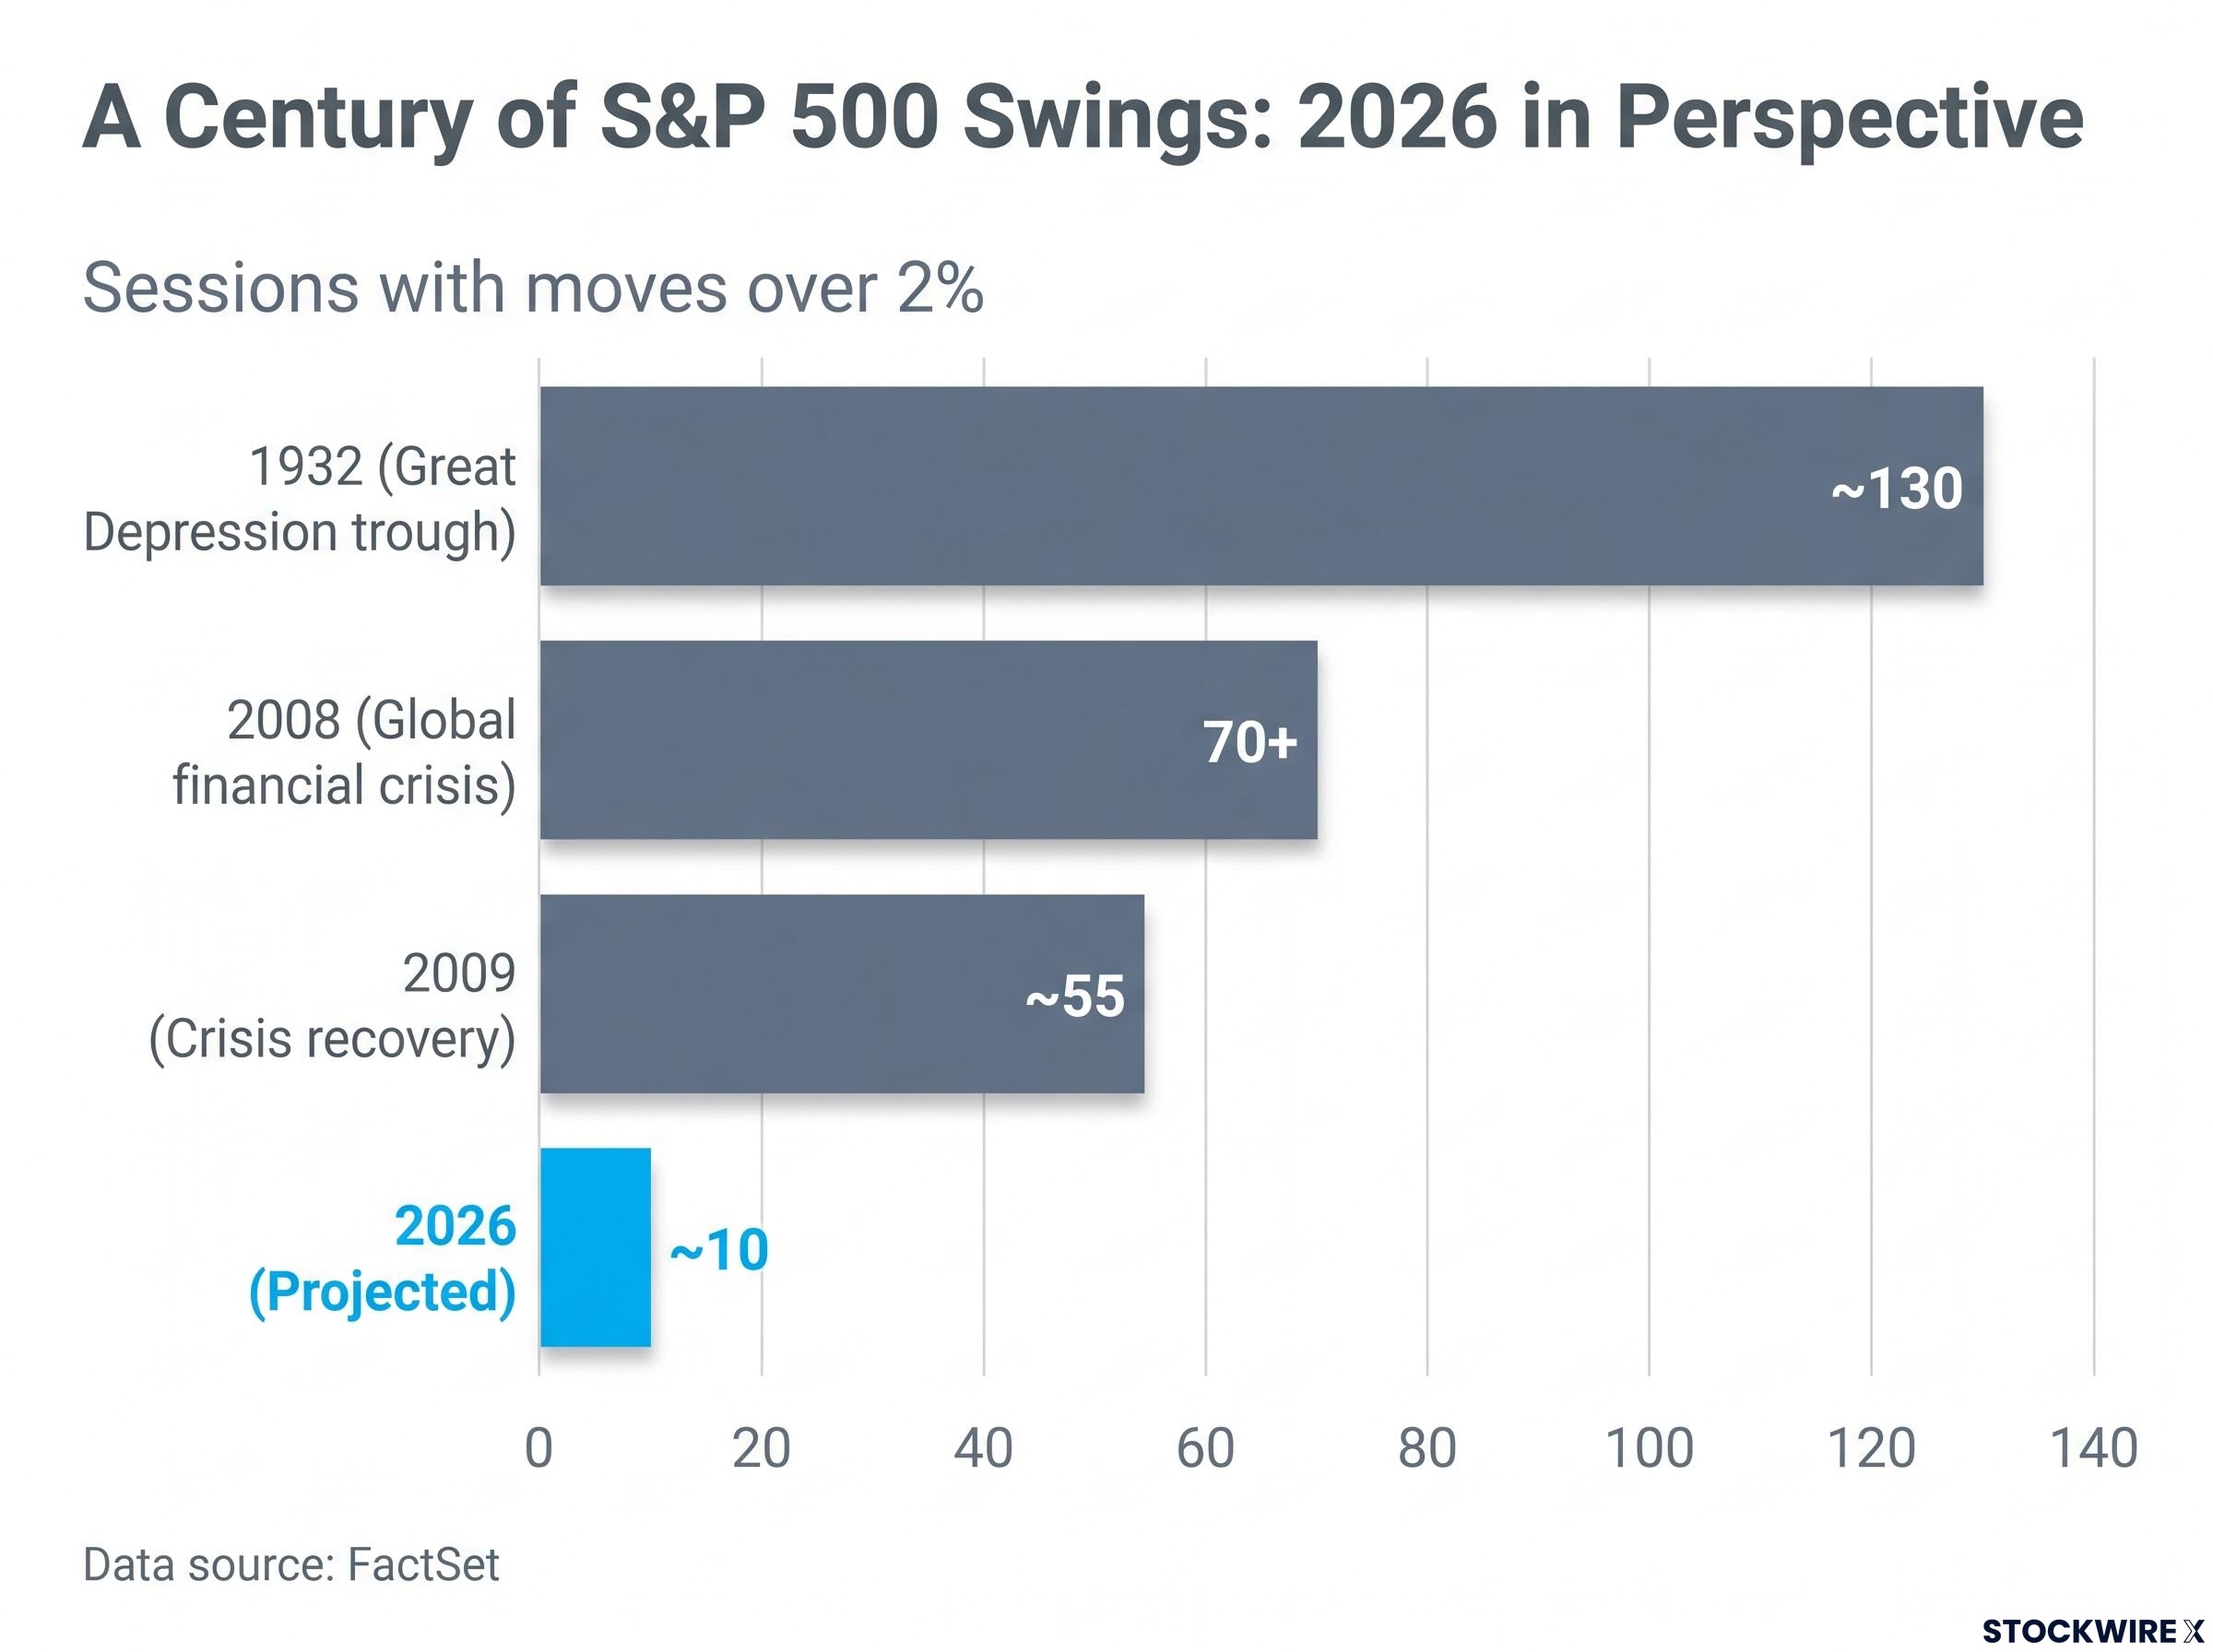
Start at the extreme end. In 1932, at the depths of the Great Depression, the S&P 500 recorded approximately 130 sessions with moves exceeding 2%. In 2008, the global financial crisis produced more than 70. The early recovery year of 2009 saw approximately 55. These were environments where multi-percent daily swings were the norm, not the exception, and where they arrived day after day for months.
| Year | Market context | Sessions with moves over 2% |
|---|---|---|
| 1932 | Great Depression trough | ~130 |
| 2008 | Global financial crisis | 70+ |
| 2009 | Crisis recovery | ~55 |
| 2020 | Pandemic sell-off and recovery | Frequent large moves in both directions |
| 2025 | Post-recovery bull market | Below 2026 projected pace |
| 2026 (projected) | Geopolitical shock, mid-cycle recovery | ~10 |
At the calm end sits 1964, which recorded just 3 sessions with moves greater than 1% for the entire year. Much of the 1990s bull market also featured remarkably few large daily swings.
2026’s projected tally of roughly 10 sessions with moves exceeding 2% falls squarely in the middle of that nearly 100-year distribution. Not calm. Not crisis. Ordinary.
 investors register a -2.6% session with roughly twice the psychological intensity of an equivalent gain, an asymmetry that aggregates across millions of participants into herd-selling episodes that widen the gap between perceived and actual market conditions.
The gap between how nervous markets feel and how they actually move
Two forms of volatility coexist in any market environment, and they are not saying the same thing in 2026.
Implied volatility reflects what options markets are pricing in as expected future price swings. It is forward-looking, sentiment-driven, and sensitive to fear. Realised volatility measures what day-to-day price movements have actually been. It is backward-looking and evidence-based.
According to Penn Mutual Asset Management, the S&P 500’s 30-day implied volatility climbed above 23%, nearly double the level at the start of the year. Over the same period, 30-day realised volatility stayed below 14%. The gap between those two figures is the single most revealing statistic about how 2026 actually feels versus how it has actually traded.
| Period | Implied volatility (approx.) | Realised volatility (approx.) |
|---|---|---|
| March 2026 (peak stress) | Above 23% | Below 14% |
| June 2026 (mid-year) | ~16-17% (VIX near 16.2) | Contained; daily moves moderate |
| 2017 (calm comparison) | Frequently below 12 | Historically low |
S&P Global’s risk dashboard reinforces the disconnect: the VIX registered 21 during a period in which the S&P 500 rose 10.9%, demonstrating that markets can advance through elevated implied volatility. As of 16 June 2026, the VIX had fallen to approximately 16.2, well below its March peak.
Markets price forward earnings rather than current headlines, a principle that was tested in real time when the S&P 500 closed above 7,200 and set a new all-time high in May 2026 while Brent crude sat near $109 per barrel and the Strait of Hormuz remained partially blocked.
The implication is direct. Investors following financial news in 2026 are absorbing sentiment shaped by the implied volatility signal, not the realised one. The year feels more dangerous than the actual daily moves justify.
Why counting daily swings is the wrong way to measure market risk
The years that produced the most large daily moves, 1932, 2008, 2009, were not the worst years to have owned equities over a full market cycle. They were, in fact, the years that set up some of the strongest subsequent recoveries in S&P 500 history. That is the bear-market volatility paradox, and it illustrates why treating the count of 1% or 2% daily swings as a measure of investor risk is misleading.
What determines long-term equity outcomes is not how many individual sessions produce large moves but how upward and downward swings net out into a multi-year trend. The same volatile year can look entirely different depending on the lens:
Value-oriented frameworks separate the concept of permanent capital loss from temporary mark-to-market volatility, treating a falling share price that reflects sentiment rather than business deterioration as a widening margin of safety rather than a confirmation of elevated risk.
- By daily swing count: 2026 has recorded 27 sessions with moves exceeding 1%, a figure that sounds alarming in isolation
- By net annual return: the S&P 500 is up approximately 9-11% year-to-date, a positive trajectory that the swing count obscures
- By earnings trajectory: year-over-year earnings growth is projected at approximately 18% for 2026, indicating the fundamental driver of long-term equity returns remains intact
Volatility describes the path, not the destination. The direction and durability of the earnings-driven trend matters far more than the count of bumpy sessions along the way.
Penn Mutual’s observation that “daily price movements are relatively contained” aligns with this framing. Even at the point of maximum stress, the index remained only modestly below pre-shock levels. The path was turbulent. The structural trend held.
Sources focused on retirement planning reinforce a consistent practical conclusion: volatility should be used to stress-test risk management frameworks, not as a market-timing signal.
What the rest of 2026 may hold, and what to do about it
Three categories of risk remain most frequently cited for the remainder of 2026:
- Geopolitical developments: unresolved tensions in the Middle East and potential for further supply-chain disruption
- Trade and macro policy uncertainty: ongoing policy adjustments with cross-sector implications
- Midterm election legislative dynamics: midterm election years have historically tended to exhibit above-average market volatility due to policy and legislative uncertainty, a well-documented pattern in long-term studies
Capital Group’s midterm election market analysis, drawing on more than 90 years of S&P 500 data, documents that midterm election years have historically produced below-average returns and above-average volatility, providing quantitative grounding for the legislative uncertainty dynamic that analysts flag as a recurring second-half risk in 2026.
Professional commentary captures both sides of the outlook. Several major firms project further S&P 500 gains and characterise the current environment as an ongoing bull market with manageable risks. At the same time, cautionary notes flag geopolitical, trade policy, and macro catalysts as likely sources of further episodic spikes through year-end.
One counterargument bears noting: if widespread anticipation of elevated volatility is already priced into equities, the actual outcome may differ from the consensus expectation.
Past market performance is not predictive of future results. The fact that realised volatility has been ordinary so far in 2026 does not guarantee the rest of the year follows the same pattern. Volatility cannot be reliably forecast in direction, magnitude, or timing.
The investor posture this data supports
The practical stance this evidence supports is specific. Use elevated implied volatility as a prompt to review risk management and allocation stress-tests, not as a trading signal. The directional earnings trend (approximately 18% year-over-year growth) and positive year-to-date return remain the evidence-based anchors for long-term positioning decisions.
This article is for informational purposes only and should not be considered financial advice. Investors should conduct their own research and consult with financial professionals before making investment decisions. Past performance does not guarantee future results. Financial projections are subject to market conditions and various risk factors.
A historically ordinary year that does not feel like one
By the objective measure of daily-move frequency, 2026 sits in the middle of the nearly 100-year historical distribution, not at either extreme. Clustering behaviour and the persistent gap between implied and realised volatility are the two mechanisms most responsible for the distance between how turbulent this year feels and what the data shows.
The question worth asking is not how many 1% days remain in 2026. It is whether the earnings-driven directional trend that has produced a positive year-to-date return can hold through midterm-year headwinds. Readers looking to put the current environment in deeper context may find value in exploring the historical relationship between midterm election years and full-cycle S&P 500 returns.
For readers wanting to examine that historical relationship in depth, our full explainer on midterm election market cycles covers all 19 post-midterm 12-month periods since 1950, analyses how the 2026 sentiment reset from the Iran conflict maps onto prior cycle setups, and addresses the key question of whether the pattern holds when markets are already elevated heading into the election.