Vance Pulls Out of Iran Talks, Sending Brent Below $80
4 mins ago
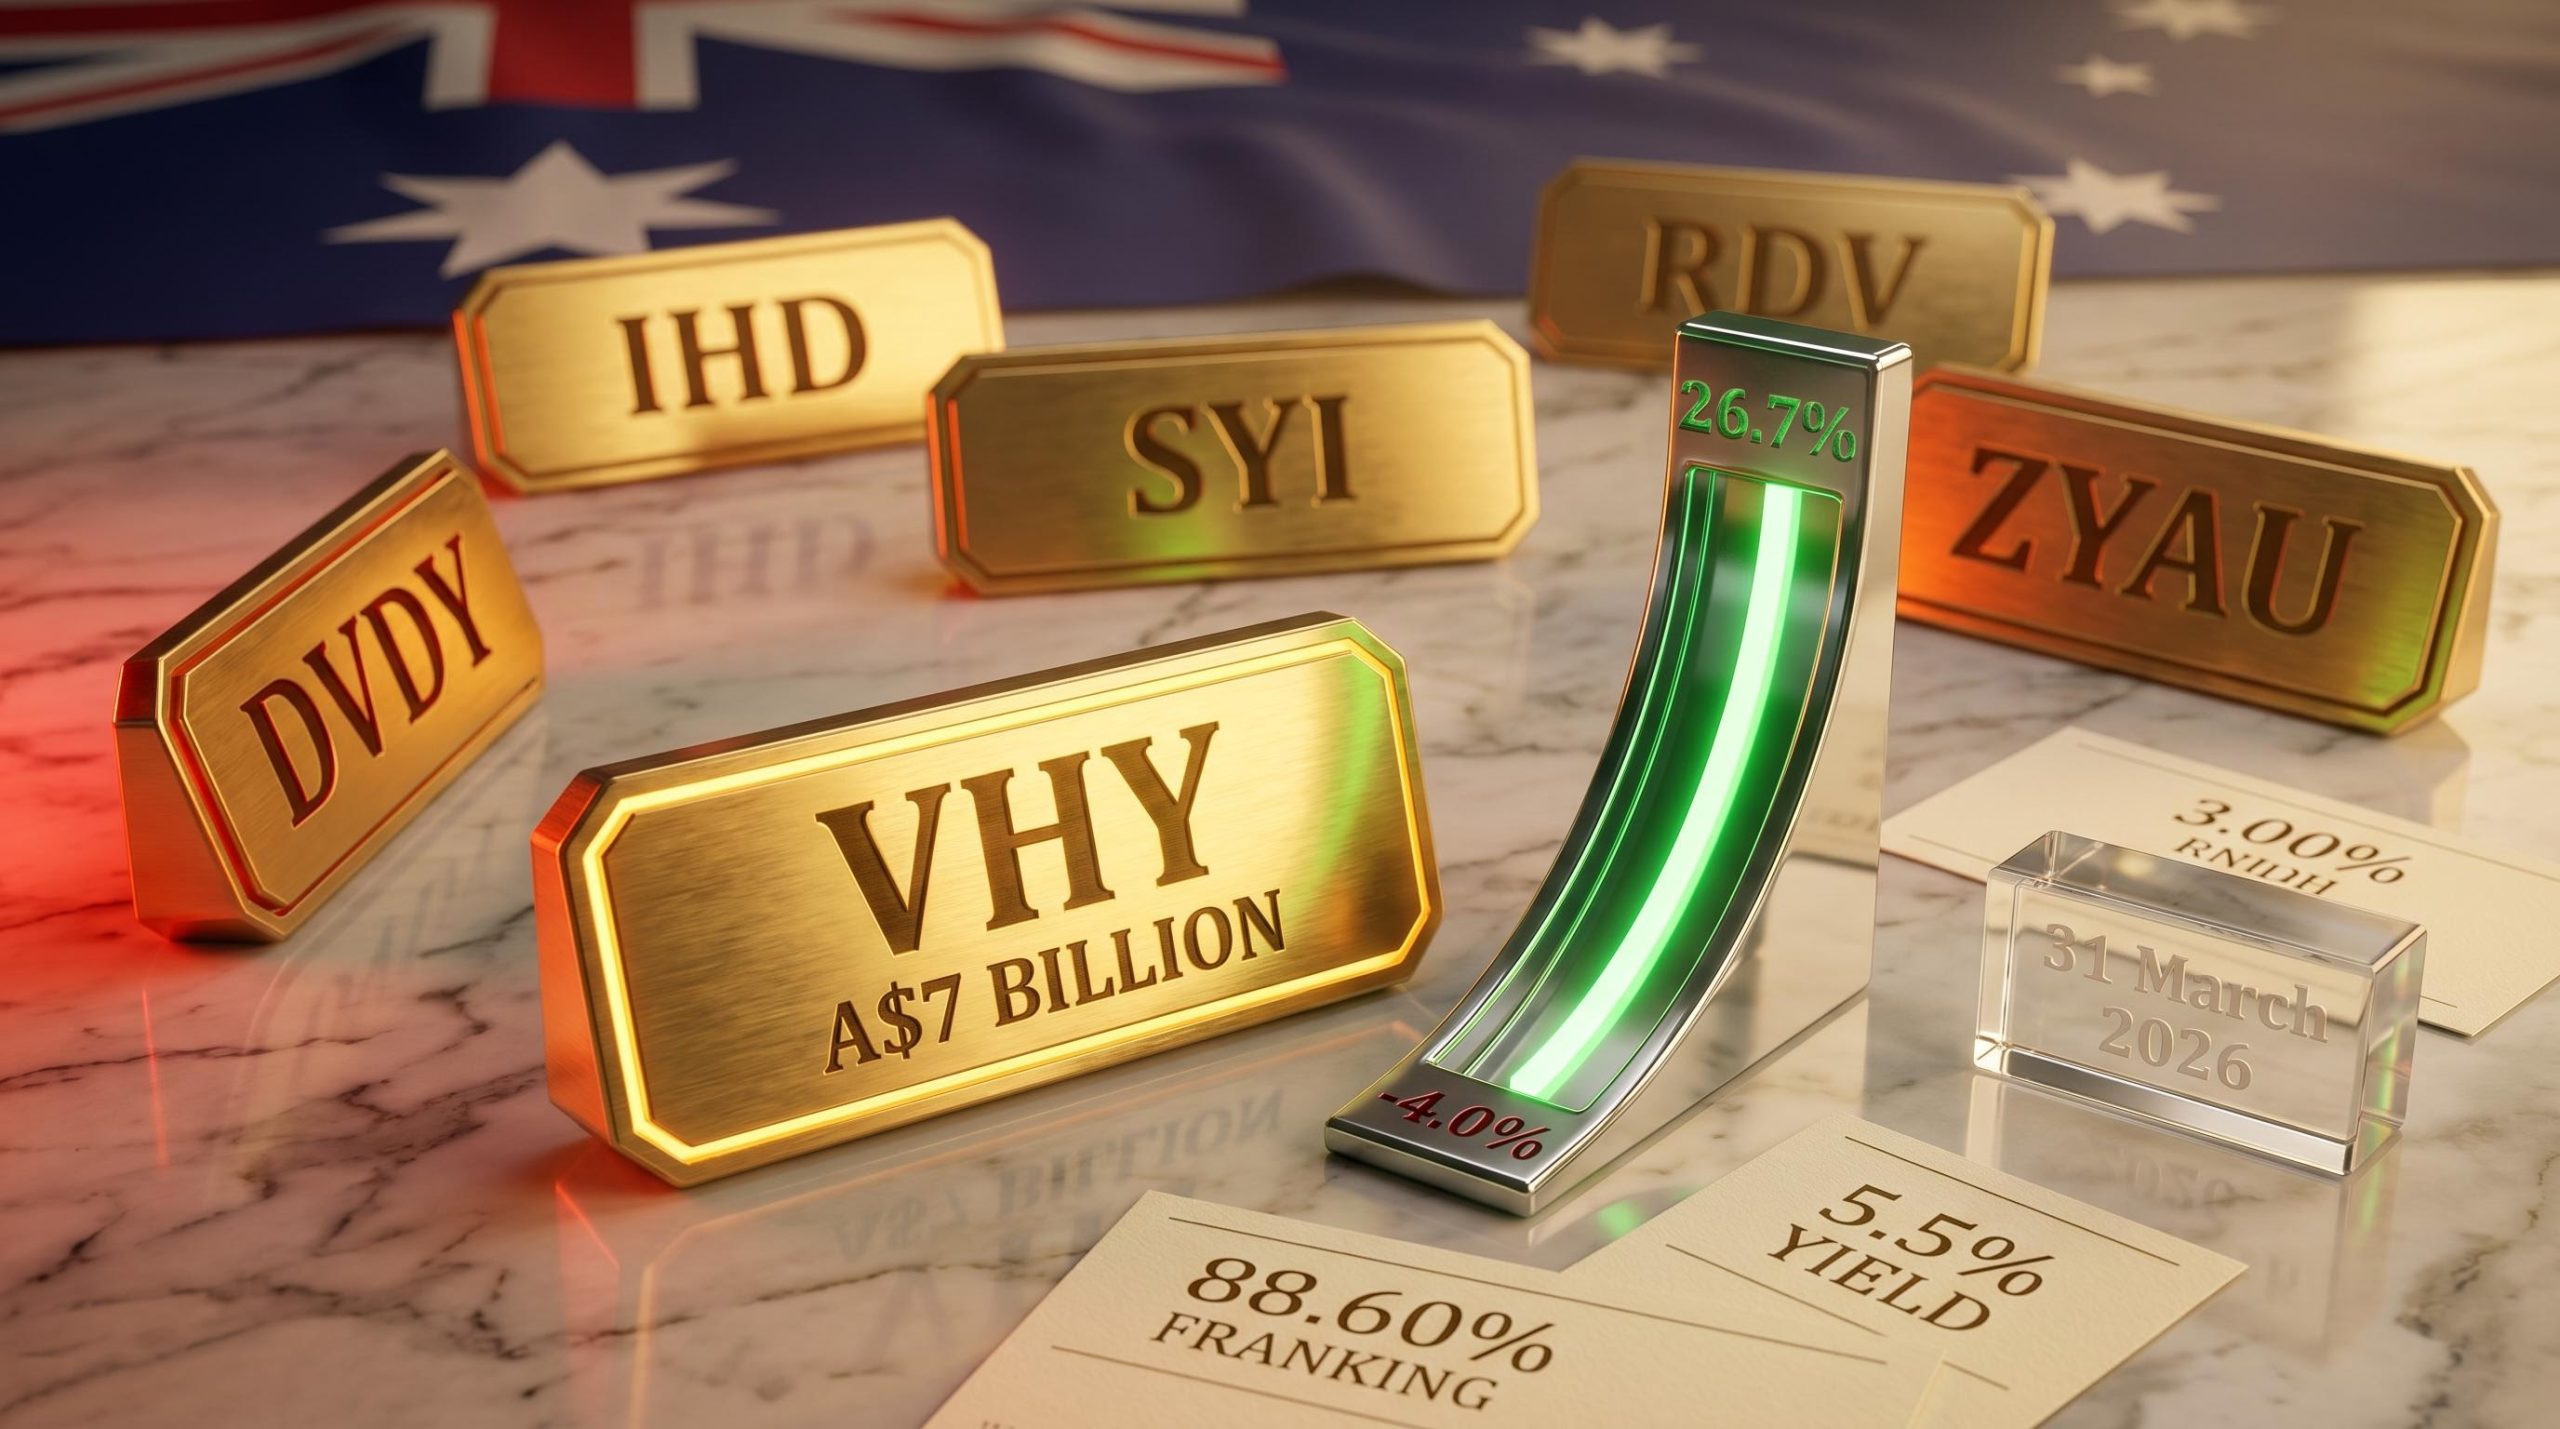
One Australian dividend ETF returned 26.7% in the year to 31 March 2026. Another lost 4.0%. Both call themselves high-dividend ETFs, both list on the ASX, and both target income investors. The difference is entirely in how each fund defines “high dividend.” With approximately A$7 billion now sitting in the largest Australian dividend ETF alone, and a new wave of income-seeking investors entering the market in 2026, the stakes of choosing the wrong fund are material. Six funds dominate the ASX dividend ETF space: IHD, RDV, SYI, VHY, ZYAU, and DVDY. Each tracks a different index. Each produces a meaningfully different portfolio. What follows is an evaluation of all six across the metrics that determine long-run outcomes: management fees, trading costs, liquidity, total returns across multiple time horizons, distribution yields, and the franking credit benefit specific to Australian resident investors. By the end, the right fund for each investor profile should be clear, and so should the reason total return is the only honest yardstick.
All six funds share the objective of delivering above-market income from Australian equities. The performance spread between them, however, exceeds 30 percentage points over one year. That divergence begins not with market conditions but with the index rules each fund follows.
VHY tracks the FTSE Australia High Dividend Yield Index, holding 75 stocks selected primarily on forward dividend yield. Its top five holdings as at 31 March 2026 were BHP (11.29%), CBA (9.94%), Westpac (7.17%), NAB (6.74%), and Woodside (6.50%), a portfolio tilted heavily toward banks and resources. SYI tracks the MSCI Australia Select High Dividend Yield Index with 57 holdings, applying quality-and-sustainability screens that filter out companies whose dividends look high but fragile. RDV follows the Russell Australia High Dividend Index across 60 holdings, prioritising dividend sustainability through a responsible investment lens.
IHD, which added ESG sustainability screening in December 2022, holds 52 stocks. ZYAU restricts eligibility to companies with sufficient cash generation and excludes negative momentum stocks across 50 positions. DVDY, the most concentrated of the group, uses the Morningstar Australia Dividend Yield Focus Index with just 25 holdings.
| ETF | Index Tracked | Holdings | Inception | Key Screen |
|---|---|---|---|---|
| VHY | FTSE Australia High Dividend Yield | 75 | May 2011 | Forward dividend yield |
| RDV | Russell Australia High Dividend | 60 | May 2010 | Dividend sustainability |
| SYI | MSCI Australia Select High Div Yield | 57 | Sep 2010 | Quality and sustainability |
| IHD | S&P/ASX Dividend Opportunities ESG Screened | 52 | Dec 2010 | ESG screening (added Dec 2022) |
| ZYAU | S&P/ASX 200 Covered Call Strategy | 50 | Jun 2015 | Cash generation, momentum exclusion |
| DVDY | Morningstar Australia Dividend Yield Focus | 25 | Sep 2020 | Concentrated yield focus |
ZYAU holds ASX 200 equities while simultaneously writing call options on those positions. This strategy collects premium income from the option buyers but surrenders a portion of upside participation when markets rally. In a strong year, the fund captures the premium and some capital appreciation but not all of it; in a flat or declining market, the option premium acts as a partial buffer.
This makes ZYAU structurally different from the other five pure-dividend funds. It also explains why its distribution yield (3.8%) appears modest relative to its 26.7% one-year total return: the option premium is embedded in the total return rather than distributed as income alone.
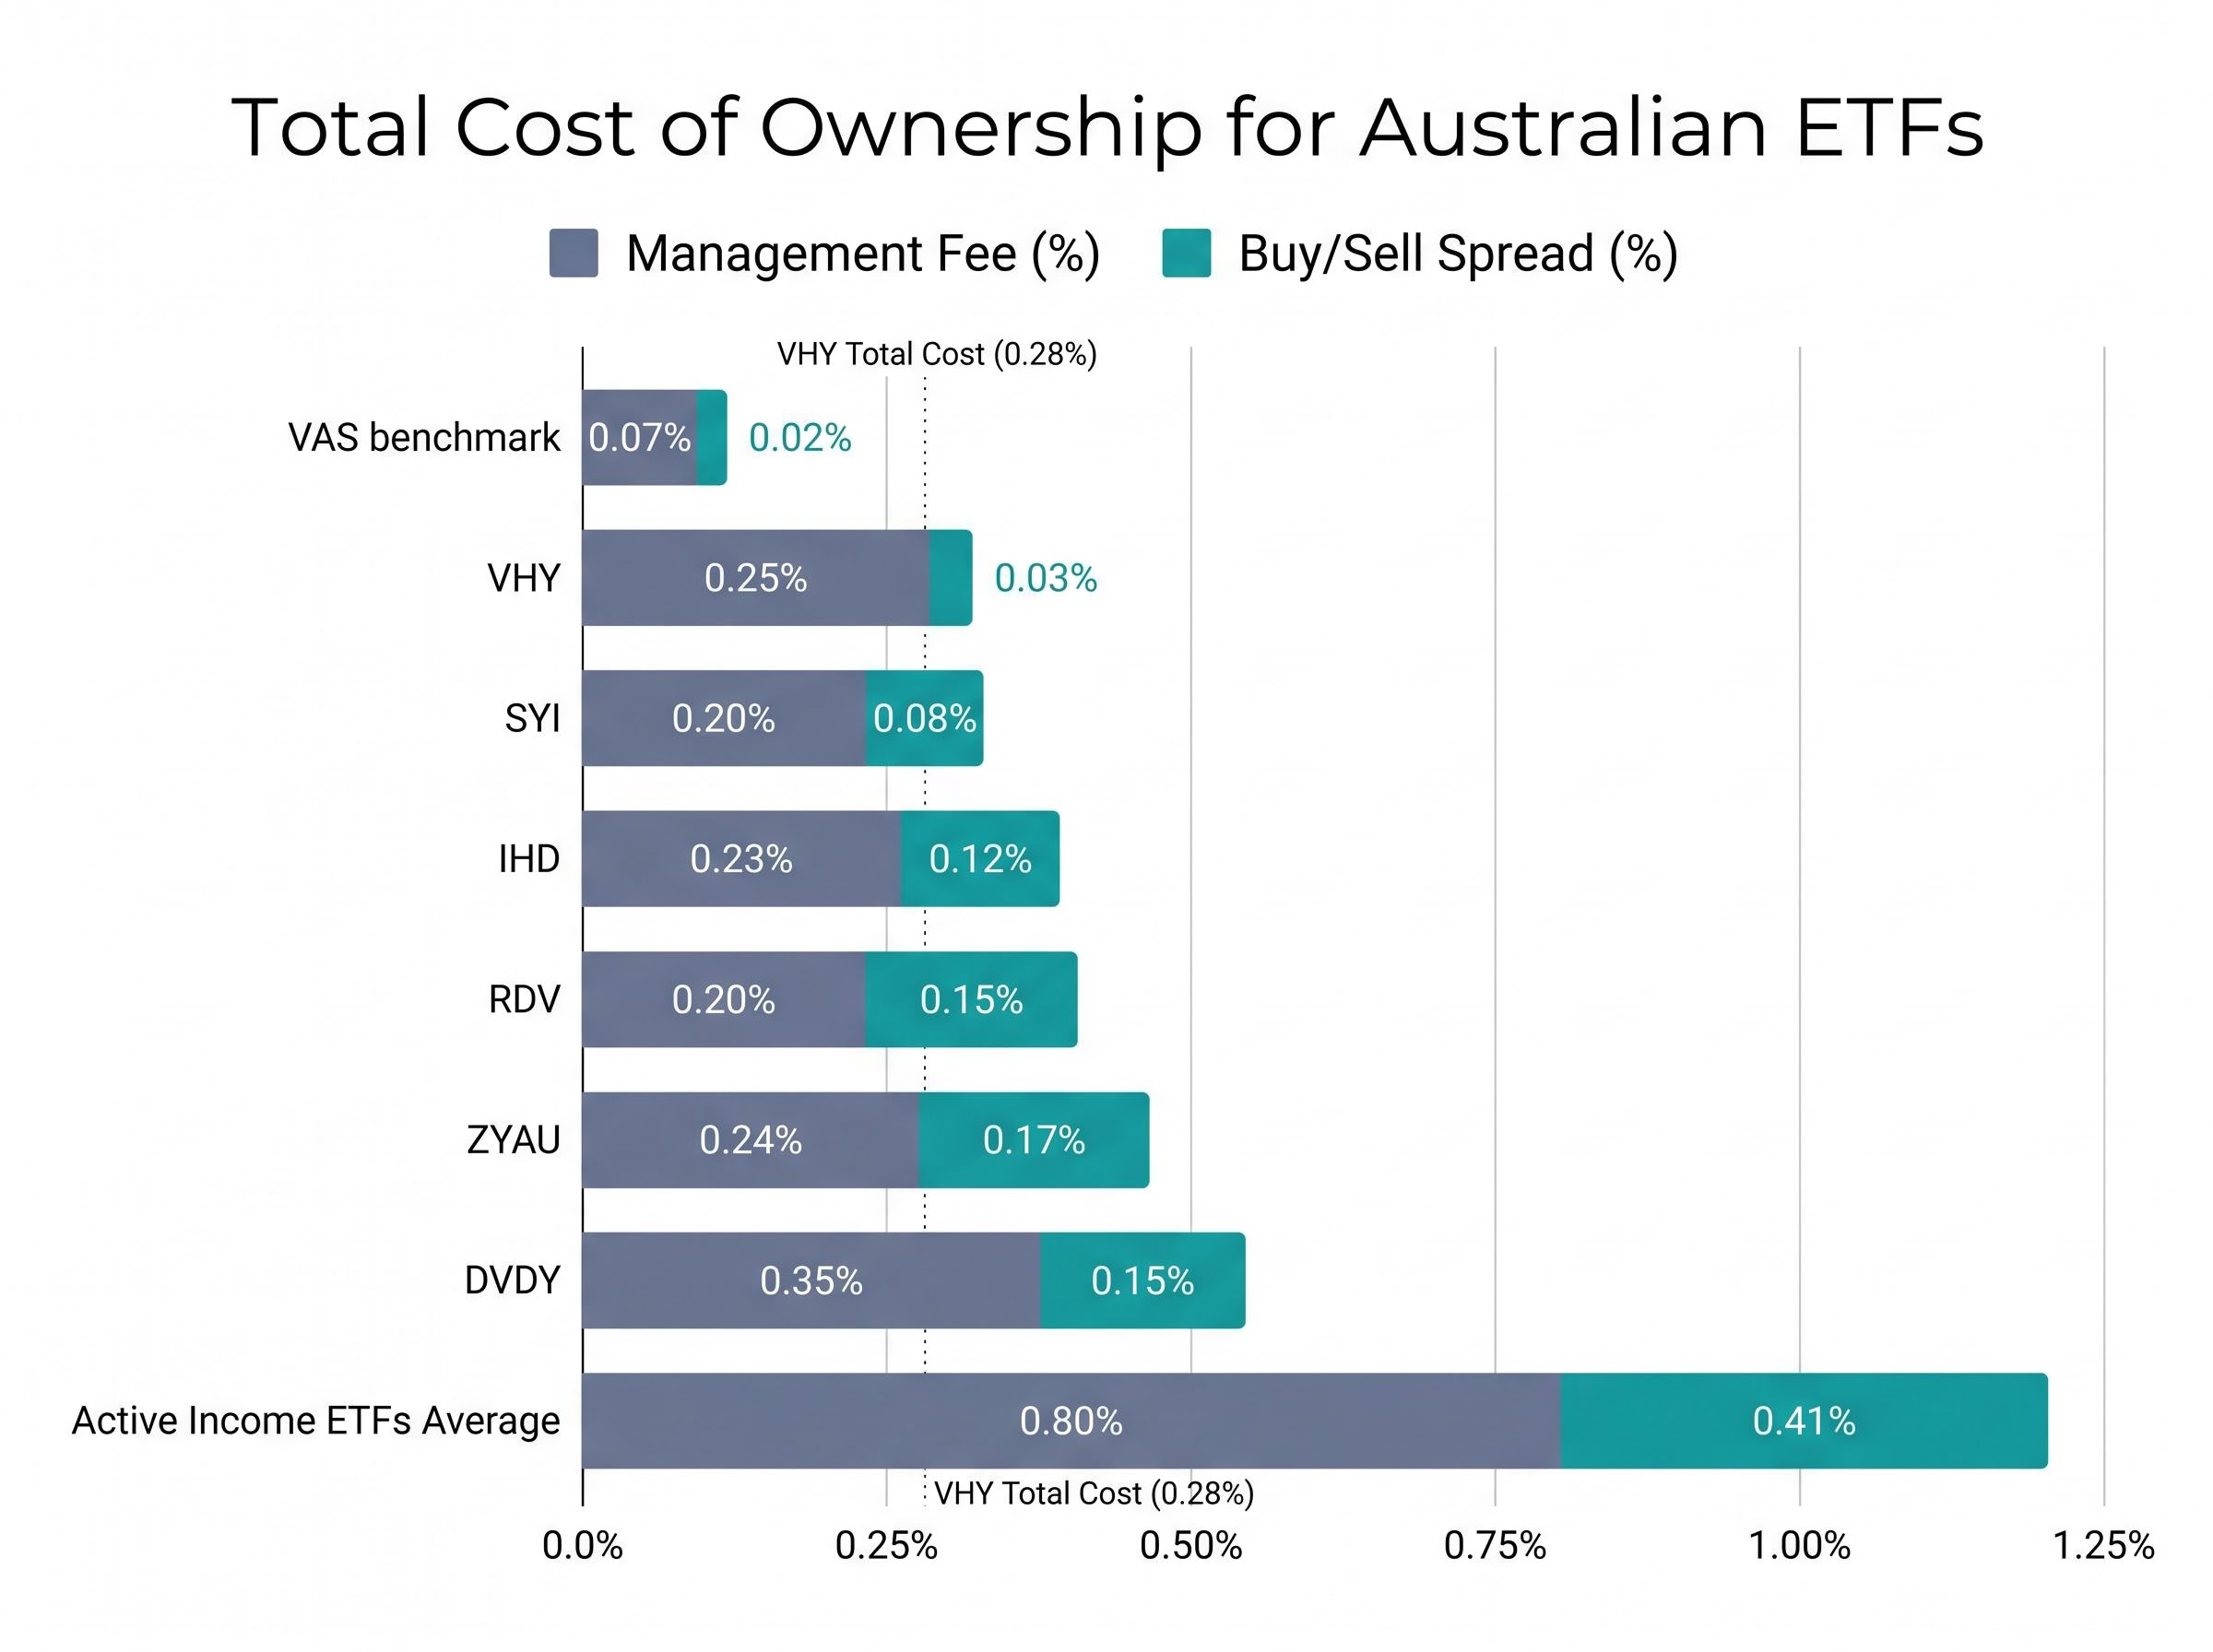
The headline management fee is only one component of what investors actually pay. The buy/sell spread, the cost of crossing the bid-ask gap each time a unit is bought or sold, changes the cost ranking meaningfully.
SYI and RDV carry the lowest management fees at 0.20% and 0.20% respectively. VHY charges 0.25%, while DVDY sits at the top at 0.35%. When trading costs are added, however, VHY’s 0.03% buy/sell spread makes it substantially cheaper to transact than ZYAU (0.17%), RDV (0.15%), or DVDY (0.15%). The peer group average spread sits at 0.12%.
For a long-term buy-and-hold investor, the management fee gap between SYI (0.20%) and VHY (0.25%) is only five basis points annually. For an investor who trades regularly, the spread differential compounds on each transaction.
Active income ETFs average a total cost of ownership of 1.21% (management 0.80% plus slippage 0.41%), more than four times the equivalent figure for VHY at 0.28%.
| ETF | Management Fee | Buy/Sell Spread | Total Cost Context |
|---|---|---|---|
| SYI | 0.20% | 0.08% | Lowest fee, moderate spread |
| IHD | 0.23% | 0.12% | Mid-range on both |
| ZYAU | 0.24% | 0.17% | Widest spread in group |
| VHY | 0.25% | 0.03% | Tightest spread; 0.28% total |
| RDV | 0.20% | 0.15% | Higher all-in cost |
| DVDY | 0.35% | 0.15% | Most expensive in group |
| VAS (benchmark) | 0.07% | 0.02% | 0.09% total; broad market ref. |
For an investor with A$100,000 in an income ETF, a 0.93% annual cost difference between VHY and the average active income fund equals over A$930 per year in additional drag, compounding materially over a decade.
The scale differences across this peer group are stark. VHY manages approximately A$7,000.67 million in funds under management. DVDY holds approximately A$31 million. That is not a minor variation; it is a structural divide that affects execution quality, exit timing, and the real-world cost of owning units.
VHY’s average daily traded value of A$23.51 million dwarfs every other fund in the group. DVDY’s A$0.09 million means even modest orders risk moving the price or sitting unfilled.
Buy/sell spread and liquidity metrics function as a cost multiplier that compounds with trading frequency: IVV’s 0.02% spread and A$12.74 billion in assets demonstrate how scale drives tighter execution quality, a dynamic that applies equally to VHY’s dominance within the domestic dividend peer group and explains why the gap between a A$7 billion fund and a A$31 million fund is not merely one of size.
| ETF | FUM (A$M) | Avg Daily Traded Value | Spread |
|---|---|---|---|
| VHY | 7,000.67 | A$23.51M | 0.03% |
| SYI | ~614 | A$2.14M | 0.08% |
| IHD | ~369 | A$0.76M | 0.12% |
| RDV | ~319 | A$0.62M | 0.15% |
| ZYAU | ~93 | A$0.38M | 0.17% |
| DVDY | ~31 | A$0.09M | 0.15% |
DVDY has recorded consecutive quarterly net outflows as at 31 March 2026, a warning sign that extends beyond low liquidity into potential viability concerns. Investors who overlook liquidity tend to discover the problem at the worst moment: during market volatility, when spreads widen and order books thin.
Warning signs to monitor in smaller ETFs:
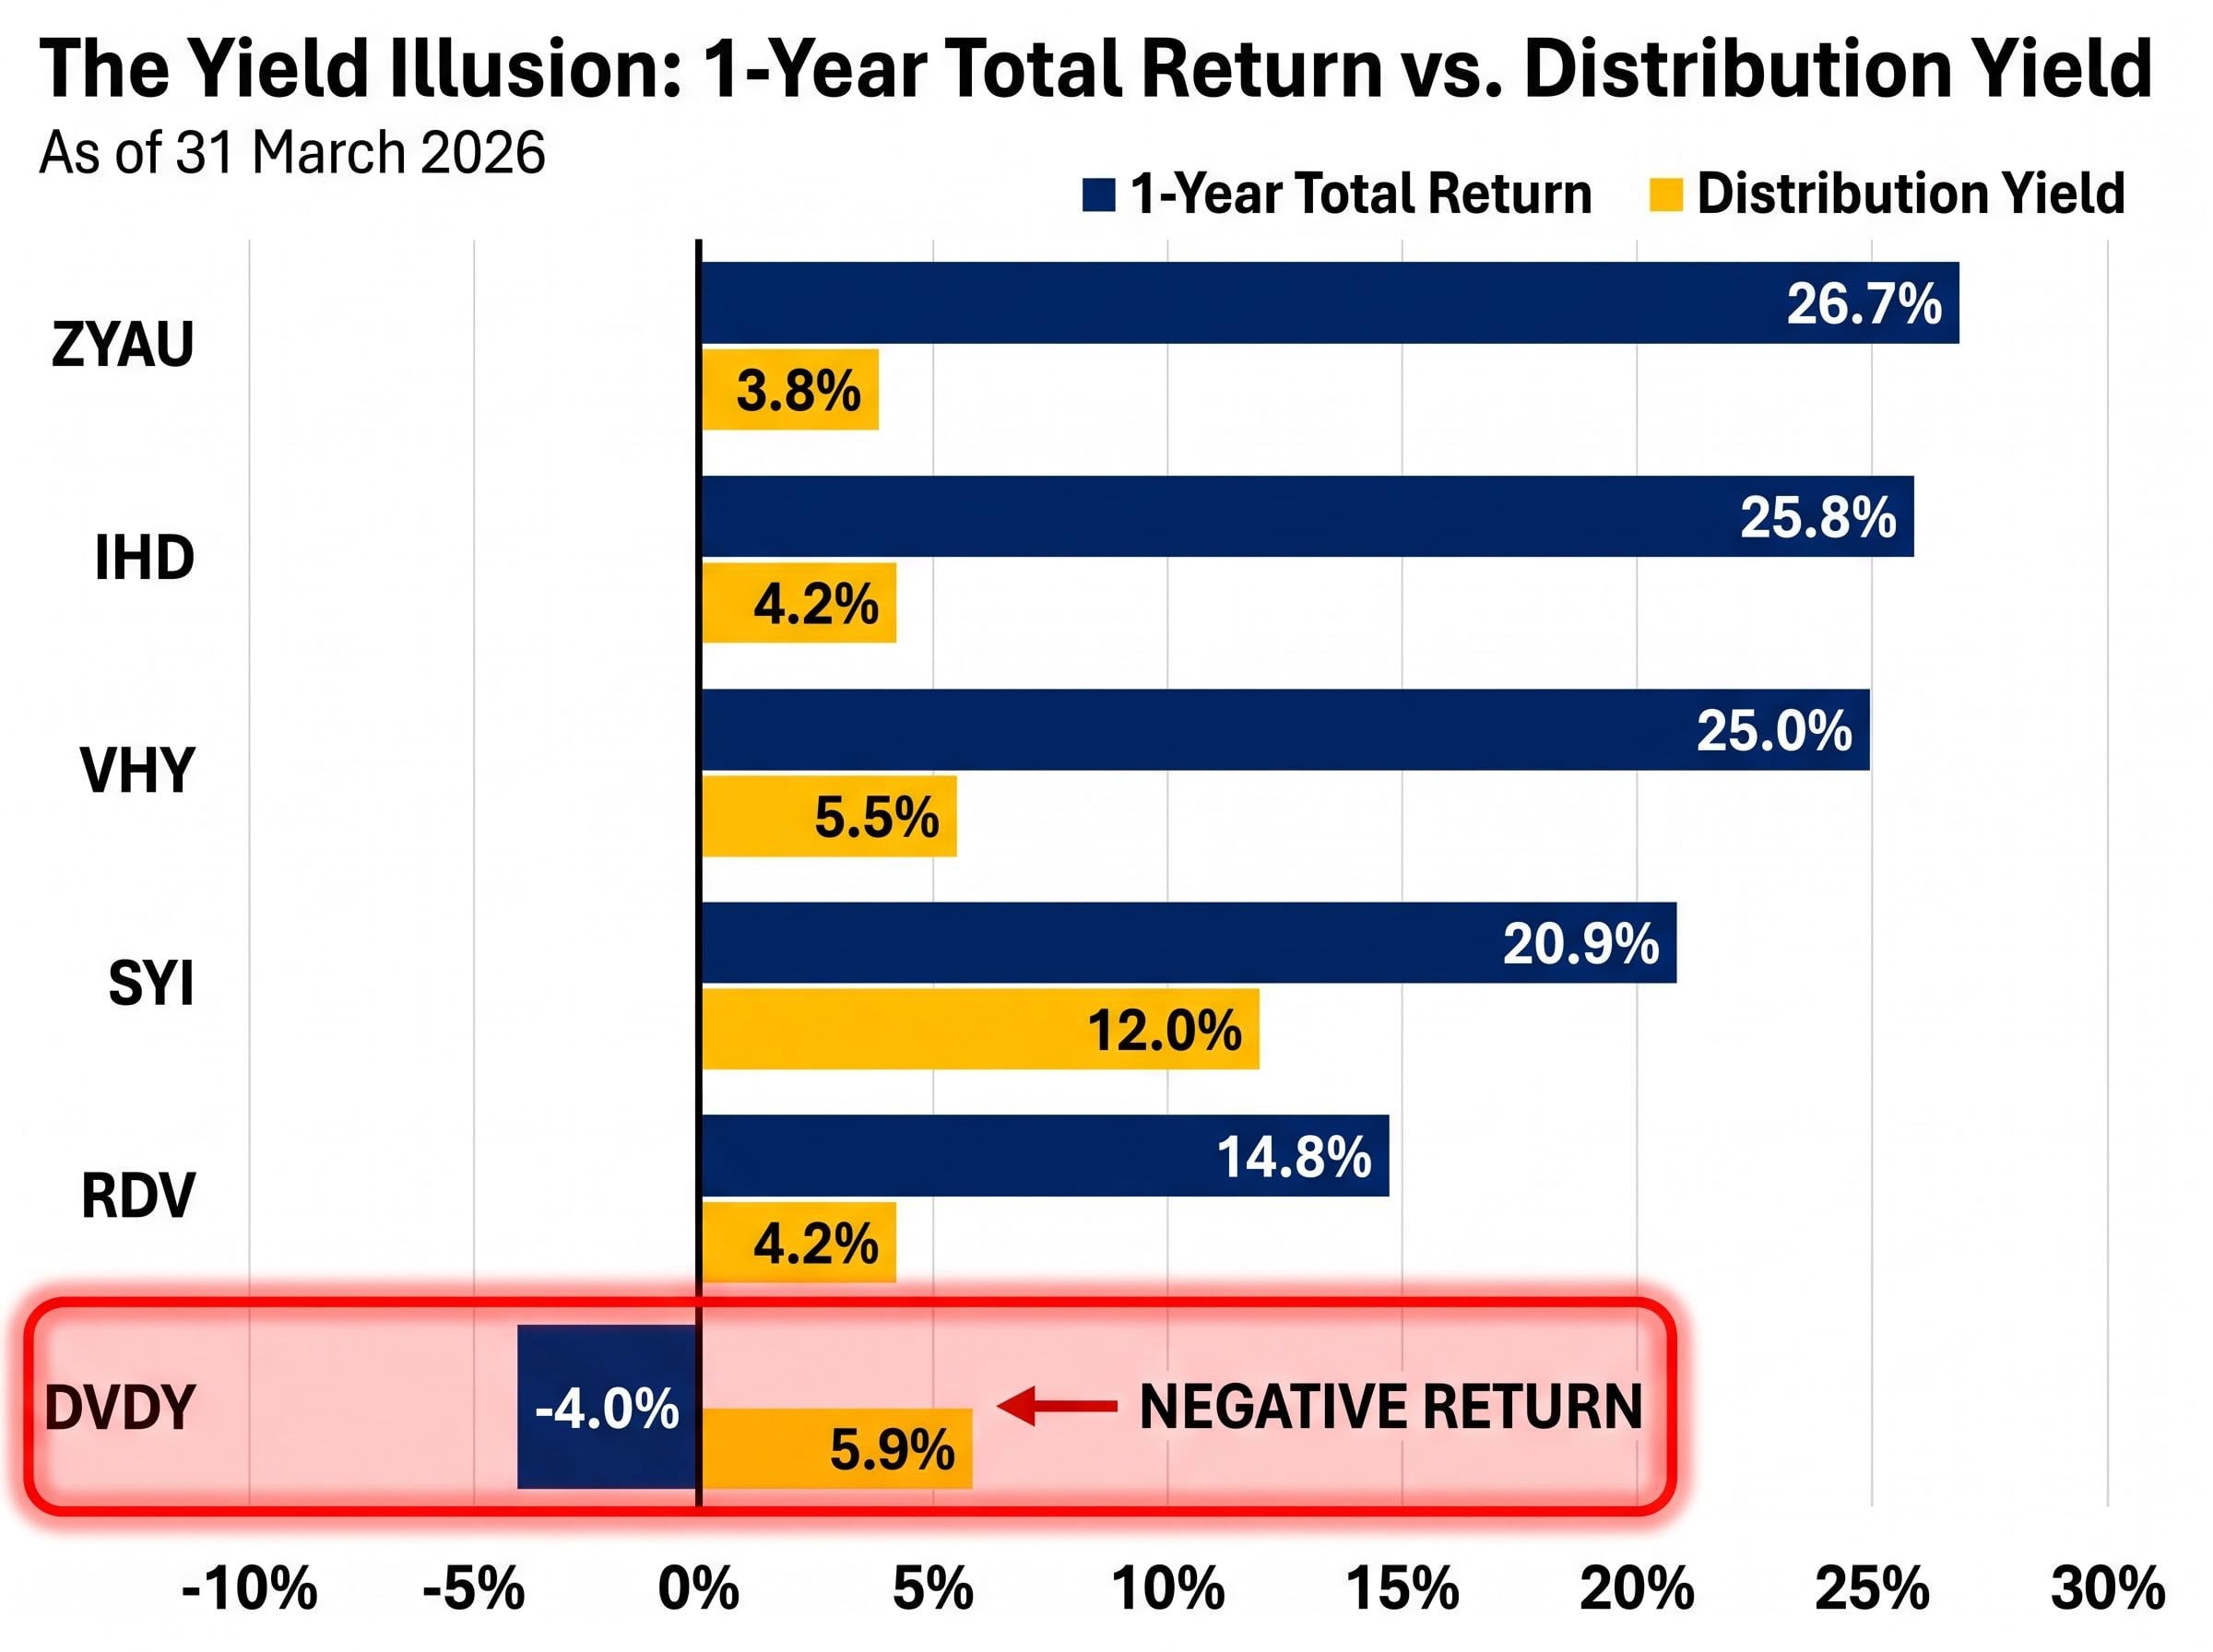
The performance numbers across these six funds, ranked by one-year total return to 31 March 2026, form a clear hierarchy: ZYAU at 26.7%, IHD at 25.8%, VHY at 25.0%, SYI at 20.9%, RDV at 14.8%, and DVDY at -4.0%.
Over three years annualised, IHD leads at 16.2%, followed by VHY at 15.8%, RDV at 12.6%, SYI at 11.8%, and DVDY at 3.7%. Over five years annualised, VHY holds the top position at 14.4%, with IHD at 12.7%, SYI at 12.5%, RDV at 10.5%, and DVDY at 4.0%.
| ETF | 1-Year Return | 3-Year p.a. | 5-Year p.a. | Distribution Yield |
|---|---|---|---|---|
| ZYAU | 26.7% | N/A | N/A | 3.8% |
| IHD | 25.8% | 16.2% | 12.7% | 4.2% |
| VHY | 25.0% | 15.8% | 14.4% | 5.5% |
| SYI | 20.9% | 11.8% | 12.5% | 12.0% |
| RDV | 14.8% | 12.6% | 10.5% | 4.2% |
| DVDY | -4.0% | 3.7% | 4.0% | 5.9% |
DVDY delivered a 5.9% trailing distribution yield and a -4.0% total return over the same period. The income came at the expense of the capital it was drawn from.
The gap between DVDY’s yield and its total return is the clearest illustration in this peer group of why chasing distribution yield in isolation destroys wealth. A fund can pay a high distribution while its unit price erodes, leaving the investor worse off than a lower-yielding alternative that preserved capital.
SYI’s trailing 12-month distribution yield of 12.0% is a significant outlier. This figure may reflect a special distribution, return-of-capital component, or portfolio restructuring event rather than a repeatable income stream. Investors should verify the composition of SYI’s distributions via the official SPDR factsheet or ASX distribution announcements before treating this yield as sustainable.
ASIC’s regulatory guide for exchange-traded products establishes the disclosure obligations that ETF issuers must meet, including the PDS accuracy requirements that investors rely on when verifying distribution composition, franking levels, and index methodology for funds such as SYI and DVDY.
Australia’s dividend imputation system allows companies to attach franking credits to dividends, representing corporate tax already paid on the profits being distributed. When an Australian resident investor receives a franked dividend, the franking credit offsets their personal tax liability. For investors with marginal tax rates below the 30% corporate tax rate, and particularly for self-managed superannuation funds (SMSFs) in pension phase, the excess franking credits are refunded as cash.
VHY’s most recent quarterly distribution of 81.14 cents per unit, paid 1 April 2026, carried 88.60% franking. This lifts the fund’s net yield of 5.5% to an effective gross yield of approximately 6.87% for eligible investors. The peer group’s high-franking funds, VHY, IHD, and ZYAU, operate in the 84-88% franking range, though precise per-distribution figures for IHD and ZYAU should be verified via official PDS documents or ASX distribution announcements.
VHY’s most recent distribution carried 88.60% franking, lifting its effective gross yield from 5.5% to approximately 6.87% for eligible Australian resident investors.
Investor types that benefit most from franking credits:
For an SMSF in pension phase holding A$500,000 in a high-franking dividend ETF, the difference between a 5.5% net yield and a 6.87% gross yield translates to approximately A$6,850 in additional after-tax income annually.
Franking credit compounding produces materially different outcomes depending on the investor’s tax position: for a pension-phase SMSF holder, the full 30% corporate tax credit is returned as cash by the ATO, a mechanism illustrated concretely in CBA’s two-year return record, where fully franked dividends lifted a 52.5% price gain into an estimated 72% total return for eligible investors.
Franking levels for DVDY and RDV have not been independently confirmed in available sources. Investors should consult official product documentation for current figures.
VHY stands as the most defensible core holding for most income-oriented investors. Its combination of A$7 billion in FUM, a 0.03% trading spread, a 14.4% five-year annualised return, and 88.60% franking on recent distributions addresses scale, cost, performance, and tax efficiency simultaneously. Stockspot includes VHY in both its Themes range and Topaz Income portfolio, reflecting its institutional acceptance as a core income building block.
Bank dividend sustainability is a material consideration for VHY holders given that Westpac alone represents 7.17% of the fund’s weight; projected dividend growth of approximately 11% across three years to FY28 would support the fund’s income trajectory, but programme cost overruns and mortgage margin compression remain the key risks that could interrupt that path.
SYI suits cost-sensitive long-term holders who value the quality-factor screen and can accept lower daily liquidity (A$2.14 million versus VHY’s A$23.51 million). At a 0.20% management fee and a 20.9% one-year return, the fund delivers strong risk-adjusted income for patient capital.
IHD appeals to ESG-aligned income investors, particularly following its December 2022 ESG screening addition. Its 25.8% one-year return is competitive, though its heavier financials and energy tilt introduces sector concentration that investors should weigh against their existing portfolio exposures.
ZYAU serves as a yield-enhancement complement for investors who accept the covered call trade-off: capped upside in strongly rising markets in exchange for premium income. Its 26.7% one-year return led the group, though that figure reflects a particularly favourable environment for covered call strategies.
RDV’s dividend sustainability focus makes it a reasonable option for investors who prioritise income stability over maximum yield, accepting its lower one-year return of 14.8% for reduced dividend-cut risk.
Red flags that should prompt investors to reconsider DVDY:
Index methodology selection is the single most consequential decision in choosing a dividend ETF. A 30-percentage-point gap separates the best and worst one-year performers within the same product category, a spread driven entirely by how each fund’s index defines, screens, and weights “high dividend.”
New entrants HYLD (launched August 2025) and VIHY (launched March 2026) are expanding the available options. Neither has accumulated sufficient track record for meaningful comparison with the established six funds. Investors considering these newer offerings should monitor performance, FUM growth, and distribution consistency over at least 12 months before making allocation decisions.
The correct measure for any income investor making an allocation decision in 2026 remains total return inclusive of franking credits, not distribution yield alone. Investors should verify current distribution and franking data via official product issuer factsheets or ASX distribution announcements before committing capital. Given VHY and IHD’s significant exposure to Australian financials and resources, reviewing portfolio concentration in those sectors against existing holdings is equally important.
Investors exploring how dividend ETFs fit within a broader portfolio designed to preserve real purchasing power will find our comprehensive walkthrough of ASX ETF portfolio construction for inflation, which covers how high-yield bonds, quality equity ETFs, and cash reserves can be combined alongside domestic income funds to generate returns that exceed Australia’s current 4.6% CPI rate.
This article is for informational purposes only and should not be considered financial advice. Investors should conduct their own research and consult with financial professionals before making investment decisions. Past performance does not guarantee future results.
VHY is the most defensible core holding for most income investors, combining A$7 billion in funds under management, a 0.03% buy/sell spread, a 14.4% five-year annualised return, and 88.60% franking on recent distributions. However, the right fund depends on the investor's priorities, with SYI suiting cost-sensitive holders and IHD appealing to ESG-aligned investors.
The 30-percentage-point performance gap between the best and worst performers in the year to 31 March 2026 comes entirely from how each fund's index defines, screens, and weights high dividend stocks. Different methodologies produce meaningfully different portfolios even when funds share the same income-focused label.
Franking credits represent corporate tax already paid on profits, and eligible Australian investors can use them to offset personal tax or, for SMSFs in pension phase, receive them as cash refunds from the ATO. VHY's 88.60% franking on its most recent distribution lifts its 5.5% net yield to an effective gross yield of approximately 6.87% for eligible investors.
Distribution yield can be misleading because a fund can pay high income while its unit price erodes, leaving investors worse off overall. DVDY posted a 5.9% trailing distribution yield but delivered a -4.0% total return over the same period, meaning the income was effectively paid out of the investor's own capital.
Key red flags include persistent net outflows across consecutive quarters, funds under management below A$50 million, a negative total return despite a positive distribution yield, and consistently wide bid-ask spreads relative to peers. DVDY exhibits all of these characteristics as at 31 March 2026.