
Nike at $44: Deep Value or Value Trap After a 62% Fall?
3 mins ago

Nike is trading at 11-year lows. The stock has fallen approximately 64% over five years, settling at roughly $44.84 as of 1 May 2026, while the S&P 500 has returned approximately 27% over the past 12 months alone. The gap between one of the world’s most recognisable consumer brands and its share price performance sits at the centre of an active investor debate.
The company is mid-turnaround under CEO Elliott Hill, whose personal share purchases, alongside a roughly $1 million buy from board member Tim Cook, signal internal conviction at the same moment that Wall Street confidence has cratered. Whether that conviction proves justified depends on a tangle of operational, competitive, and macroeconomic factors still resolving in real time. What follows breaks down what went wrong at Nike, what the “Win Now” strategy is actually betting on, how far competitive erosion has advanced, and what the scenario maths look like for investors weighing the stock at current levels.
Nike is not a company that stopped selling shoes. It is a company that stopped being rewarded for selling them. That distinction carries the entire investment debate.
Fiscal year 2025 revenue came in at $46.3 billion, down 10% year-over-year. The top line remained large in absolute terms, but gross margins compressed under aggressive discounting and a $1.5 billion annual tariff burden from China and Mexico sourcing. Net profit margins slipped below 10%, well short of the 14-15% normalised margin potential the business had historically delivered.
Nike’s fiscal 2025 full-year results confirmed revenue of $46.3 billion against a backdrop of gross margin compression, with management citing aggressive discounting and elevated input costs as the primary drivers of the gap between top-line scale and bottom-line performance.
The result is a market capitalisation of approximately $67 billion against $46 billion in annual revenue, implying a price-to-sales ratio of roughly 1-2x, a level that reflects eroded trust in earnings quality rather than a temporary dip.
While Nike shed 64% over five years, the broader market added gains that left Nike shareholders roughly 90 percentage points behind on a relative basis.
The 10-year figure is the detail that reframes the story. This is not a pandemic-era correction or a single earnings miss. It is a decade of compounding underperformance that has brought the stock back to levels last seen in 2015.
The decline did not arrive from a single miscalculation. It arrived from three interconnected decisions whose consequences compounded and then landed together.
| Decision | What was expected | What actually happened | Financial impact |
|---|---|---|---|
| DTC pivot | Higher margins, direct consumer relationships | More promotional selling, wholesale partner erosion | Margin compression, costly channel reversal |
| Classic product distribution | Sustained franchise revenue at premium pricing | Brand fatigue, pricing power collapse | ~$4B inventory withdrawal, ~5% revenue drag |
| China concentration | Growth engine via rising middle-class demand | ~20% near-term sales decline, regulatory headwinds | ~15% of revenue base under pressure |
Layoffs of approximately 1,400 employees followed, with severance costs reaching hundreds of millions of dollars. Converse weakness added a further revenue drag to forward guidance. Each decision worsened the conditions under which the others had to be corrected.
The brand dilution economics playing out at Lululemon, where gross margins contracted by 550 basis points and a $17 billion equity destruction followed a loss of pricing power among core customers, illustrate how quickly athletic brand franchises can decay once distribution discipline breaks down.
The numbers from Nike’s competitors tell the story before the analysis needs to.
On Running delivered approximately 30% revenue growth in its most recent fiscal year. Hoka, within the Deckers portfolio, grew approximately 24% over the same period, with its YouGov Brand Index rising to the mid-40s in 2026 and brand heat climbing approximately 24% month-over-month in late 2025. Adidas posted approximately 5% reported revenue growth, roughly 13% on a currency-adjusted basis.
Deckers Brands fiscal 2025 results confirmed Hoka’s approximately 24% revenue growth for the year, a figure that carries particular weight because it was achieved in the same market window where Nike reported a 10% revenue decline, making the comparison a direct test of competitive positioning rather than a macro-driven divergence.
Nike’s revenue declined approximately 10% over the comparable period.
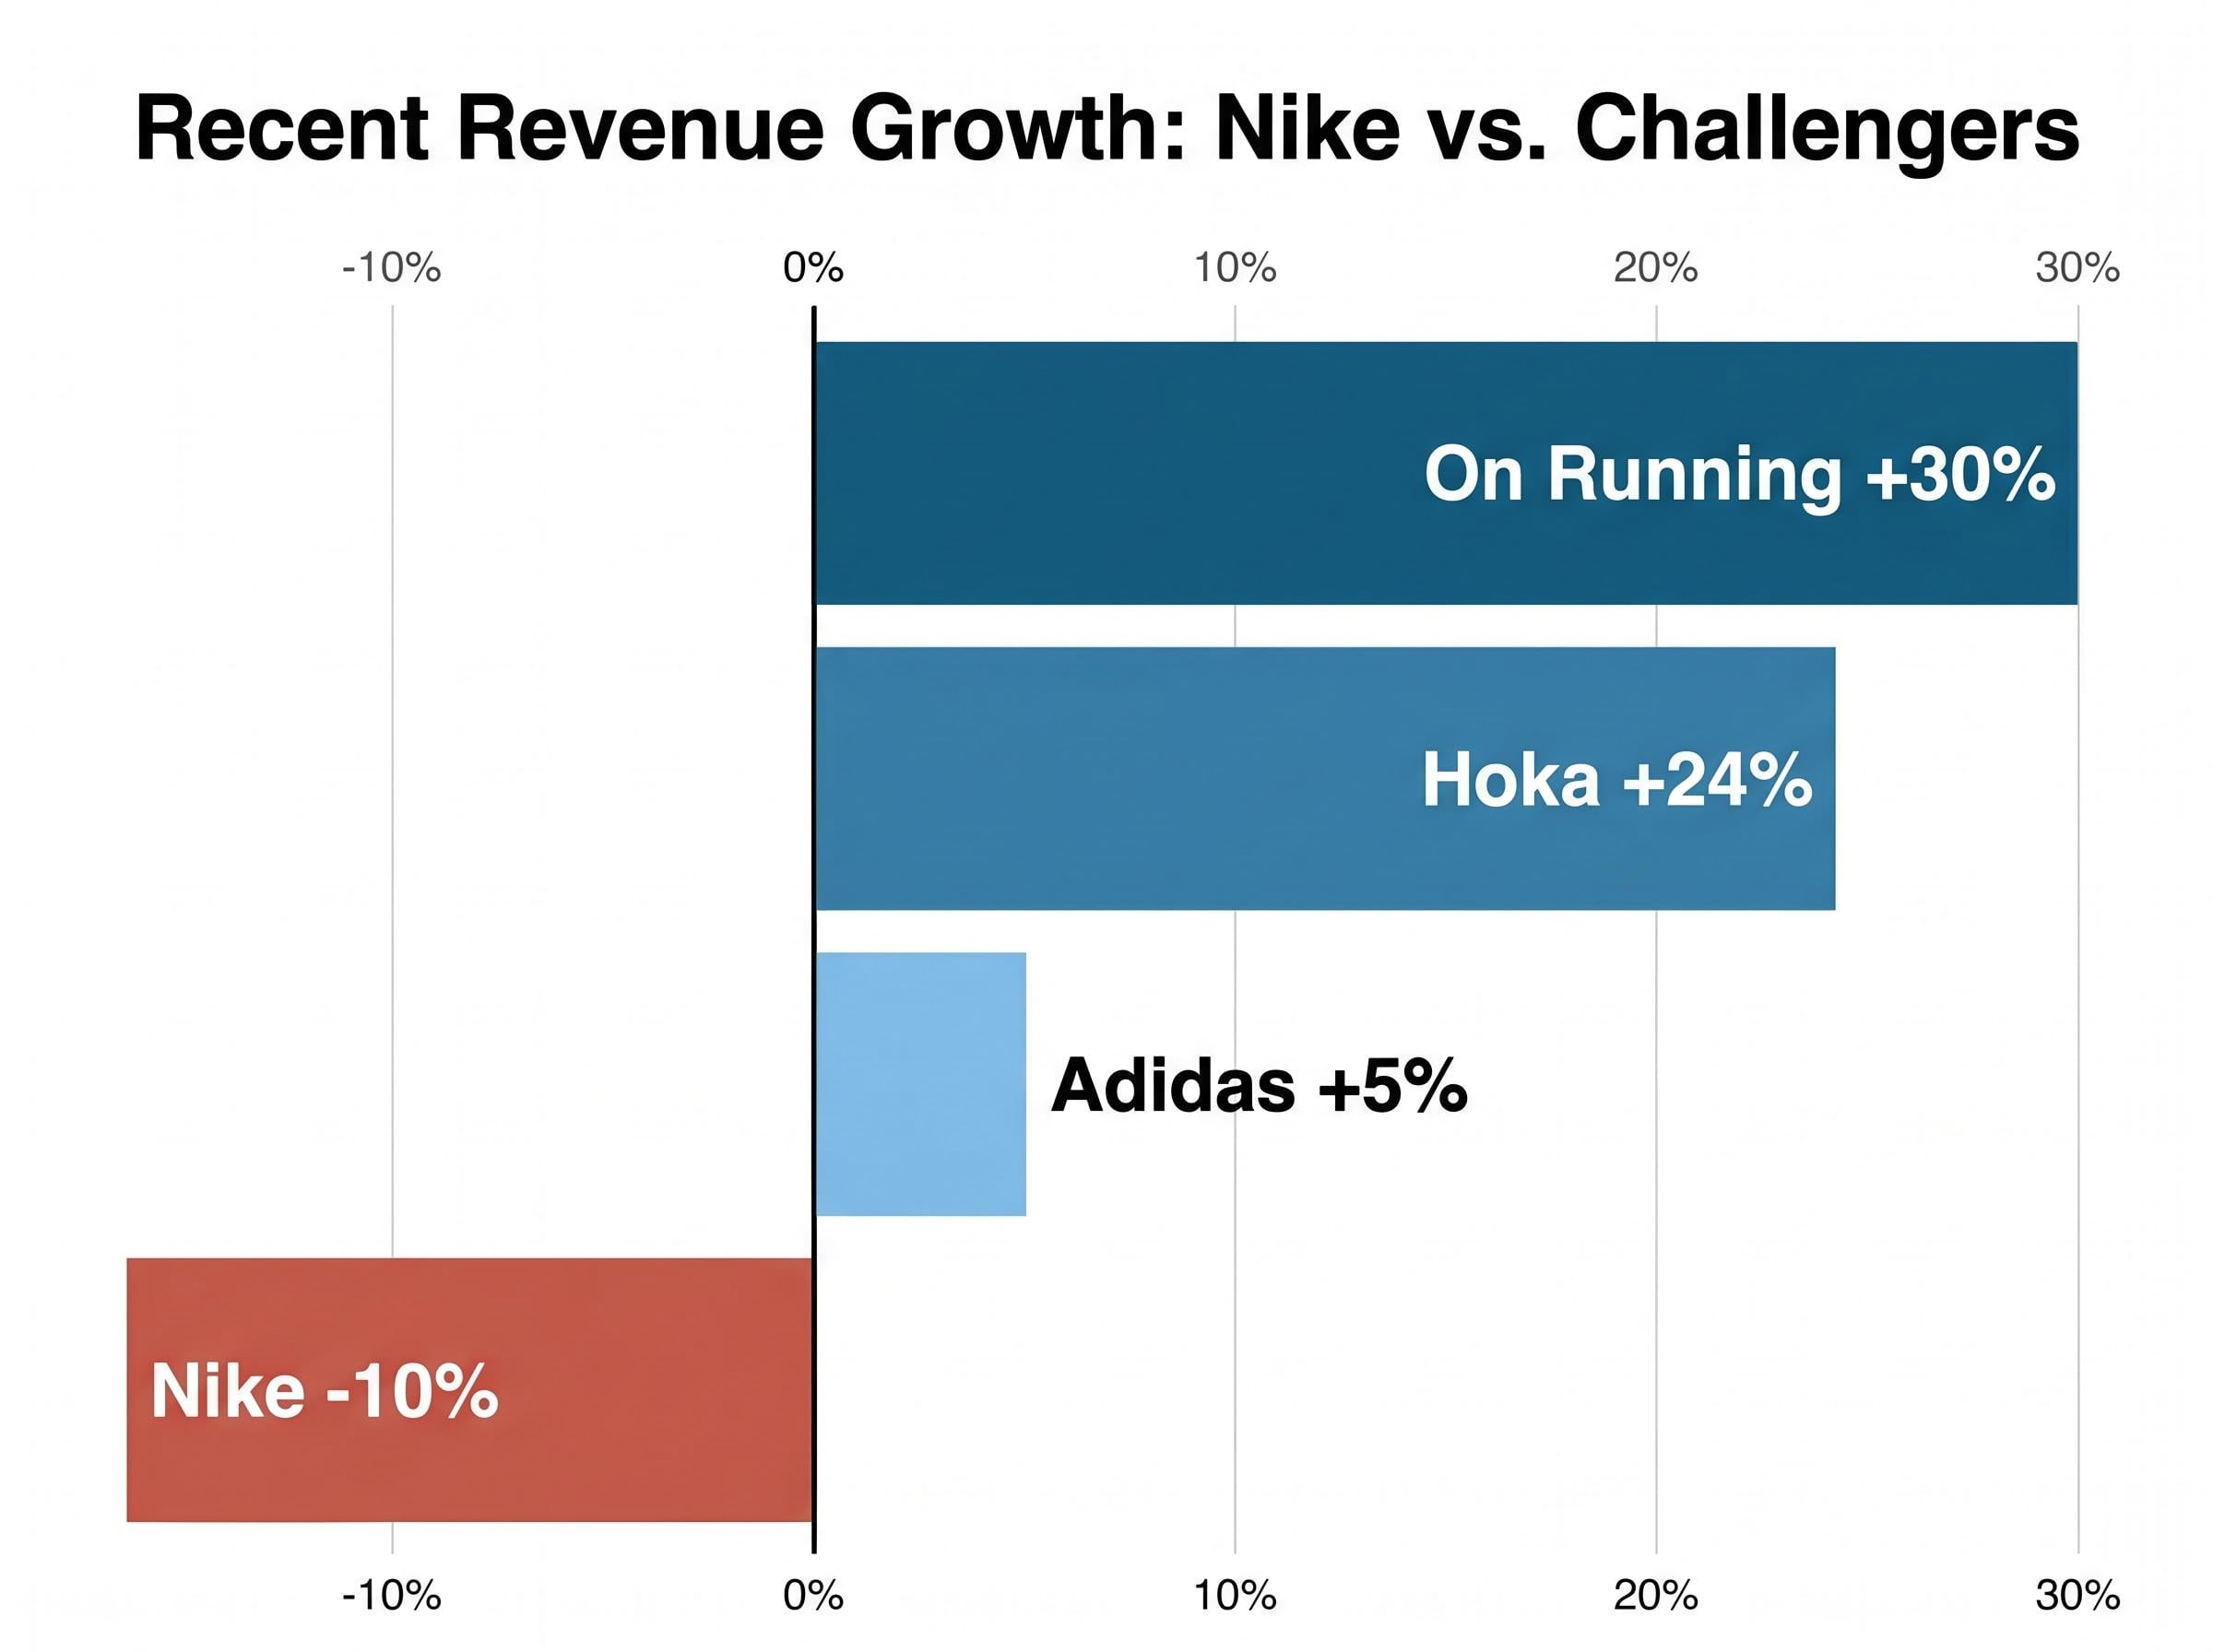
On Running growing 30%, Hoka growing 24%, Nike declining 10%, all in the same market window.
| Brand | Recent revenue growth | Key category | US competitive position |
|---|---|---|---|
| Nike | ~10% decline | Running, lifestyle | Incumbent losing share |
| On Running | ~30% growth | Performance running | Fastest-growing challenger |
| Hoka | ~24% growth | Cushioned running | Strongest brand momentum |
| Adidas | ~5% reported (~13% currency-adjusted) | Performance running, lifestyle | Re-emerging competitor |
The $7.4 billion US running shoe market represents approximately 8% of overall US footwear, but it is the category where brand relevance is most visibly tested. Once a challenger brand establishes deep customer loyalty in a performance segment, reversing that relationship has historically proved difficult. Nike’s internal running category did grow approximately 20% during its most recent reported period, a signal that efforts to re-engage are underway, but the gap in growth rates illustrates how far the recapture effort needs to travel.
This is the most contested variable in the investment case. Investors who believe the erosion is cyclical see opportunity. Those who view the challenger momentum as self-sustaining see a structural problem no turnaround plan fully addresses.
The “Win Now” strategy, initiated in late 2025 under Elliott Hill, is built on four operational commitments:
The Starbucks turnaround strategy, which similarly centres on a new CEO mandate, China recovery, and wholesale-to-direct channel rebalancing, offers a live comparison case for investors assessing whether brand equity alone is sufficient to anchor a multi-year recovery in consumer discretionary stocks.
Elliott Hill and board member Tim Cook each purchased approximately $1 million in Nike shares, a signal worth contextualising. Insider buying at distressed levels indicates management conviction but does not, on its own, validate the thesis. The more informative data point is whether operational results begin confirming the strategy’s assumptions.
Q2 FY2026 revenue reached $12.4 billion, up 1% year-over-year. North America showed growth across all distribution channels for the first time in approximately two years. That is stabilisation: revenue flat to slightly positive, not yet recovery with margin expansion.
The distinction matters because forward guidance for fiscal Q4 2026 projects revenue down 2-4%, below the FactSet consensus of -1.6%. Converse weakness and ongoing China difficulties were cited as contributing factors. A low-single-digit revenue decline is still expected through calendar year-end 2026, with full “Win Now” benefits materialising into FY2027.
The $1.5 billion annual tariff burden from China and Mexico sourcing adds a persistent margin headwind that operates independently of whether the strategic execution succeeds. The turnaround plan is credible on paper; the timeline and conditions under which it must deliver remain demanding.
The question is not whether Nike recovers. The question is which conditions would need to hold for each outcome to materialise.
The stock trades at approximately 22.88x forward earnings as of 1 May 2026, with a dividend yield of approximately 3.70% (recently raised 3% to $0.41 per share) and a debt-to-equity ratio of approximately 0.6.
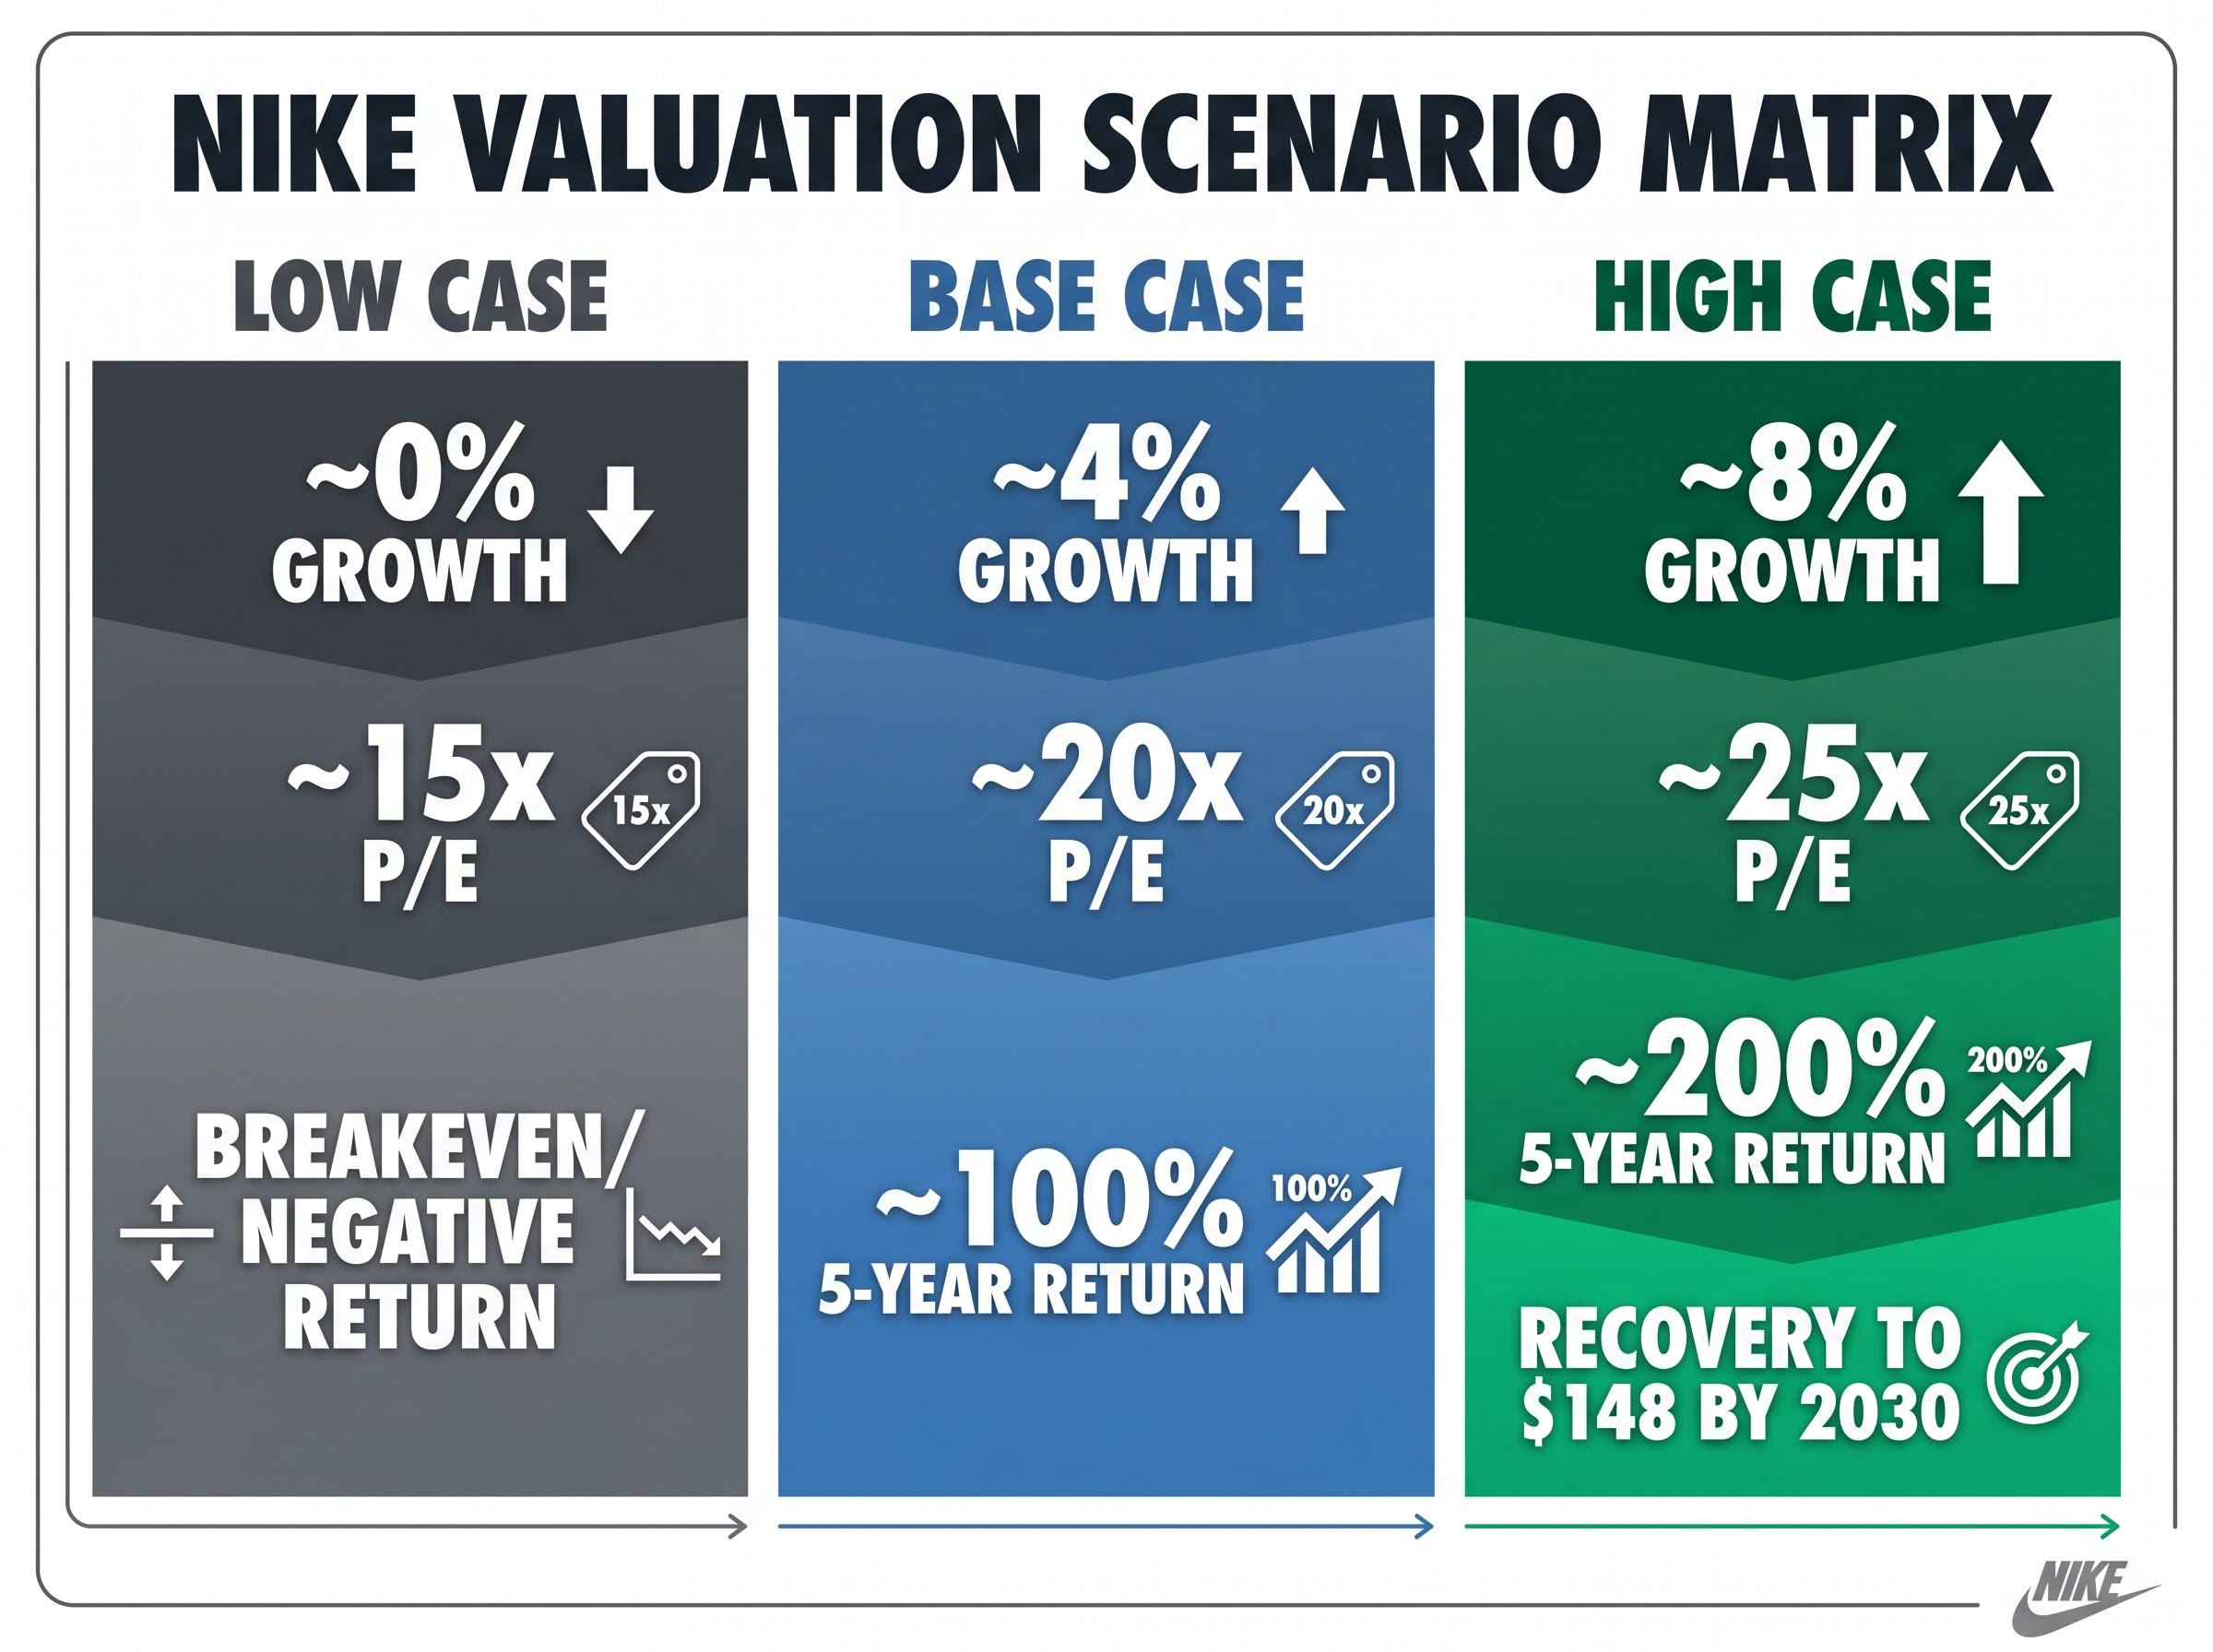
| Scenario | Revenue growth assumption | P/E multiple | Implied 5-year return |
|---|---|---|---|
| Low case | ~0% (flat) | ~15x | Roughly breakeven to slightly negative |
| Base case | ~4% annual | ~20x | ~100% over five years |
| High case | ~8% annual | ~25x | ~200% over five years |
The low case assumes competitive erosion proves structural rather than cyclical, margins do not recover to mid-teens, and the multiple compresses further. The base and high cases are contingent on 4-8% annual revenue growth resuming alongside P/E expansion to the 20-25x range, which could imply a recovery toward $148 by 2030 in the most favourable scenario.
Peter Lynch observed that a large proportion of anticipated corporate turnarounds ultimately fail to materialise. That observation does not predict Nike’s outcome, but it calibrates the risk embedded in any turnaround thesis.
The 3.70% dividend yield and healthy balance sheet provide a measurable floor, but a floor is not a thesis. The upside case requires both operational execution and multiple expansion, conditions that depend on outcomes not yet visible in the data.
US consumer spending fragility adds a layer of macro risk to Nike’s recovery timeline that operates independently of competitive or operational execution; a household savings rate near 4% and deteriorating consumer sentiment create conditions where even a well-executed turnaround faces demand headwinds that the company cannot control.
Past performance does not guarantee future results. Financial projections are subject to market conditions and various risk factors.
Three variables will determine which scenario materialises, and each is independently trackable through 2026 and into 2027:
The balance sheet provides a floor. A debt-to-equity ratio of approximately 0.6 and a dividend yield of approximately 3.70% support the company through the transition period without forcing dilutive capital raises. The $1.5 billion annual tariff burden persists regardless of operational execution, capping margin recovery potential in the near term.
The distinction that matters most: brand recovery is necessary but not sufficient. If Nike re-establishes product relevance and stabilises revenue without a corresponding multiple expansion, shareholders may find that the turnaround worked for the business but not for the stock. Elliott Hill has set calendar year-end 2026 as the completion target for foundational actions. The data that follows will determine whether conviction was warranted.
Investors exploring what shareholder pressure looks like when an athletic brand turnaround stalls will find our deep-dive into the Lululemon proxy battle, which examines how a $20 billion equity collapse triggered an activist governance campaign, the structural hurdles that limit board-level change, and the leadership transition dynamics that followed.
This article is for informational purposes only and should not be considered financial advice. Investors should conduct their own research and consult with financial professionals before making investment decisions.
Nike stock declined approximately 64% over five years due to three compounding strategic errors: an aggressive direct-to-consumer pivot that damaged wholesale relationships, oversaturation of classic product lines that eroded brand pricing power, and heavy China revenue exposure that faced a projected 20% near-term sales decline with no structural hedge.
The 'Win Now' strategy, launched in late 2025 under new CEO Elliott Hill, focuses on four pillars: rebuilding wholesale distribution partnerships, re-prioritising performance product innovation, increasing marketing investment, and driving organisational restructuring across all business units, with foundational actions targeted to complete by calendar year-end 2026.
Nike stock trades at approximately 22.88x forward earnings with a 3.70% dividend yield and a debt-to-equity ratio of around 0.6, providing a balance sheet floor, but the upside case requires both operational execution and P/E multiple expansion to the 20-25x range, conditions that depend on outcomes not yet visible in the data.
On Running delivered approximately 30% revenue growth and Hoka grew approximately 24% in the same period that Nike reported a 10% revenue decline, making these two performance running challengers the most visible evidence of competitive share loss at the incumbent brand.
The three key variables to monitor are whether Nike's running category growth narrows the gap with On Running and Hoka, whether China's projected 20% near-term revenue decline stabilises, and whether FY2027 net margins recover toward the 14-15% range once inventory withdrawal and channel rebalancing are substantially complete.


