Citi Puts Memory Supply Above Chip Design in AI Stock Rankings
1 hr ago
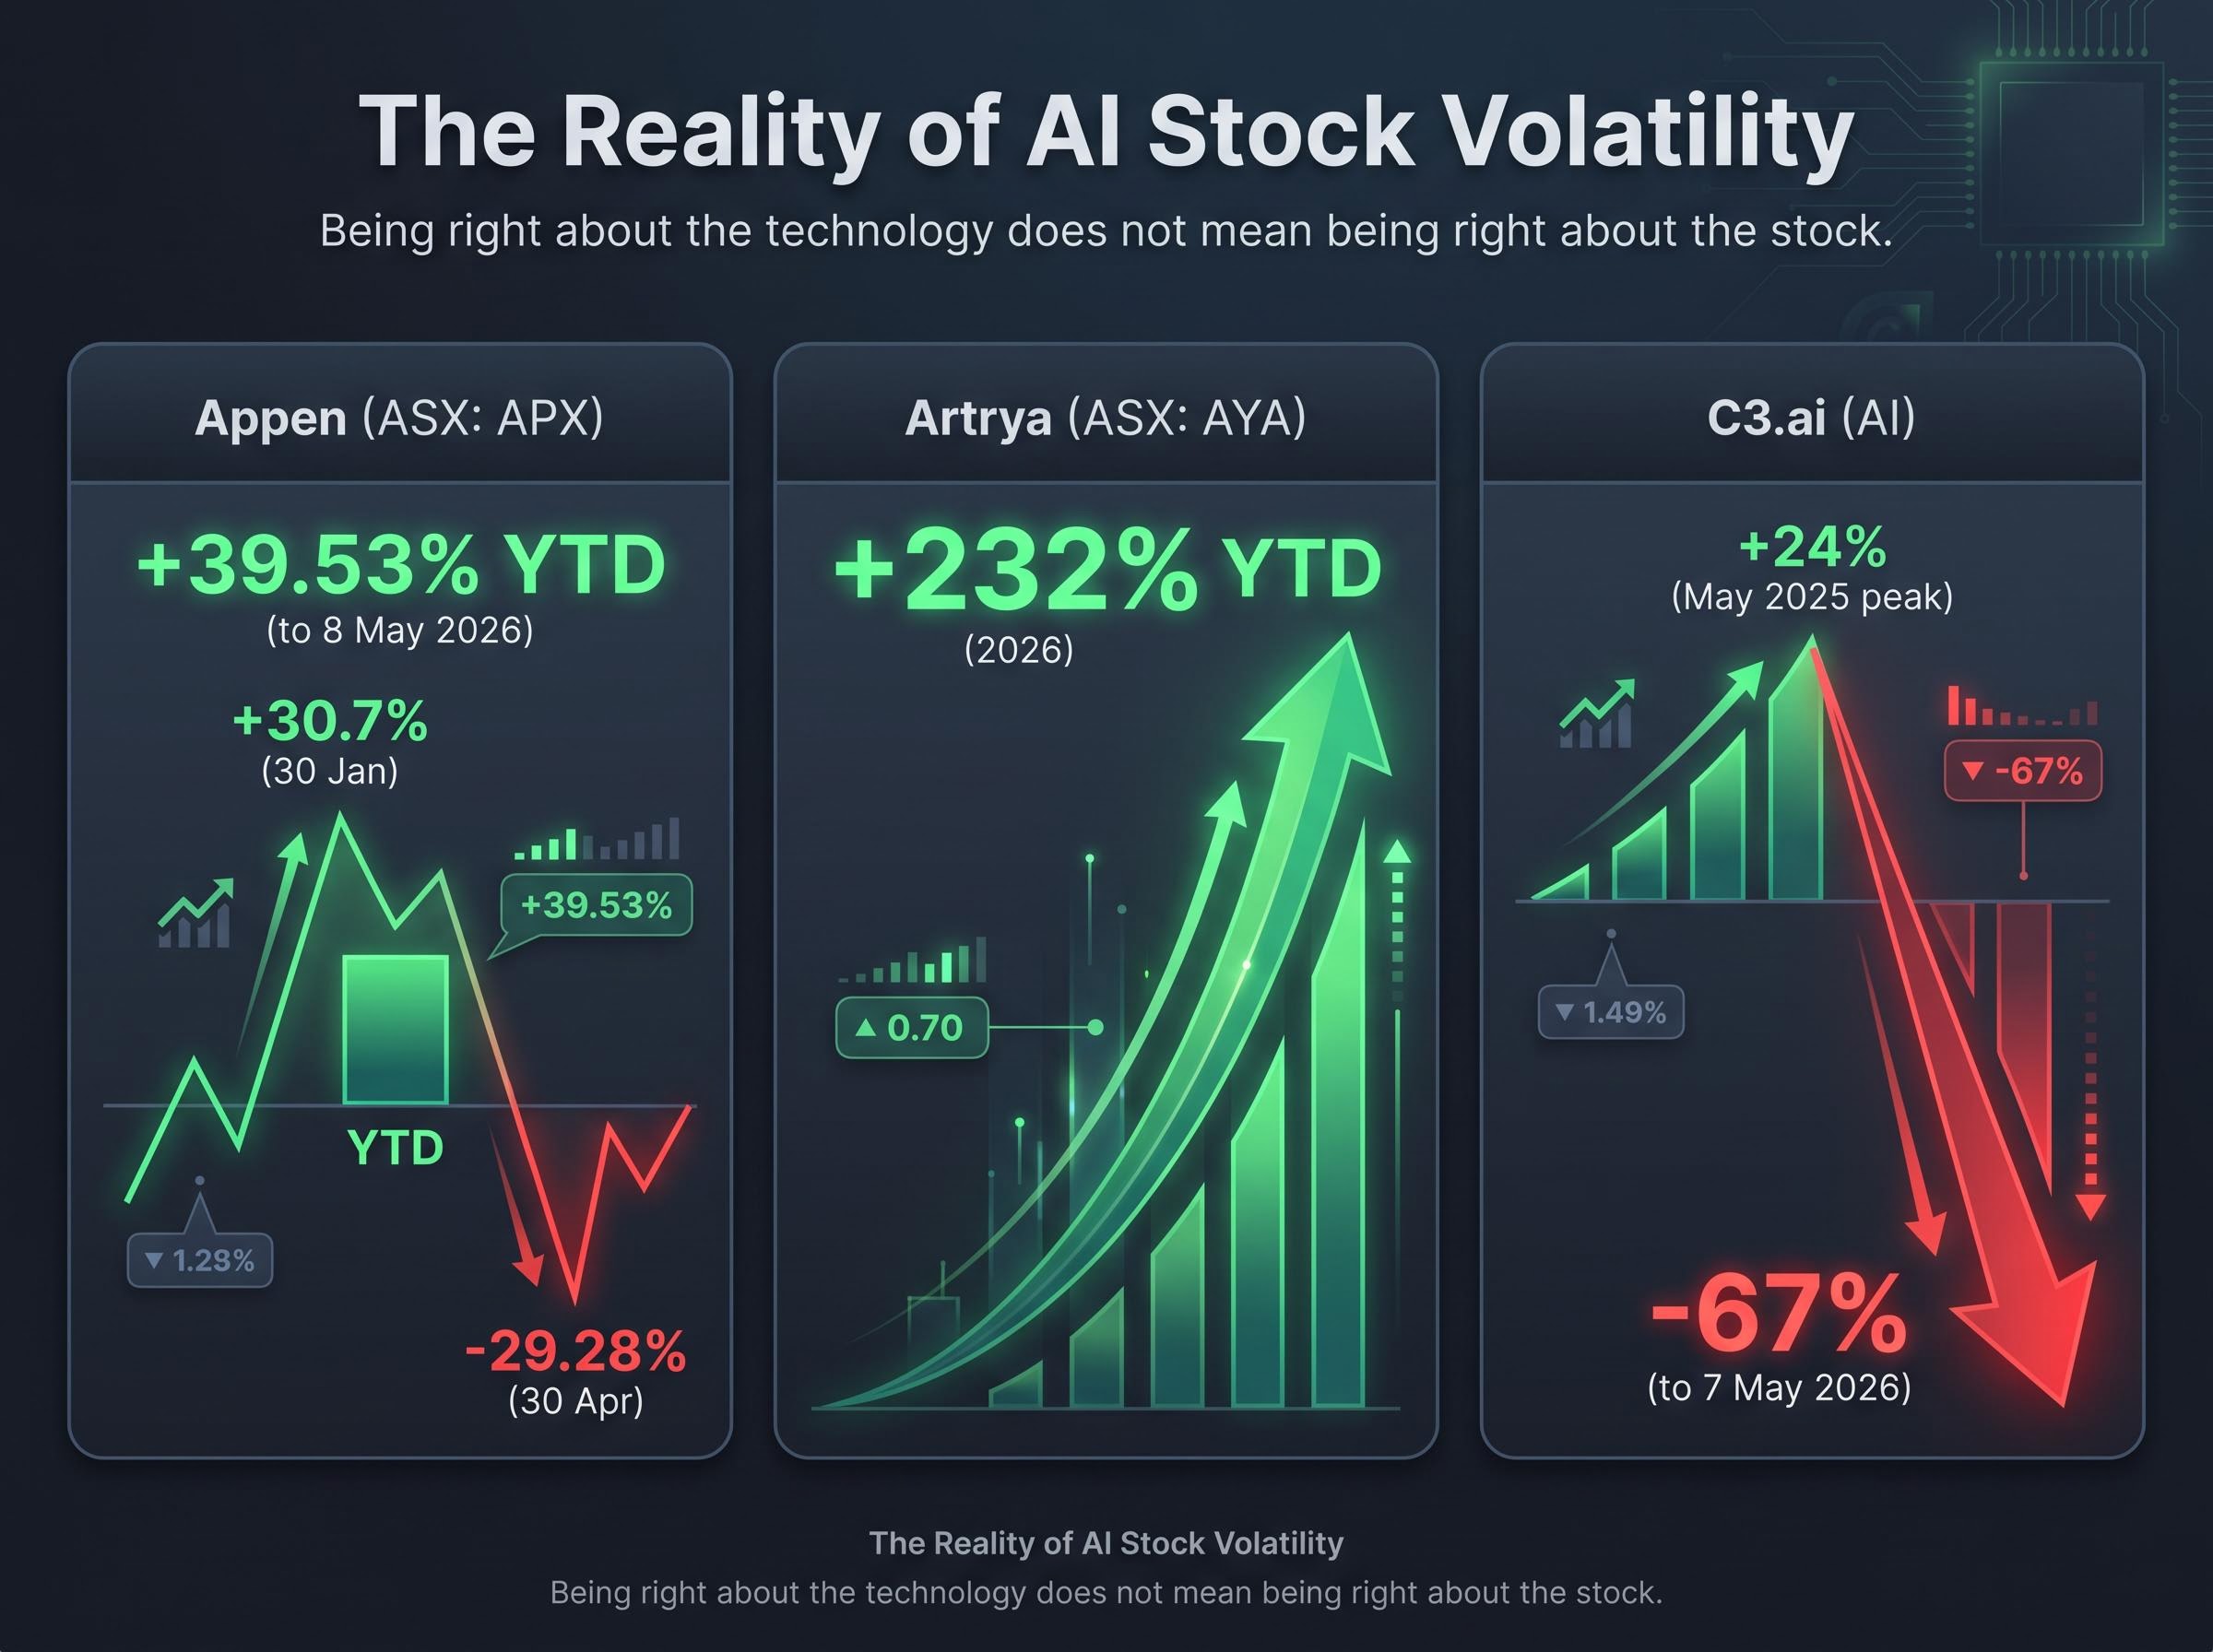
C3.ai surged 24% in under three months in mid-2025, then collapsed 67% by May 2026. Appen swung 30% in a single day. For Australian investors watching artificial intelligence reshape the global economy, the returns look spectacular until suddenly they do not.
AI is attracting capital at a scale not seen since the late 1990s internet boom, and for good reason. The technology is genuinely capable of altering how businesses operate, how capital is allocated, and how entire industries are structured. But the history of such shifts carries a warning that is easy to miss when enthusiasm is running high: being right about the technology does not mean being right about the stock. This analysis uses the dot-com era as a parallel to examine why individual AI stock selection carries structural risks that most retail investors underestimate, then maps those lessons onto the specific options available to Australians looking to invest in AI through the ASX today.
The investors who lost the most during the early 2000s dot-com collapse were not wrong about the internet. They were right. The internet did transform commerce, communication, and daily life. Their mistake was assuming that a correct thesis about a technology translated into a correct thesis about a company.
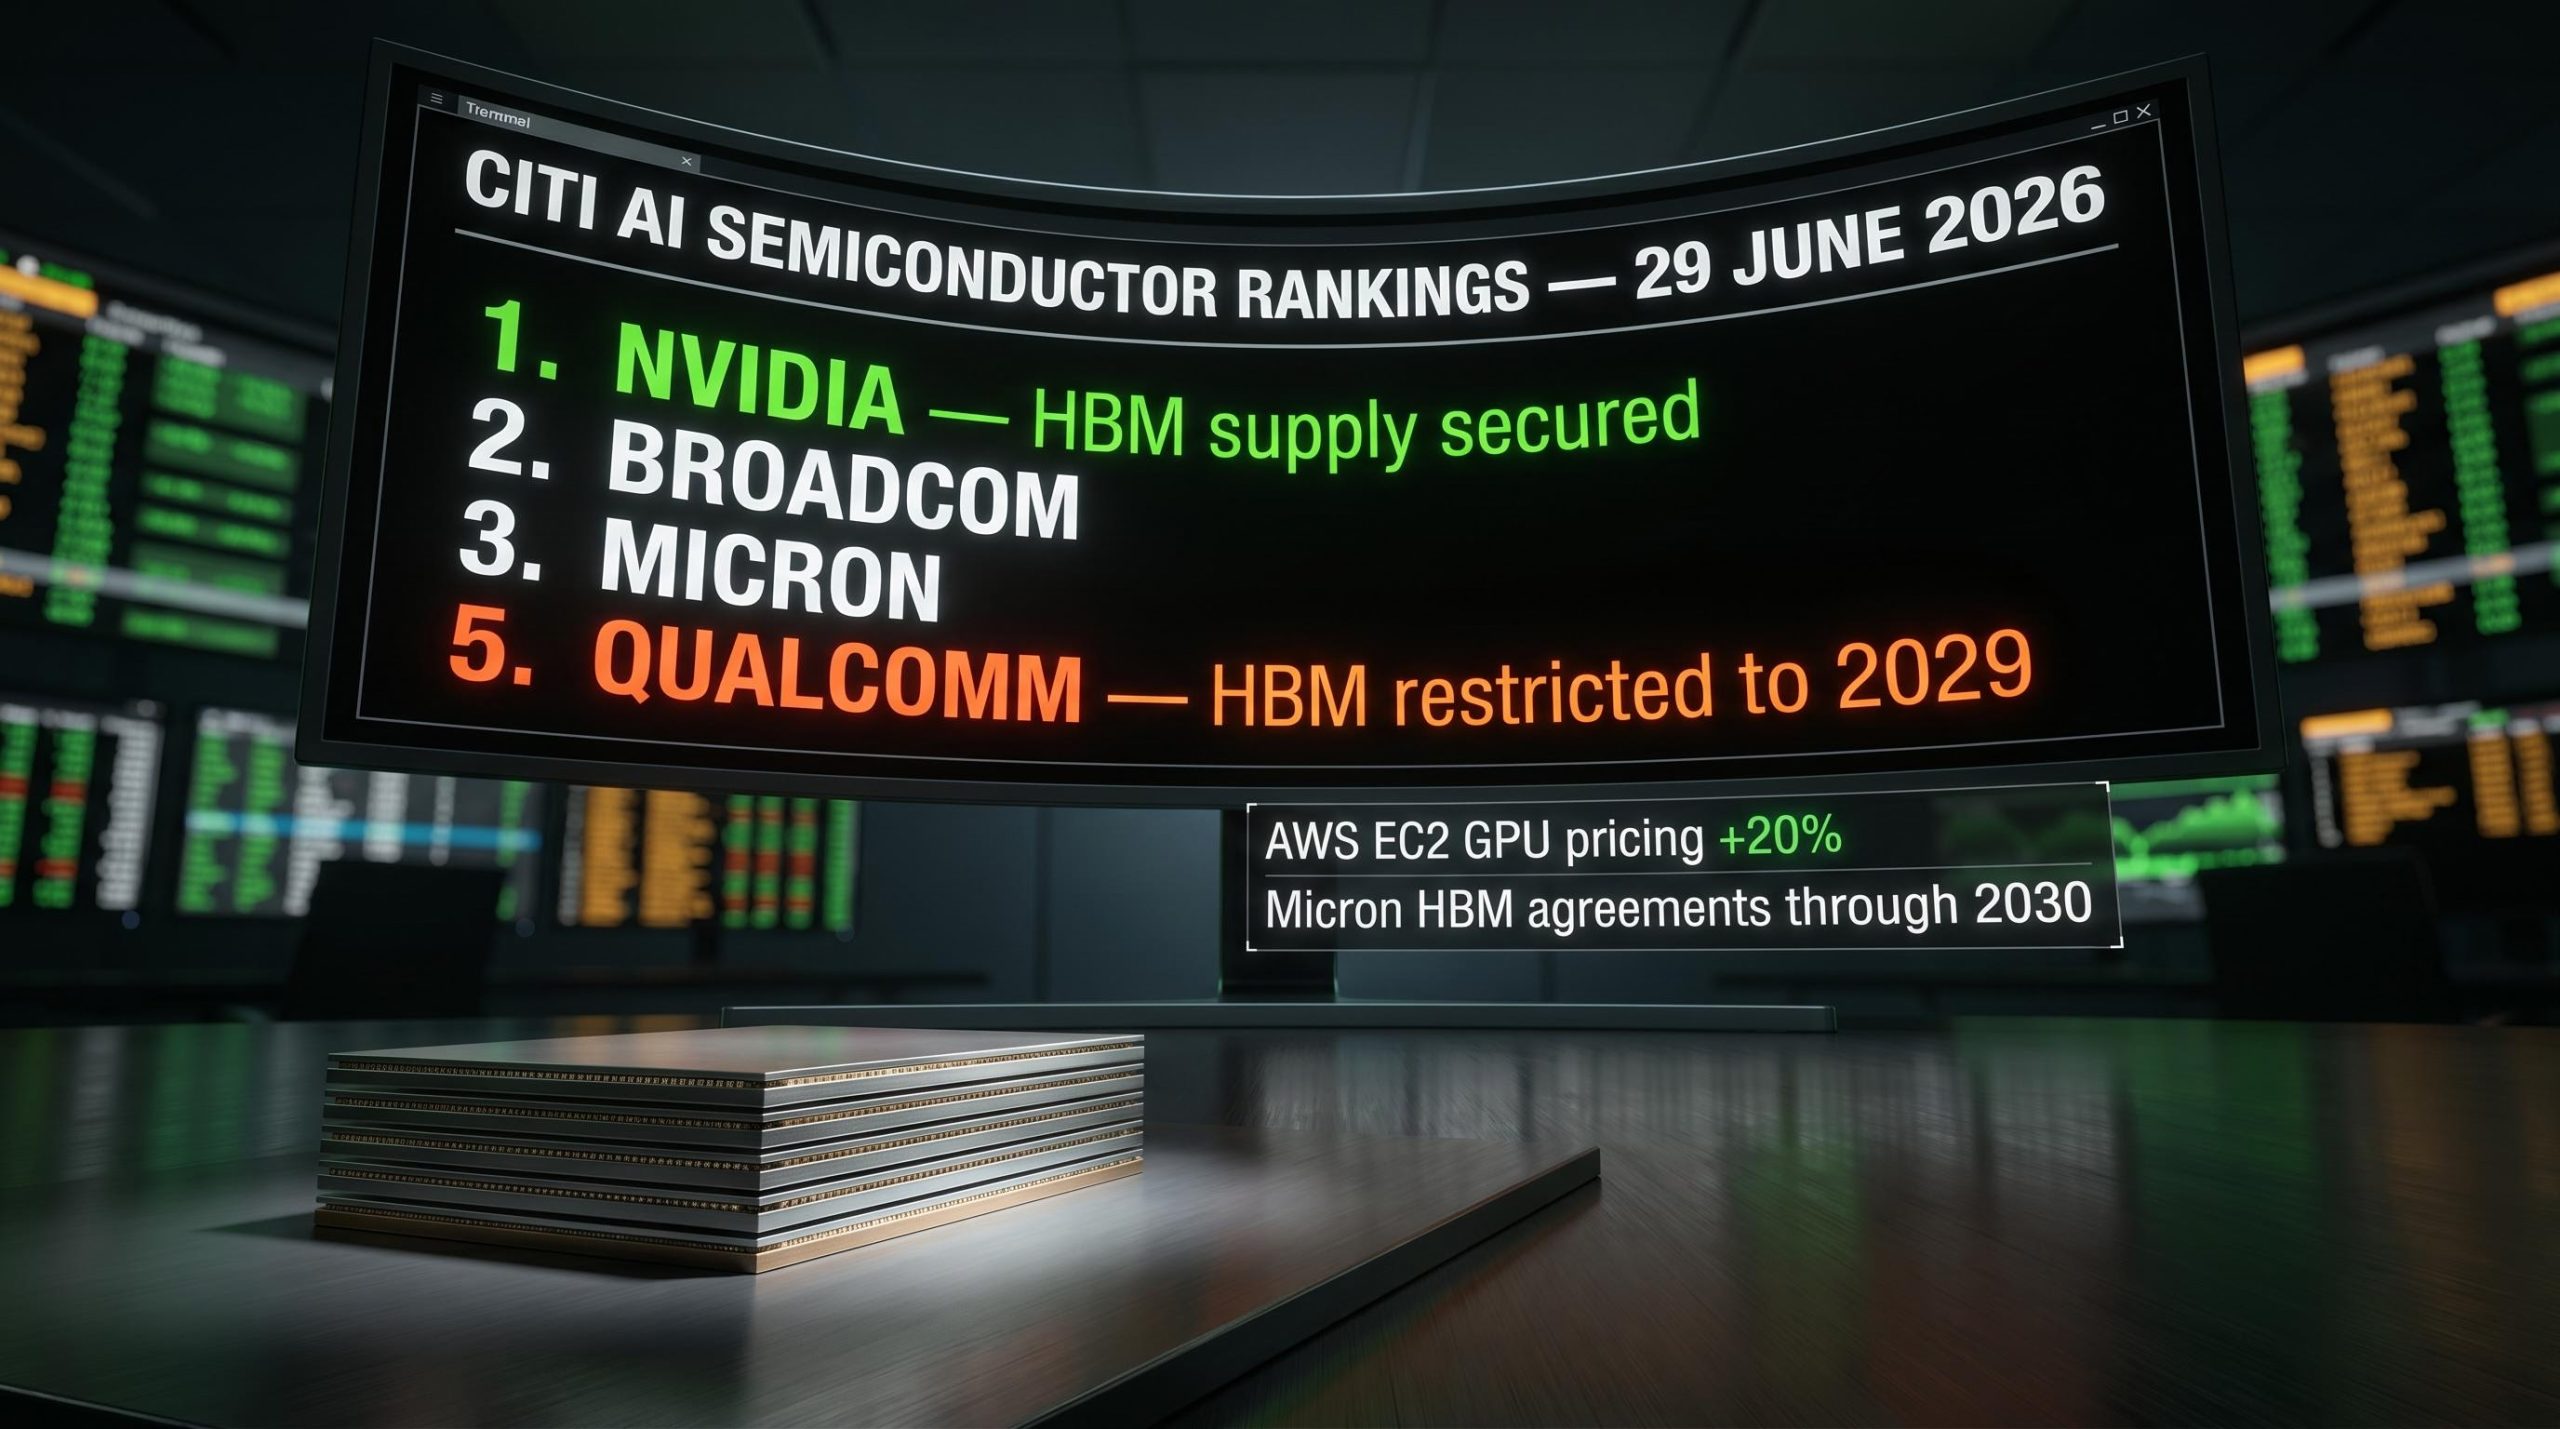
Paul Tudor Jones framed the AI bull market runway as one to two years on 6 May 2026, drawing a direct parallel to 1999 and positioning current AI valuations as a risk horizon rather than an immediate exit signal, a view that sits uncomfortably alongside Arm Holdings trading at 85x forward P/E and the S&P 500 Shiller CAPE at its second-highest reading in 155 years.
For every Amazon that survived and compounded for two decades, there were dozens of well-funded ventures that disappeared entirely. Yahoo, once the dominant portal, lost 97% of its peak value and was eventually sold for parts. Pets.com, backed by $110 million in venture capital, lasted precisely 268 days as a public company.
Both categories attracted enthusiastic investment. Both were praised by analysts. Both were “obviously” positioned to benefit from an unstoppable technological shift. The difference between them was invisible at the time.
The problem was never being early to the technology. The problem was underestimating how difficult it was to identify which specific companies would still be standing a decade later.
Looking at AI from 2026, investors face the same identification challenge that internet investors faced in 1999. The question is whether the lesson has been absorbed or merely acknowledged.
The identification problem is not a historical curiosity. It is playing out in real time across both ASX-listed AI stocks and globally accessible US names.
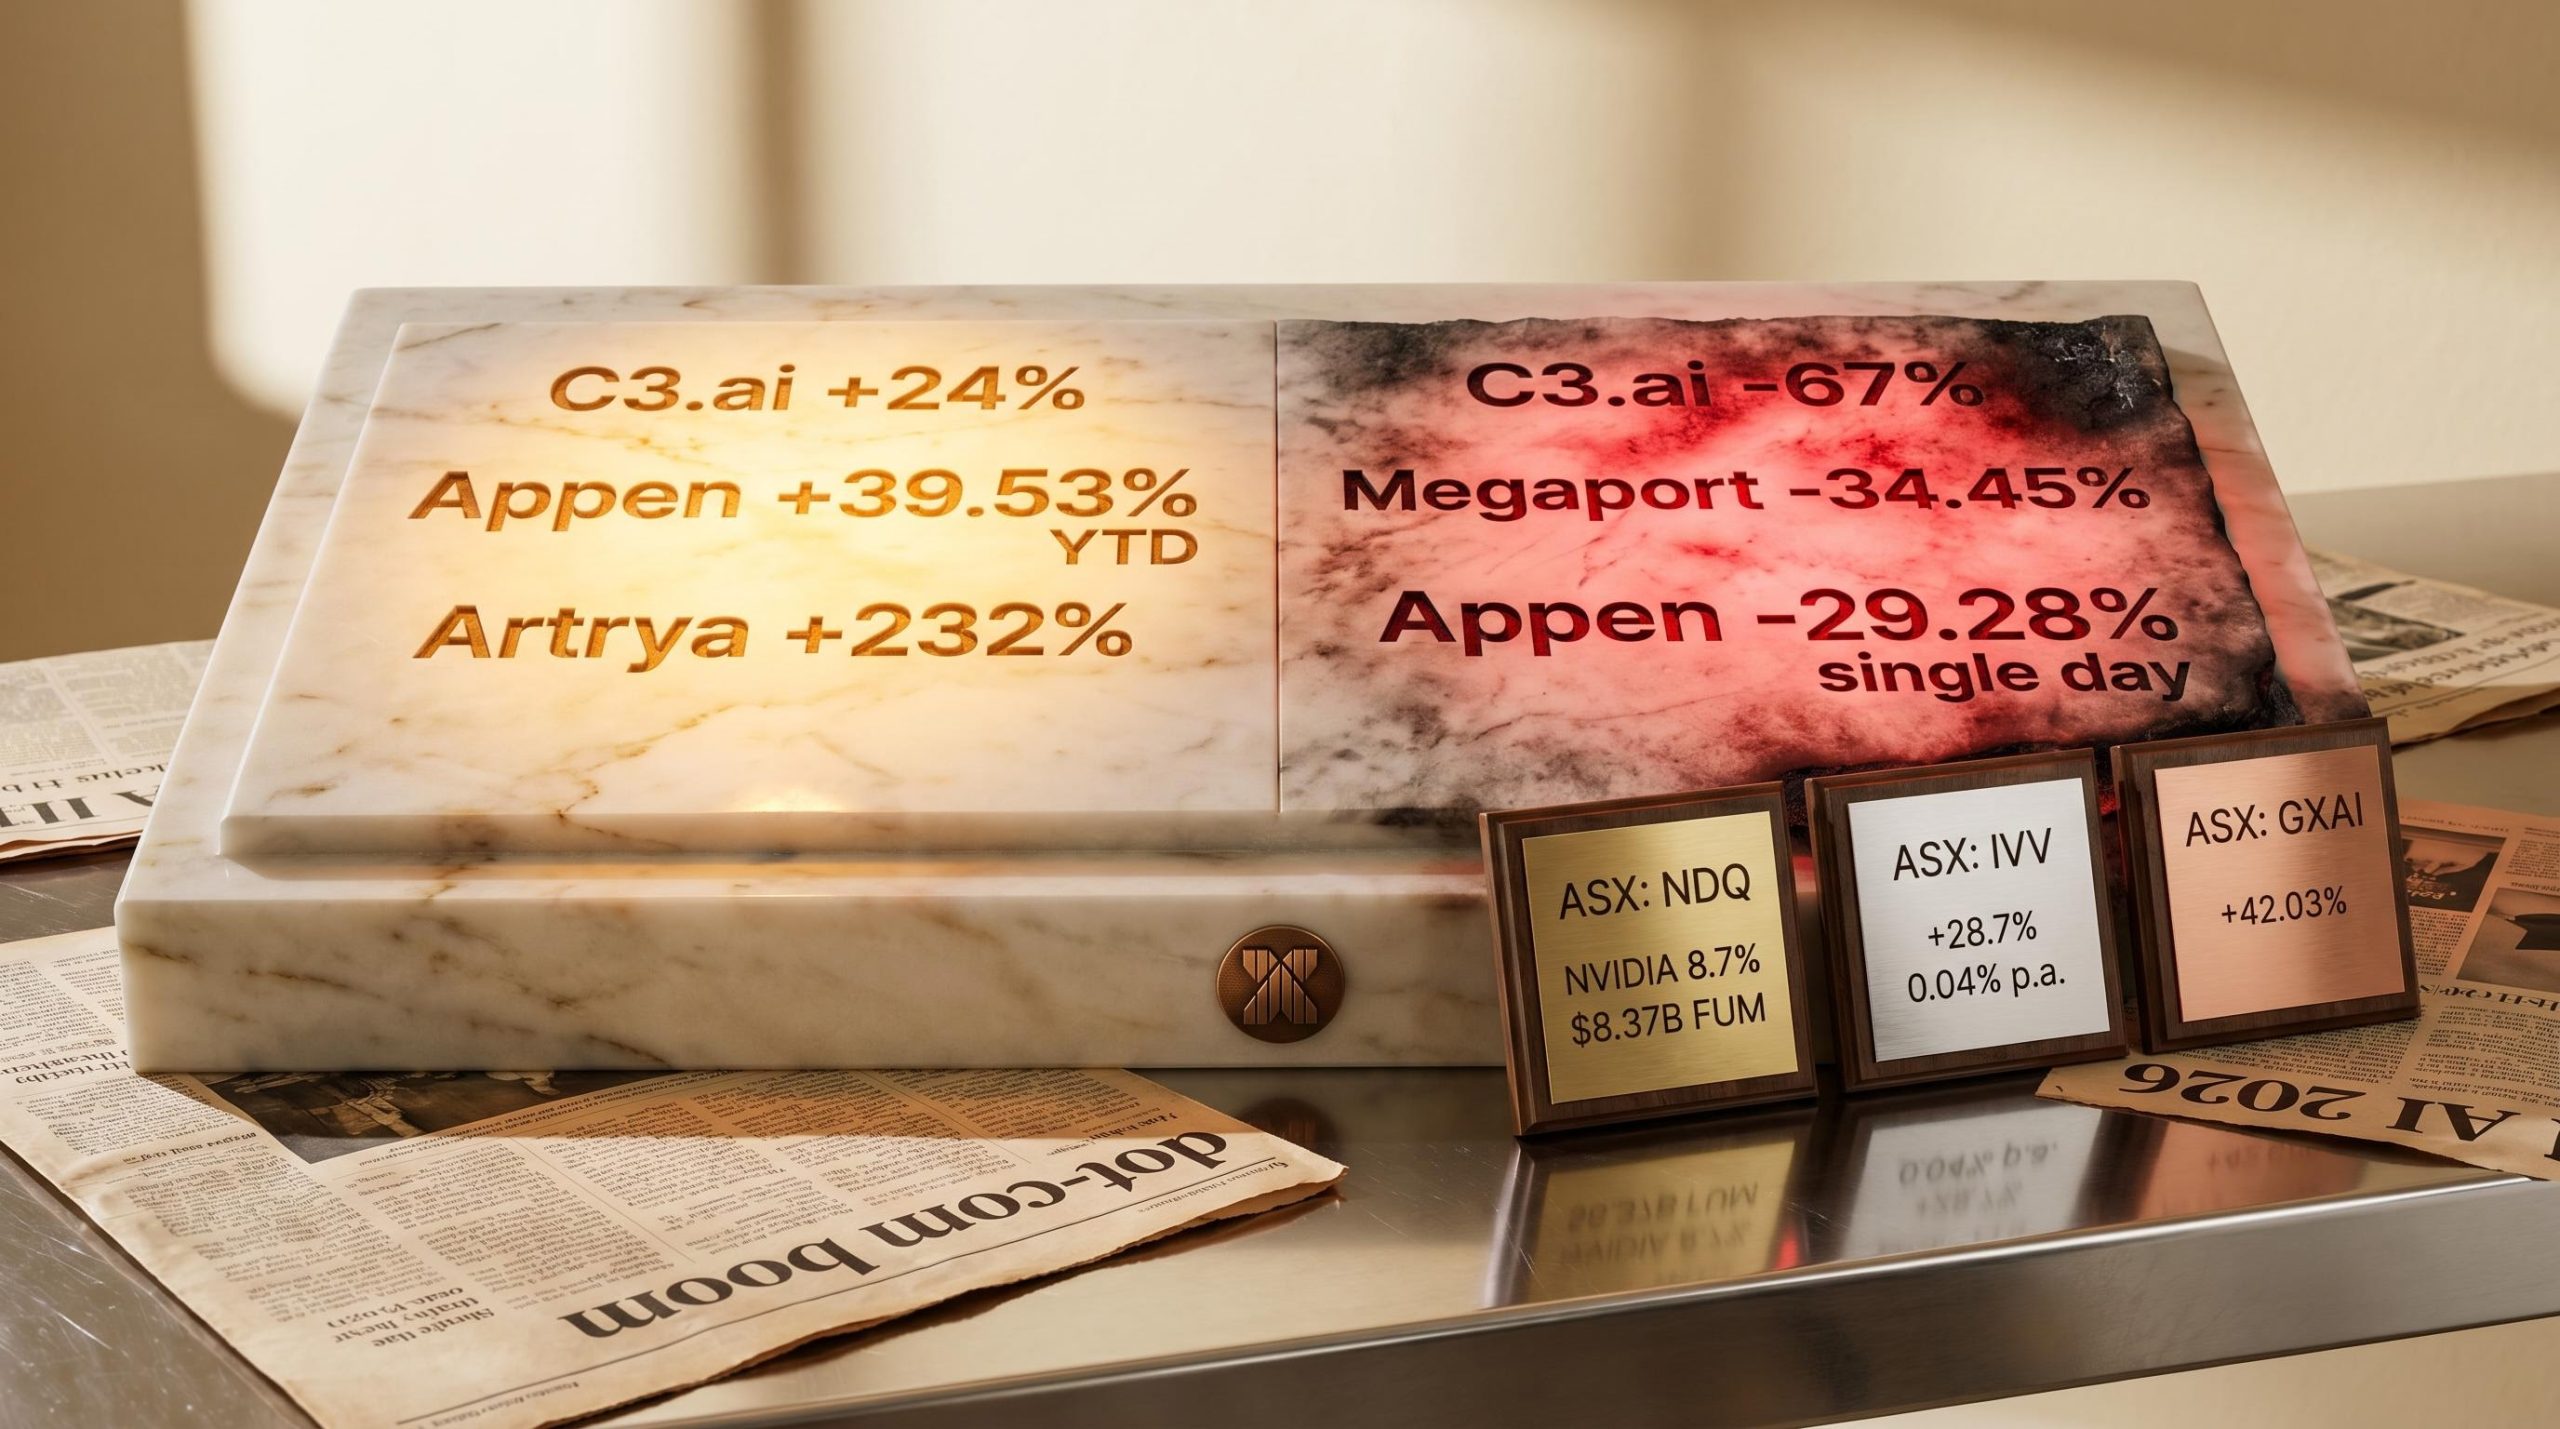
Appen (ASX: APX) recorded a +39.53% YTD gain to 8 May 2026, a figure that obscures what happened along the way: a +30.7% single-day surge on 30 January, followed by a -29.28% drop on 30 April. Megaport (ASX: MP1) fell -19.96% YTD, with a -34.45% decline over six months to the same date.
NextDC (ASX: NXT) offered relative stability at +17.94% YTD, illustrating that not all ASX AI plays are equally volatile. Artrya (ASX: AYA), at the speculative end, recorded a +232% YTD gain in 2026 before significant pullbacks. The range of outcomes is wide enough to be its own argument.
NVIDIA (NVDA) gained +34.8% in seven weeks during mid-2025, then corrected -11.3% in Q1 2026. C3.ai (AI) peaked at +24% from May 2025, then collapsed -67% by 7 May 2026.
Australian investors access these stocks via CHESS-sponsored trading, meaning currency fluctuations and settlement timing add further layers to already significant stock-specific volatility.
| Stock / Ticker | Peak Gain | Subsequent Drawdown | Period |
|---|---|---|---|
| Appen (ASX: APX) | +39.53% YTD | -29.28% single day (30 Apr) | Jan-May 2026 |
| Megaport (ASX: MP1) | N/A | -34.45% over 6 months | Nov 2025-May 2026 |
| NVIDIA (NVDA) | +34.8% in 7 weeks | -11.3% in Q1 2026 | May-Jun 2025 / Q1 2026 |
| C3.ai (AI) | +24% from May 2025 | -67% to May 2026 | May 2025-May 2026 |
These are not isolated events. They are a structural feature of early-stage technology sectors where the market is still repricing uncertainty about which companies will matter long term.
The volatility in the previous section is not random noise. It is a predictable consequence of how capital concentrates in emerging sectors, and the concept that explains it is concentration risk.
Concentration risk compounds at three distinct levels:
Index fund concentration has reached a level that surpasses the 1930s historical peak, with five mega-cap stocks controlling approximately 23% of the broad US market and driving over 70% of Q1 2026 losses before engineering more than half of April’s recovery, amplifying both the upside and the downside of the passive approach in ways that standard diversification arguments do not capture.
NVIDIA at 8.7% of NDQ means that even a passive investor has made a significant bet on a single company, without ever selecting it deliberately.
The “Magnificent 7” dynamic reinforces this pattern. A handful of mega-cap companies drive the majority of technology sector returns, meaning individual stock picks outside this group face an even steeper probability challenge. Concentration risk was also the mechanism behind the worst losses of the dot-com era: investors who allocated heavily to a single “obvious winner” that ultimately failed bore losses from which many portfolios never recovered.
ASIC and the ASX both monitor AI as a dominant thematic trend, but neither has produced specific retail warnings on AI stock losses, suggesting the regulatory safety net is not particularly granular in this area. The responsibility for managing concentration sits with the individual investor.
ASIC’s MoneySmart investment warnings specifically caution retail investors against allocating capital to trending sectors based on news or social media momentum, a pattern that maps closely onto the enthusiasm-driven concentration risk this analysis describes.
Market-capitalisation weighting is not a passive compromise. It is a mechanism designed to address precisely the identification problem this analysis has outlined.
The logic works in three steps:
An ETF investor in 1999 did not need to know whether Amazon or CDNow would win online retail. The index eventually allocated more weight to the survivor and reduced weight in the failure. The same mechanism applies to AI today.
The honest trade-off: ETFs are unlikely to deliver the returns of correctly identifying a single dominant winner early. They do, however, systematically avoid the catastrophic losses that come from identifying the wrong company.
The structural difference between stocks vs ETFs goes beyond diversification: real 2025 examples show single-stock declines of up to 68.9% wiping out most of a concentrated investor’s capital, while an equivalent decline in a 1% ETF holding produced only a 0.69% portfolio drag, a gap that quantifies the asymmetry the article’s winner-picking framework points to.
| ETF Name / Ticker | 1-Year Return | MER | FUM | AI Concentration |
|---|---|---|---|---|
| iShares S&P 500 (ASX: IVV) | +28.7% | 0.04% p.a. | $6.2 billion | Broad |
| BetaShares Nasdaq 100 (ASX: NDQ) | +24.94% | 0.48% p.a. | $8.37 billion | High-Tech |
| Global X AI & Technology (ASX: GXAI) | +42.03% | 0.57% p.a. | $229.5 million | Dedicated AI |
Returns are to 30 April 2026 for IVV and NDQ, and 6 May 2026 for GXAI. GXAI’s higher one-year return comes with a more concentrated, thematic mandate and a significantly smaller FUM base, reflecting a different risk profile. Past performance does not guarantee future results, and these returns are subject to market conditions and various risk factors.
The choice between ASX-domiciled ETFs and direct US stock trading carries tax implications that affect net returns.
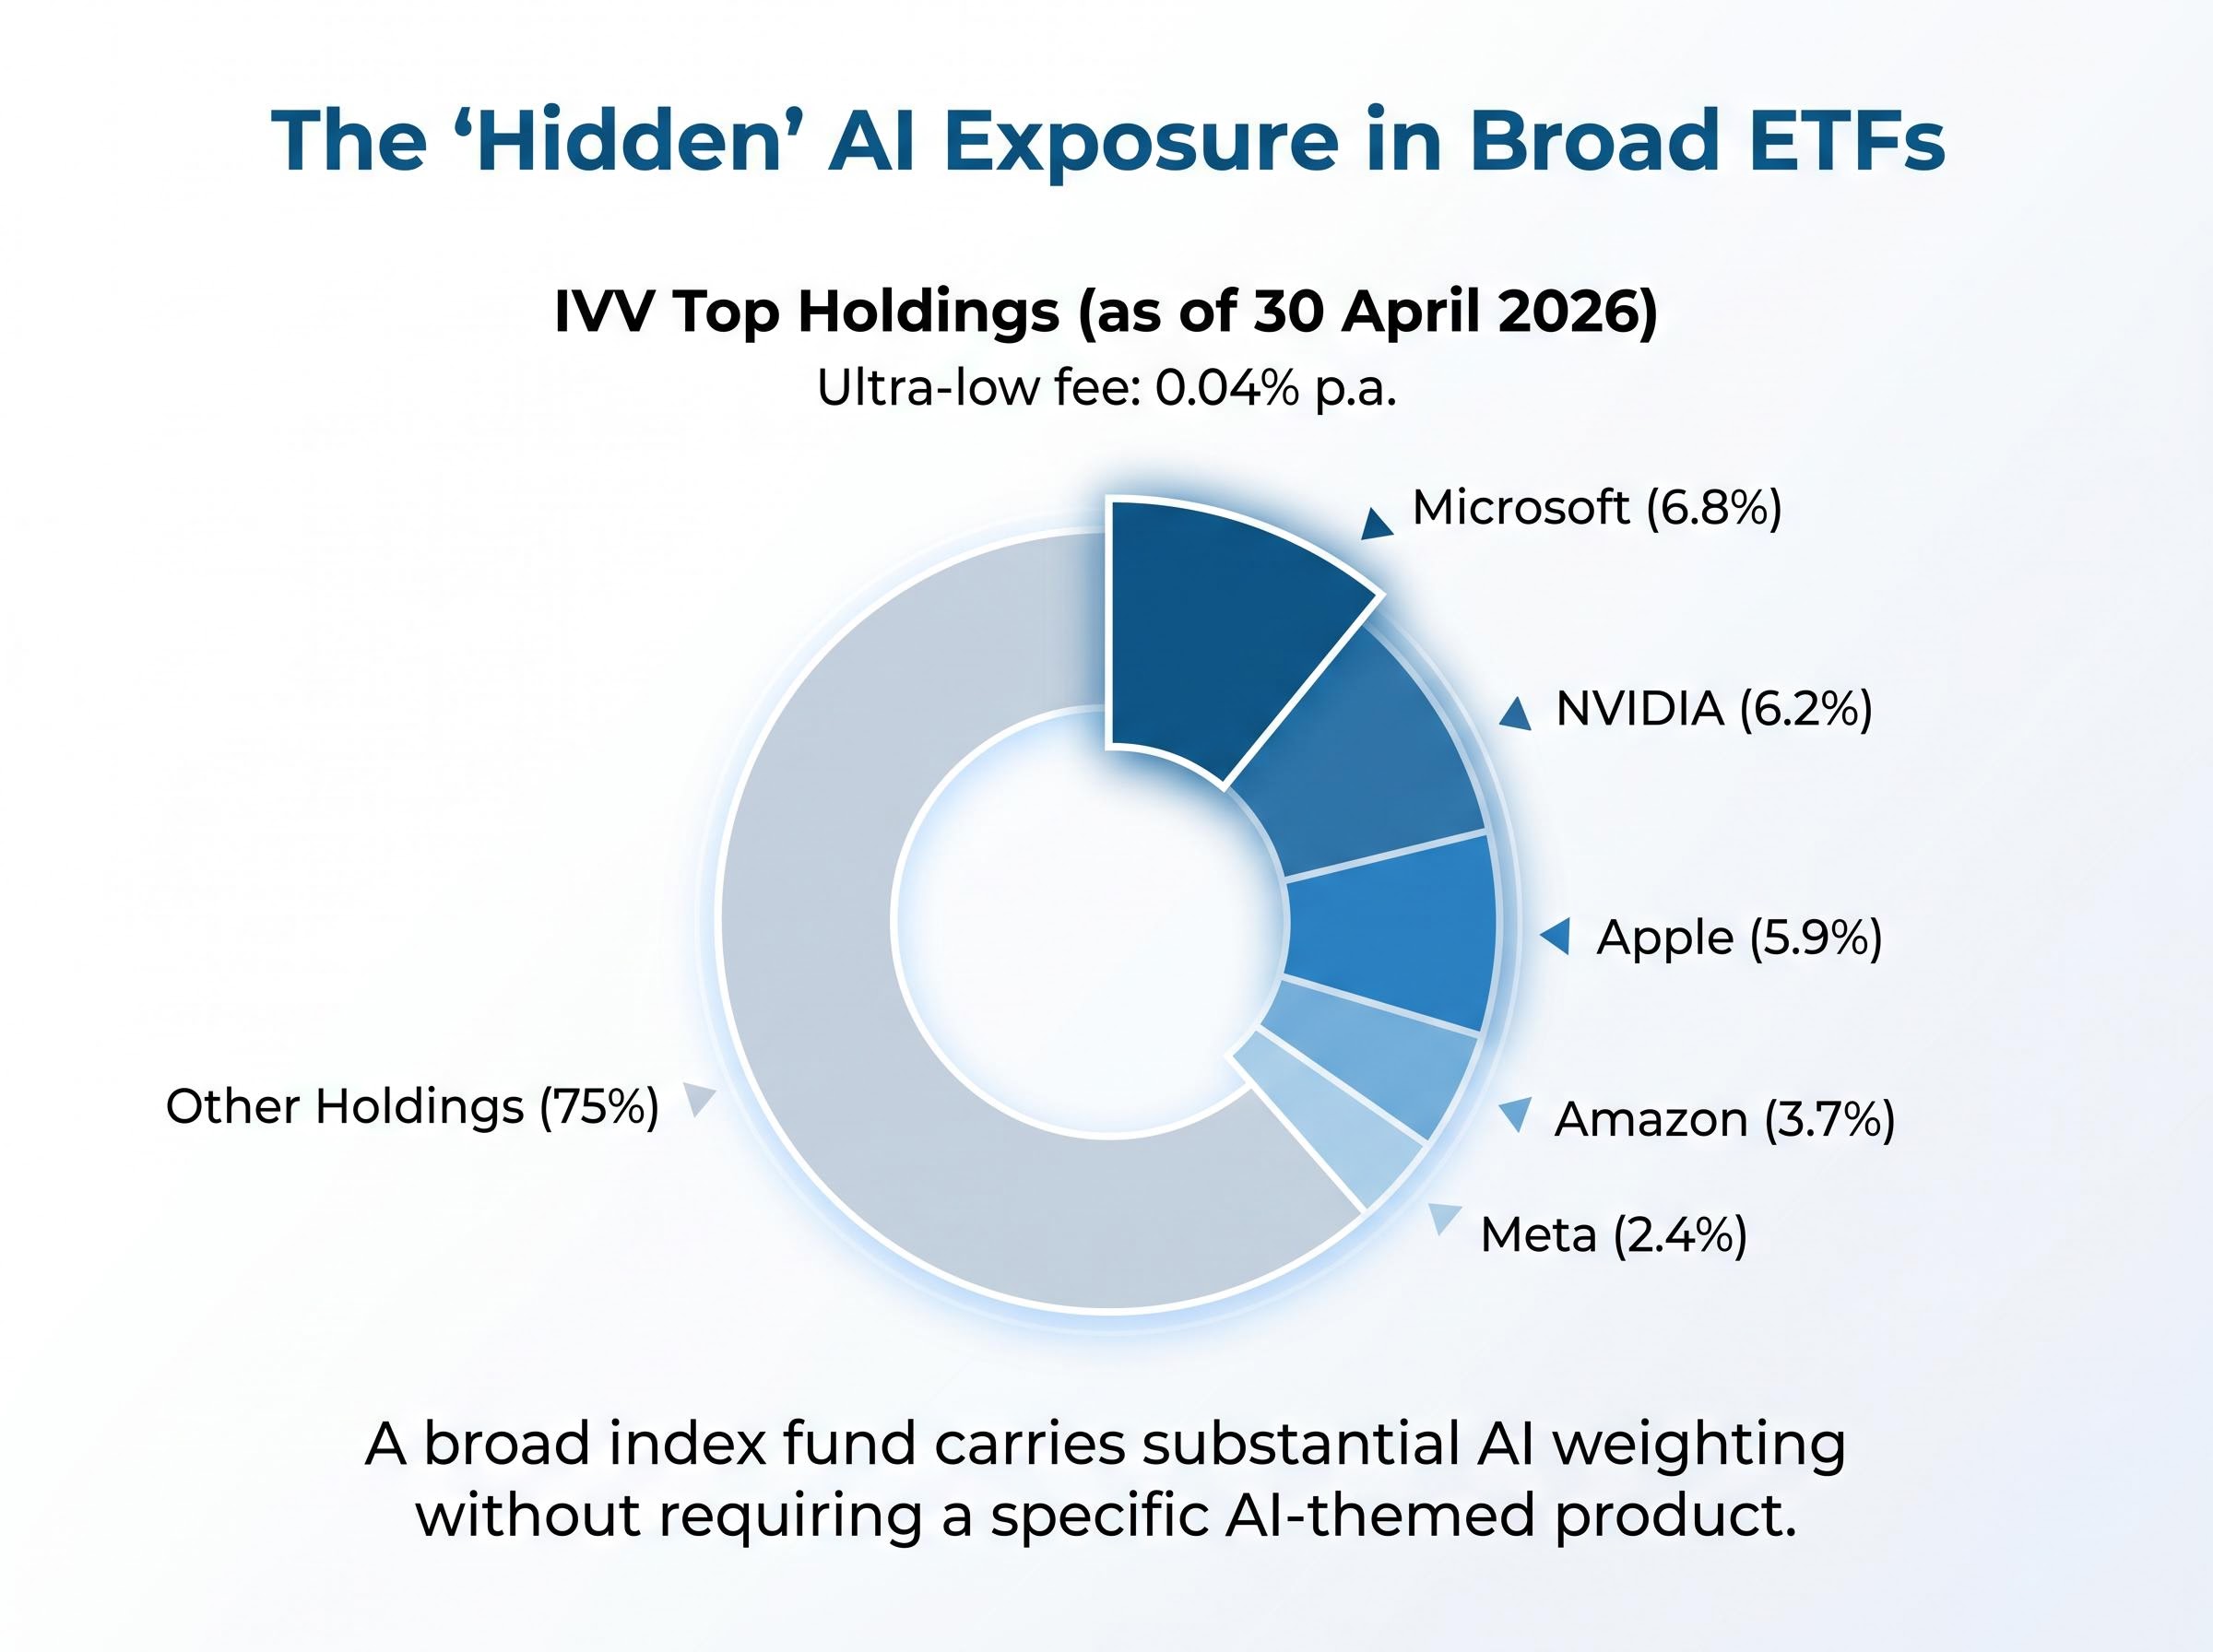
The cost differential between broad and targeted exposure is worth noting. IVV charges 0.04% per annum compared with GXAI at 0.57%, a 14-times difference in annual fee drag on the same invested capital. IVV’s top holdings already include Microsoft at 6.8%, NVIDIA at 6.2%, Apple at 5.9%, Amazon at 3.7%, and Meta at 2.4% as of 30 April 2026. A broad index fund carries substantial AI weighting without requiring a specific AI-themed product.
Dollar-cost averaging (DCA), the practice of investing a fixed amount at regular intervals rather than in a single lump sum, is specifically suited to sectors exhibiting the volatility outlined earlier. When stocks swing 30% in a single day, entry timing becomes a lottery. DCA removes that timing pressure.
Fund issuers including BetaShares recommend this approach when building positions in volatile technology indices like the Nasdaq 100.
For Australian investors wanting to build out the mechanics of this approach, dollar-cost averaging on the ASX creates a separate CGT parcel for each purchase, a tax consequence that is easy to overlook but which shapes the record-keeping requirements and the after-tax return calculation across a multi-year position-building programme in volatile technology indices.
The risk is not that AI fails as a technology. The risk is that the companies currently considered frontrunners may not be the ones that matter in 2036. Amazon and Alphabet were not obvious survivors in 1999. Today’s equivalent may not be obvious either.
The distinction that matters is between the technology being genuinely capable of reshaping industries and any specific company capturing that shift over the long term. These are two separate questions with two separate probability profiles.
Some investors will still want individual stock exposure, and that is a legitimate choice if made with full awareness of the concentration risk rather than enthusiasm-driven conviction. For investors who accept the identification problem, the ETF approach is not timidity. It is the structurally intelligent response to a selection challenge that defeated sophisticated investors during the dot-com era.
The framework reduces to three questions:
The companies with the largest AI weightings in current ETFs, NVIDIA at 8.7% of NDQ and Microsoft at 6.8% of IVV, are already the passive investor’s largest bets. No single active selection decision was required to hold them.
This article is for informational purposes only and should not be considered financial advice. Investors should conduct their own research and consult with financial professionals before making investment decisions.
Concentration risk in AI investing means your portfolio returns are heavily dependent on a small number of companies. Even in a diversified ETF like BetaShares NDQ, a single stock like NVIDIA can account for 8.7% of the fund, giving passive investors significant single-stock exposure without making an active choice.
Australian investors can access AI exposure through ASX-listed ETFs such as iShares S&P 500 (IVV), BetaShares Nasdaq 100 (NDQ), and Global X AI and Technology (GXAI), or by trading individual AI stocks directly via CHESS-sponsored accounts for US-listed names like NVIDIA and C3.ai.
Dollar-cost averaging means investing a fixed amount at regular intervals rather than in a single lump sum, which reduces the impact of entry timing in highly volatile sectors. Given that some ASX AI stocks have swung 30% in a single day, DCA removes the pressure of trying to time the market correctly.
Performance varied widely: Appen (ASX: APX) surged 30.7% in a single day in January 2026 but then dropped 29.28% on 30 April, while Megaport (ASX: MP1) fell 34.45% over six months and Artrya (ASX: AYA) recorded a 232% YTD gain before significant pullbacks, illustrating the extreme range of outcomes in the sector.
Gains on both individual AI stocks and ETFs are taxed at marginal rates of 15% to 45%, with a 50% CGT discount available for assets held longer than 12 months. ASX-domiciled ETFs may also distribute franking credits, an advantage that is lost when trading US-listed stocks directly through CHESS-sponsored accounts.