Stock-Bond Correlation Hits 30-Year Extreme, Rattling 60/40 Investors
13 hrs ago

One stock out of 210. That is all it took to account for more than a quarter of every dollar of wealth created across Australia’s largest listed companies over 15 years. A Morningstar Australia analysis by Mark LaMonica, CFA, covering the 210 largest ASX-listed companies over the 15-year period ending approximately April 2026 has quantified something many investors suspect but rarely see in hard numbers: ASX returns are extraordinarily concentrated, brand-name blue chips frequently destroy relative wealth, and the gap between a company’s public profile and its investment performance is often vast. What follows unpacks exactly which companies delivered the best performing ASX shares, which well-known names quietly failed investors, and what the data means for Australian retail investors deciding between stock picking and index exposure.
The dataset is large enough to be meaningful and constrained enough to be honest about its limits. Morningstar Australia drew 210 companies from the roughly 333 largest ASX-listed stocks by current market capitalisation, each with a minimum 15-year return history. That 210 represents just under 15% of the 2,261 ASX-listed shares, meaning this is a study of survivors, not the full market.
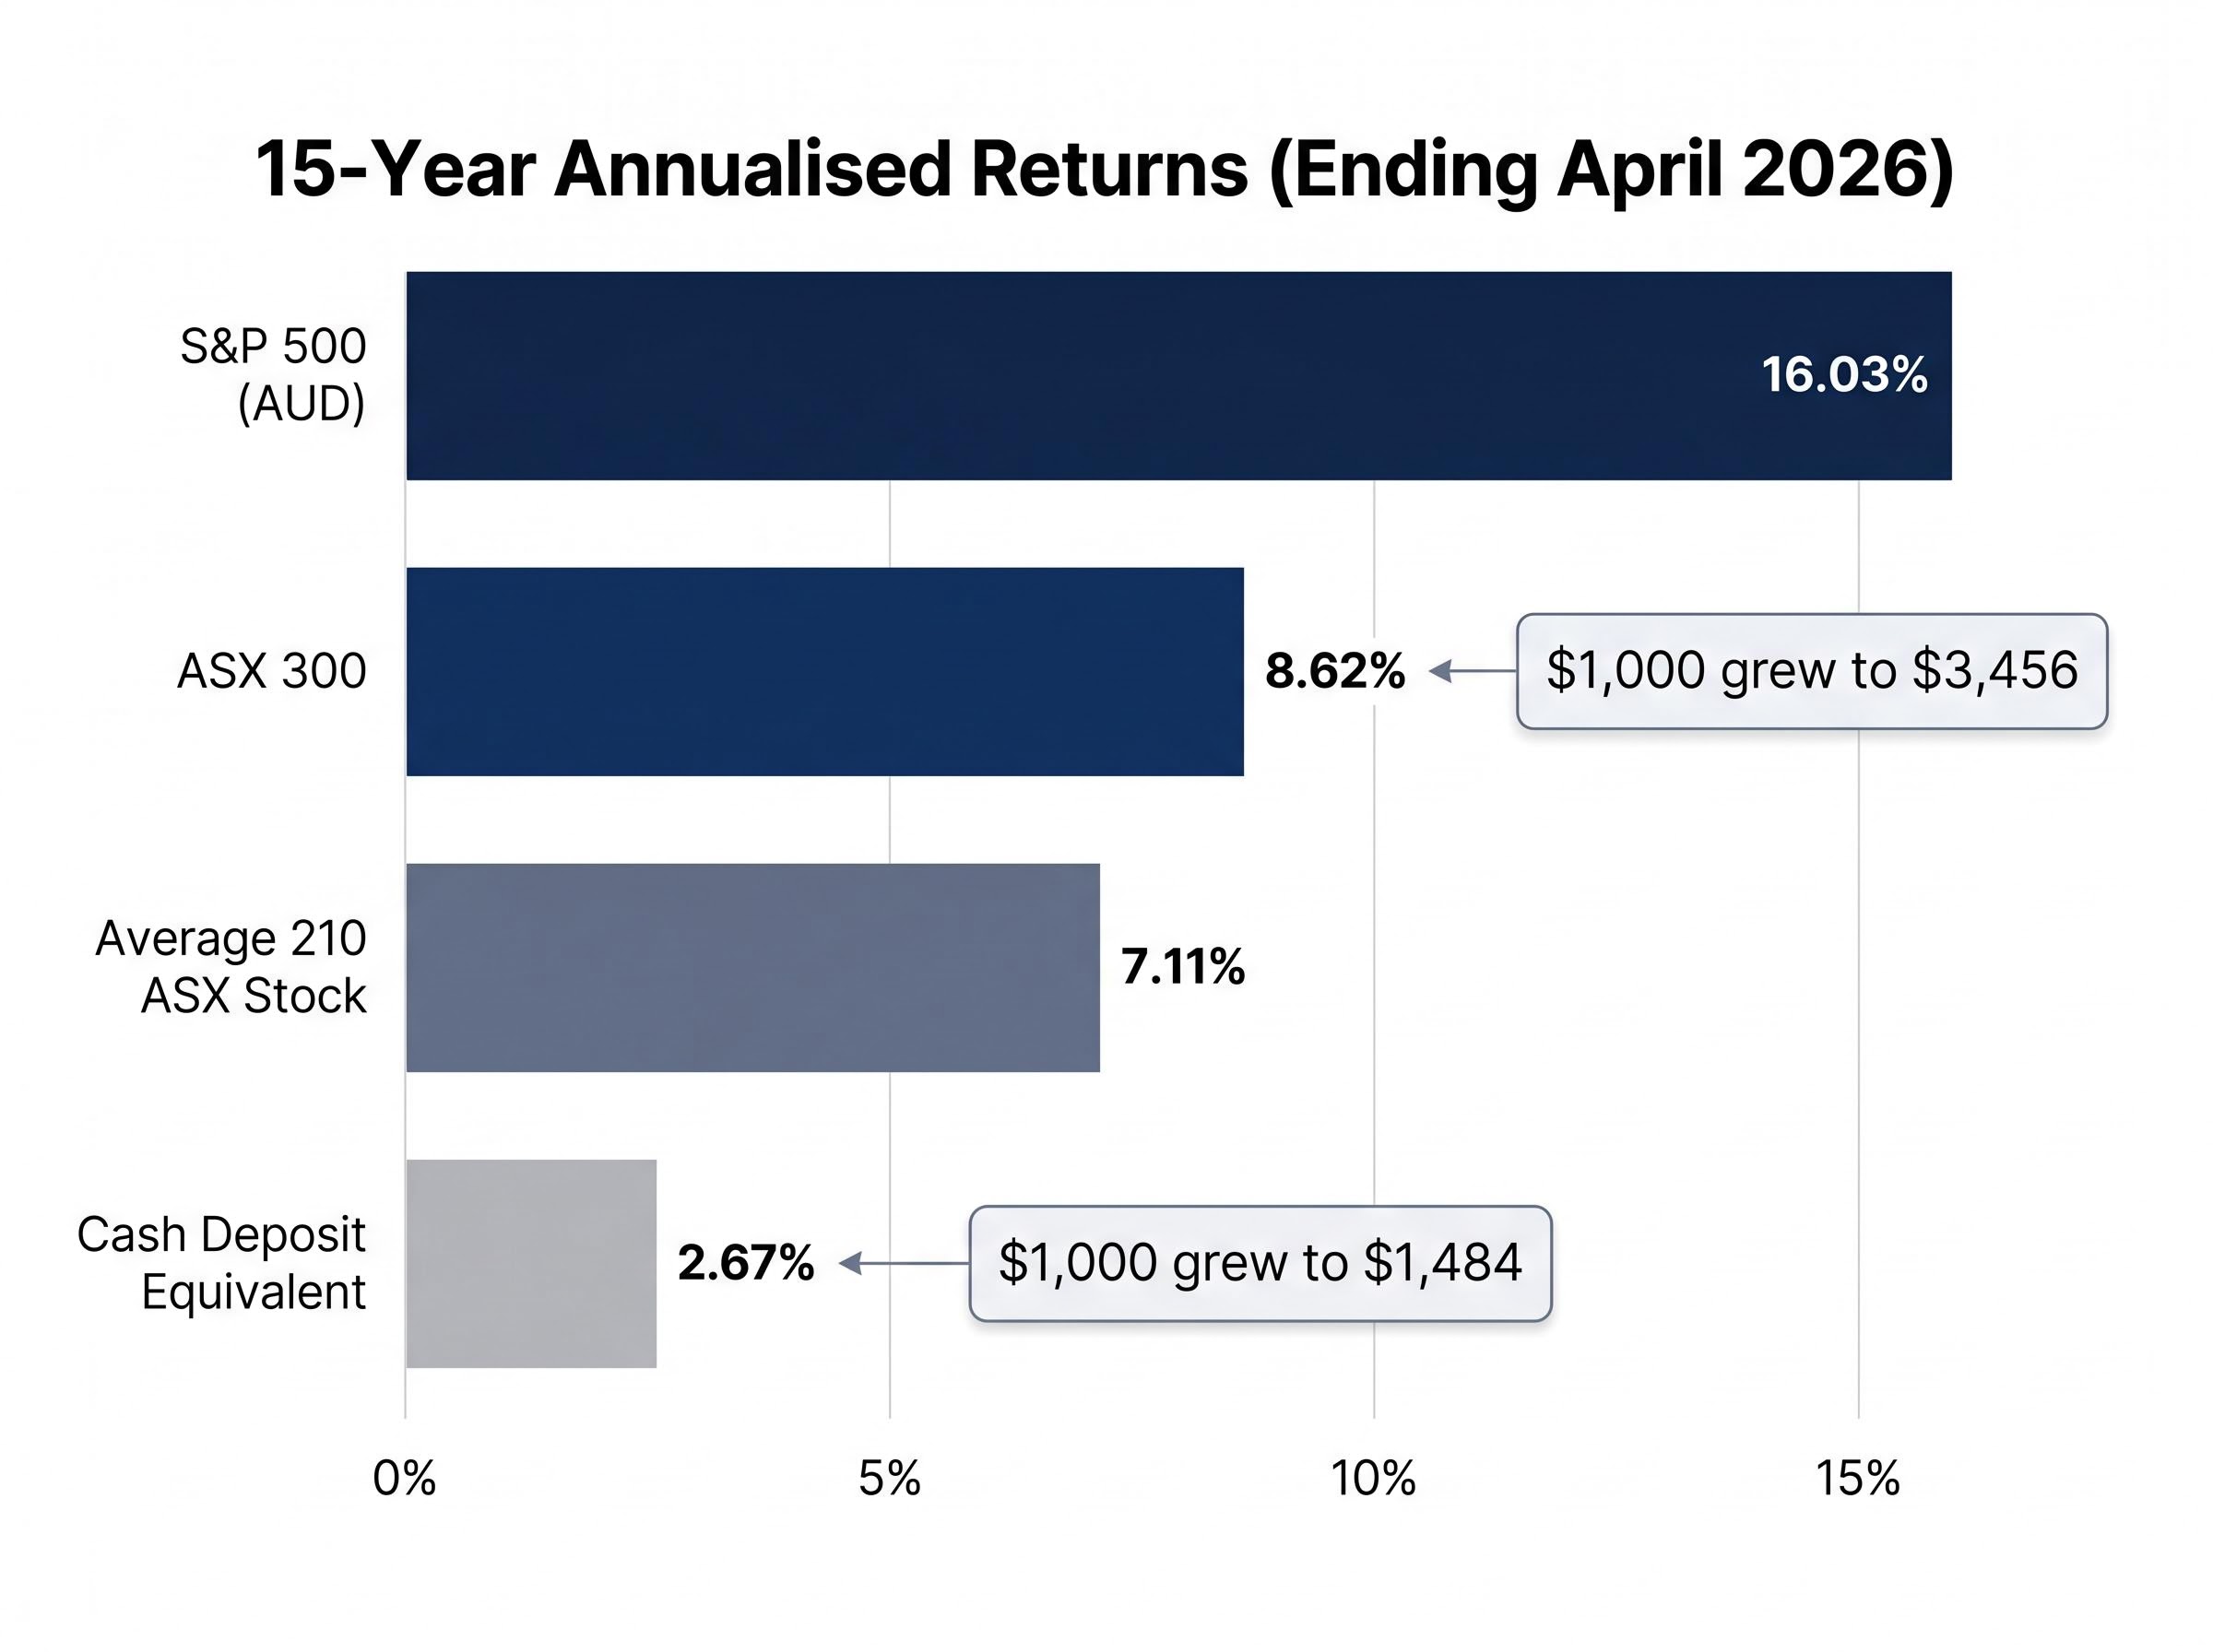
Against that sample, three benchmark figures frame everything that follows:
The average stock trailed the index. That gap, 8.62% versus 7.11%, is the first sign that something structural is at work in ASX return distributions.
123 companies were excluded for lacking a full 15-year history, and the excluded group skews toward underperformers and outright failures. Companies such as Virgin Australia, which collapsed in 2020, do not appear in the dataset at all. The implication is direct: the actual distribution of ASX outcomes is likely worse than these figures suggest.
Franking credits are also excluded from all return figures, which modestly understates total returns for Australian investors. The numbers presented here are pre-franking, meaning the true after-tax benefit of dividend-paying stocks is somewhat higher than shown.
The US academic Hendrik Bessembinder documented a striking finding across decades of American equity data: fewer than half of all US stocks produced a positive lifetime return, and only 41.17% beat the equivalent Treasury bill. The median buy-and-hold return for a US stock was -6.87%, even as the average annual return across the full market sat at 10.10%. That gap between median and average is the signature of extreme positive skew, where a small number of massive winners pull the average far above what a typical stock delivers.
Bessembinder’s Do Stocks Outperform Treasury Bills found that only 42.6% of CRSP common stocks produced lifetime buy-and-hold returns exceeding one-month Treasury bills, and that the best-performing 4% of listed companies explain the entire net gain for the US stock market since 1926, a pattern the Morningstar Australia data now mirrors on the ASX.
The Morningstar Australia data reveals the same pattern on the ASX.
Only 36% of Australia’s largest listed companies beat the ASX 300 over 15 years. The true proportion, adjusted for survivorship bias, is almost certainly lower.
More than 72% of the dataset exceeded the cash equivalent return, so most stocks did generate positive real returns. The problem is relative: most stocks did not keep pace with a simple index fund.
The ASX and US findings sit side by side:
Market capitalisation-weighted index construction effectively removes the drag from the worst performers. As a company’s share price falls, its index weighting shrinks, reducing its influence on total returns. This is a structural advantage rarely appreciated by retail investors who hold fixed positions in individual stocks regardless of price trajectory.
A reader new to the passive versus active debate may find it useful to ground the numbers in what index fund ownership actually means at the portfolio level: a single broad ETF unit provides simultaneous exposure to hundreds of underlying companies, with the cap-weighting mechanism automatically reducing the weight of falling stocks and increasing the weight of rising ones.
A hypothetical equal-weighted portfolio of $1,000 in each of the 210 stocks, totalling $210,000, grew to approximately $1.8 million over 15 years. The gains were not evenly distributed. The top ten stocks generated 56% of total wealth across the entire 210-company dataset.
Then the concentration narrows further.
Pro Medicus (ASX: PME) alone accounted for approximately 27% of all wealth created across the full dataset. One company, out of 210, generated more than a quarter of the total dollar gains.
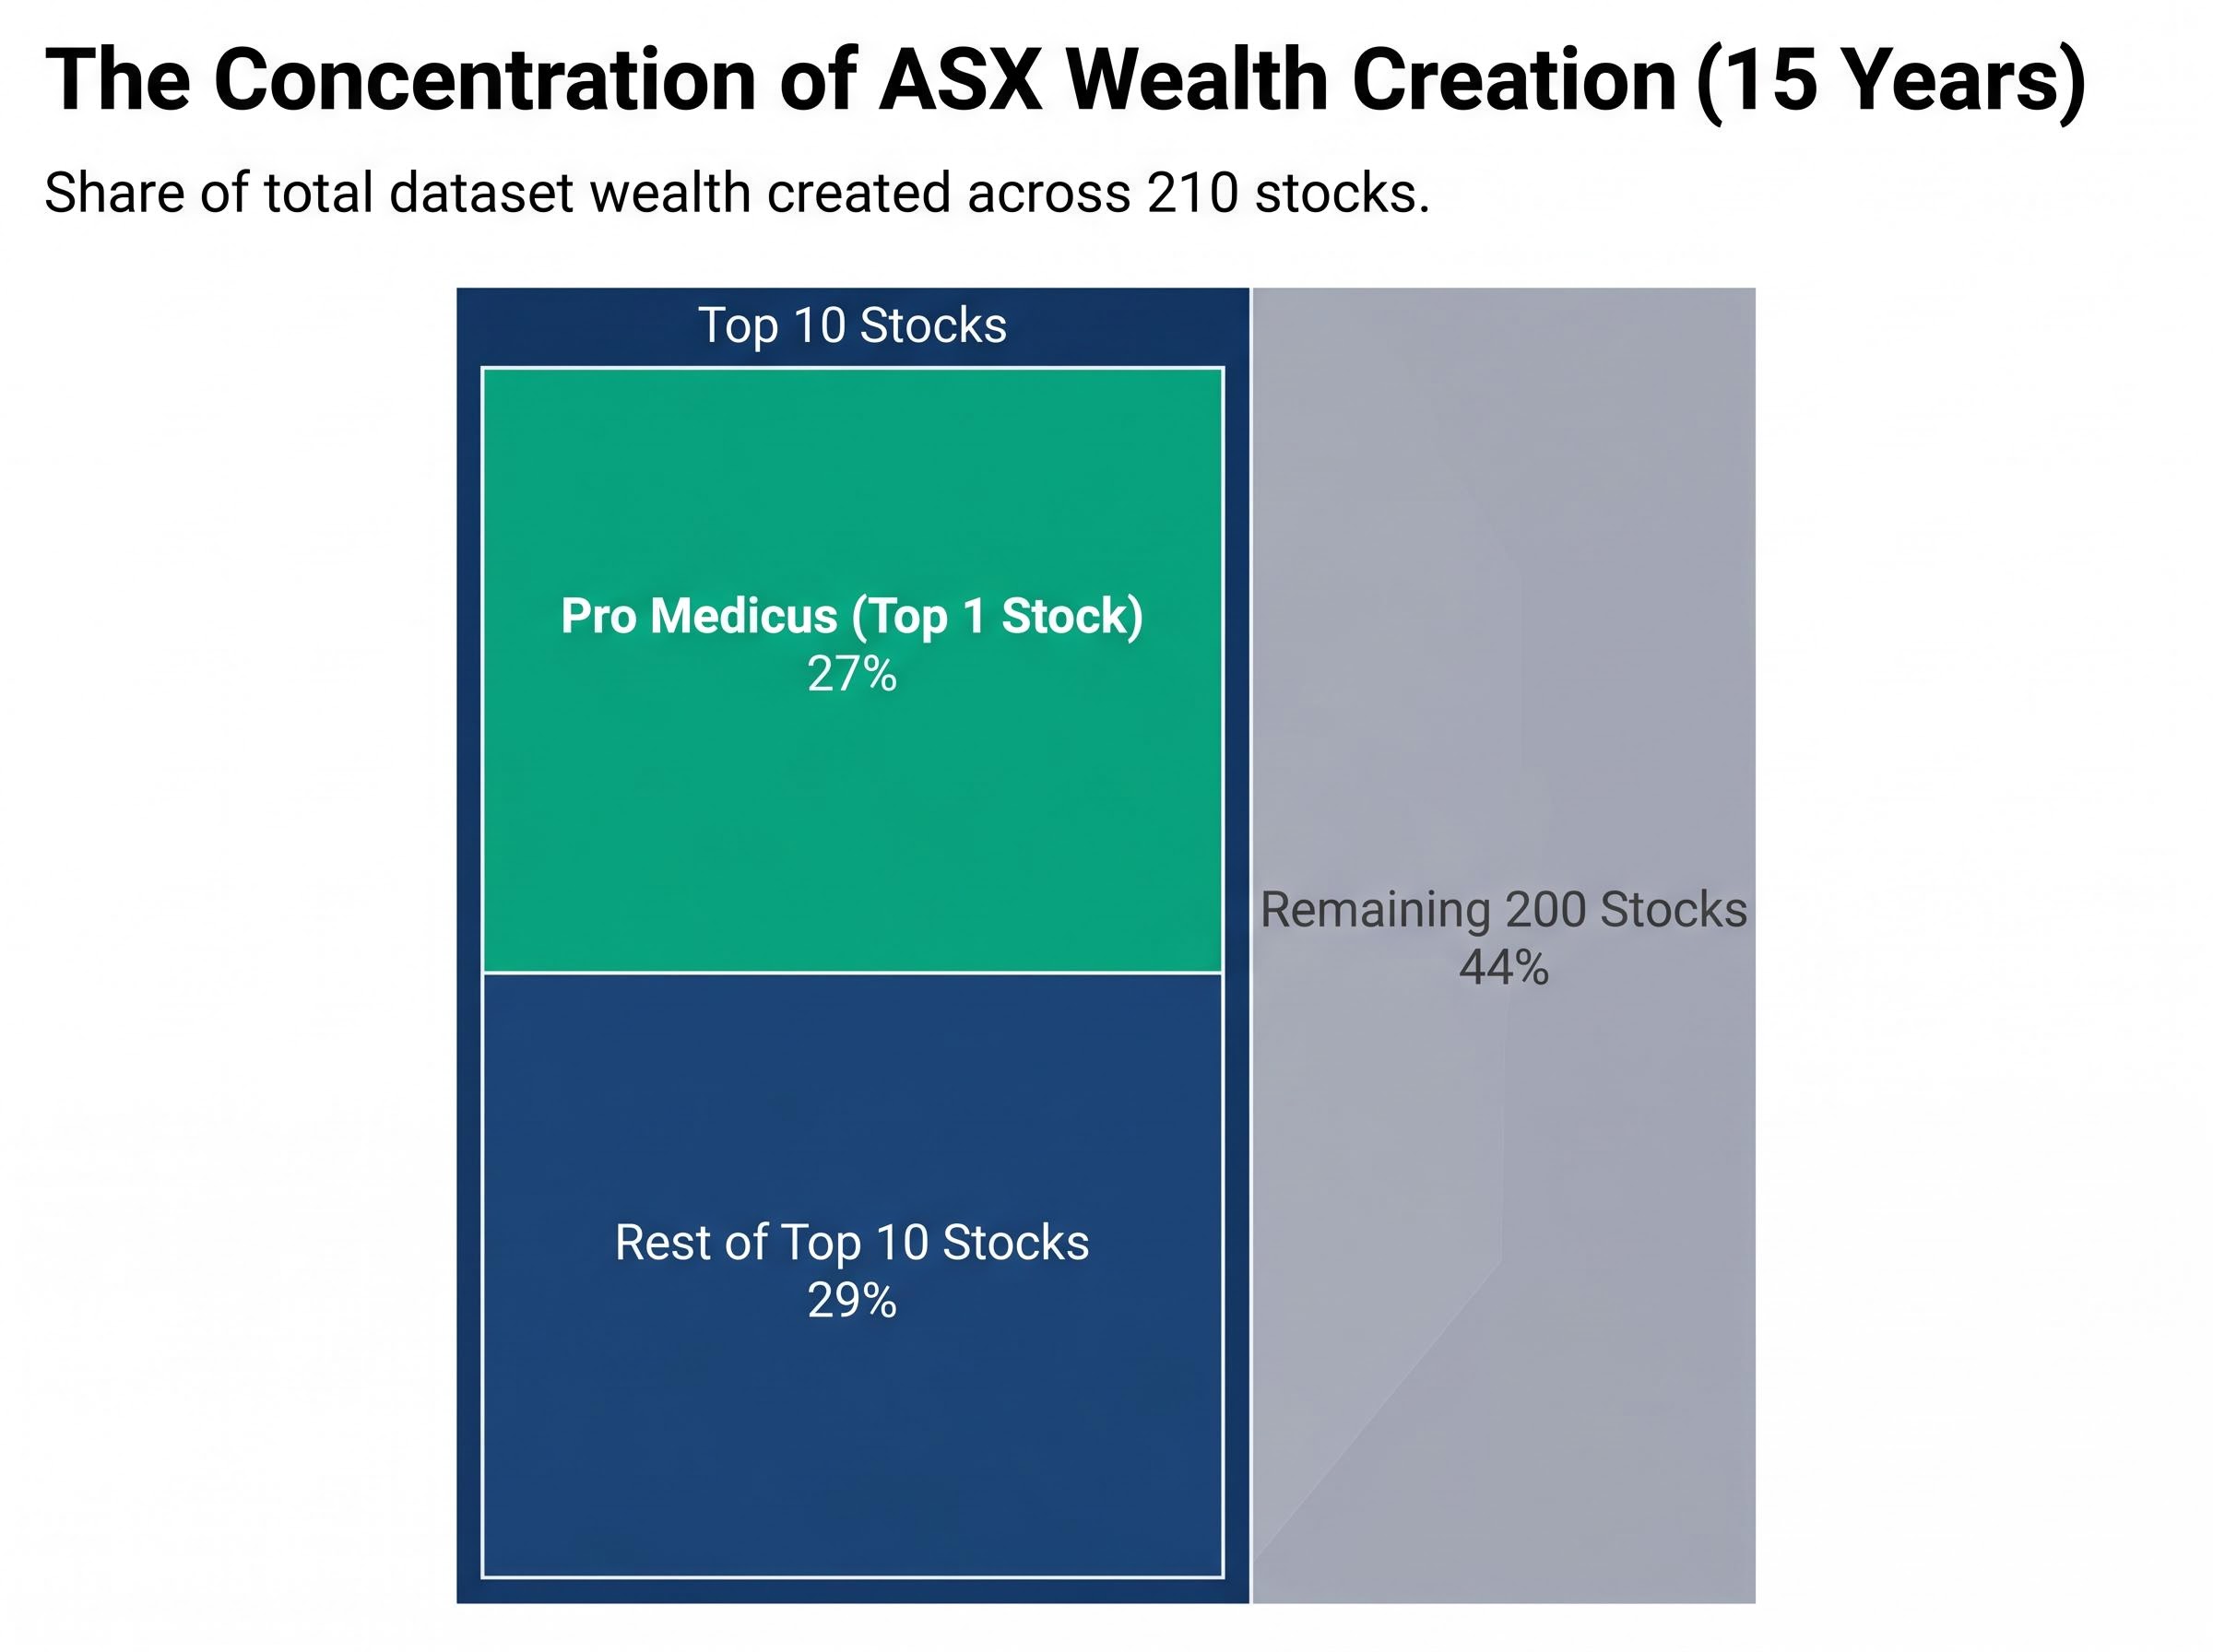
| Stock group | Share of total dataset wealth created |
|---|---|
| Top 1 stock (Pro Medicus) | 27% |
| Top 10 stocks | 56% |
| Remaining 200 stocks | 44% |
The operational model explains the compounding. Pro Medicus operates a radiology imaging software platform with recurring SaaS-style revenue, gross margins of 99.8%, and a debt-free balance sheet carrying net cash of $210.7 million. FY2025 net profit reached $115.2 million, up 39% from FY2024. From FY2023 to FY2025, the two-year profit compound annual growth rate (CAGR) was approximately 92.6%.
Holding through that compounding, however, required tolerance for severe drawdowns. Monthly returns over the 15-year period ranged from -37.22% to +50.52%. In April 2026, Fairmont Equities issued a SELL rating on PME, citing ongoing rotation out of technology stocks amid elevated rates and valuation risk.
The stock that an investor had to own to outperform the index by the widest margin was not the most comfortable or obvious choice at any point in those 15 years, and its current valuation remains actively contested.
The two sectors that dominate ASX index composition, banking and mining, are also the sectors where most individual stocks failed to beat that same index over 15 years.
Among the major banks, only Macquarie and Commonwealth Bank of Australia (CBA) outperformed the ASX 300’s 8.62% annualised benchmark. ANZ, NAB, and Westpac all trailed it.
Among the major miners, only Fortescue outperformed. BHP and Rio Tinto both fell short.
| Company | Sector | Beat ASX 300 over 15 years |
|---|---|---|
| CBA | Banks | Yes |
| Macquarie | Banks | Yes |
| ANZ | Banks | No |
| NAB | Banks | No |
| Westpac | Banks | No |
| Fortescue | Mining | Yes |
| BHP | Mining | No |
| Rio Tinto | Mining | No |
The S&P 500 returned 16.03% annualised in Australian dollar terms over the same 15-year period, against the ASX 300’s 8.62%. Banking and mining underperformance is cited as a key structural driver of that gap.
BHP’s +30.89% year-to-date gain in 2026 fits within a near-term sector rotation toward hard assets, not a reversal of its long-term compounding record. Investors who built portfolios around household ASX names in banking and mining, the stocks most commonly held in self-managed super funds, systematically underperformed a simple index fund. That gap compounds into a meaningful difference over 15 years.
The underperformance of ANZ, NAB, and Westpac against the ASX 300 does not mean these stocks delivered nothing to shareholders: ASX dividend investing built around franking credits can produce grossed-up yields materially above the headline cash yield, and the income return from fully franked bank dividends has historically offset some of the capital return shortfall relative to the index.
Energy Resources of Australia recorded the worst 15-year annualised return in the dataset: approximately -25%. That figure persisted despite the stock’s share price nearly doubling in the 12 months before the analysis. A single year of strong performance, in other words, did not come close to reversing 15 years of destruction.
The dataset excludes outright failures, meaning -25% annualised is the floor visible in survivorship-biased data, not the true floor of ASX outcomes.
Three observations emerge from the bottom of the distribution:
The index’s advantage is not just about capturing the winners. It is about systematically reducing exposure to the severe losers.
Beating the ASX index requires either holding one or more of the rare extreme outperformers or avoiding the disproportionate losers. Most retail investors do neither systematically.
The data points converge on a consistent implication:
According to Morningstar’s LaMonica, a clearly articulated selection strategy is the minimum precondition for rational individual stock investing. Without one, the distribution of outcomes favours passive exposure.
The 15-year return gap between the ASX 300 and the S&P 500, 8.62% versus 16.03% in Australian dollar terms, raises a separate but related question for Australian investors: whether geographic diversification, not just stock selection, is the more consequential portfolio decision.
Index concentration risk is not unique to the ASX: the US market’s cap-weighted benchmark is currently dominated by five mega-cap stocks controlling roughly 23% of the index, a structural parallel that matters directly for Australian investors deciding whether geographic diversification through a US index fund actually reduces the concentration problem or replicates it at a different scale.
This article is for informational purposes only and should not be considered financial advice. Investors should conduct their own research and consult with financial professionals before making investment decisions. Past performance does not guarantee future results.
Return concentration is not a US anomaly. It is a feature of the Australian market, and the Morningstar data suggests it is more extreme than most investors assume. 36% of Australia’s largest listed companies beat the index. One stock generated 27% of all wealth created. The household names in banking and mining mostly trailed a passive fund.
Three groups of investors face different readings of this data. Index holders can take comfort that the structural mathematics favour their approach. Blue-chip stock pickers concentrated in banks and miners face a 15-year record that challenges the assumption that familiarity equals quality. Investors chasing recent outperformers face the Energy Resources of Australia reminder: a strong recent year can coexist with a catastrophic long-term record.
The data does not prescribe what to do. It clarifies what the distribution of outcomes looks like, so investors can decide with clear eyes.
Investors who have reviewed the 15-year return data and concluded that broad index exposure is their preferred starting point will find our dedicated guide to building a starter ASX ETF portfolio useful: it walks through three specific ETFs covering Australian equities, global developed markets, and technology growth, with allocation logic and brokerage cost considerations for positions as small as AU$500.
Return concentration means that a tiny number of stocks generate the vast majority of market gains. On the ASX, just 10 stocks out of 210 generated 56% of total wealth created over 15 years, meaning investors who missed those winners were likely to underperform a simple index fund.
According to a Morningstar Australia analysis covering 210 large ASX-listed companies, only 36% outperformed the ASX 300's annualised return of 8.62% over the 15-year period ending approximately April 2026, and the true proportion is likely lower once survivorship bias is accounted for.
Pro Medicus (ASX: PME) was the standout performer, accounting for approximately 27% of all wealth created across the 210-stock dataset, driven by its radiology imaging software platform, near-100% gross margins, and a two-year profit CAGR of approximately 92.6% from FY2023 to FY2025.
Most did not. Among the big banks, only CBA and Macquarie outperformed the ASX 300, while ANZ, NAB, and Westpac all trailed it. Among major miners, only Fortescue beat the benchmark, with BHP and Rio Tinto both falling short.
Survivorship bias means that companies which failed or were delisted, such as Virgin Australia, are excluded from long-term datasets, making the average returns appear better than they truly are. The Morningstar study excluded 123 companies for lacking a full 15-year history, and that excluded group skews toward underperformers and outright failures.