How to Value Stocks When the Future Looks Nothing Like Today
24 mins ago

Tesla‘s stock currently trades at roughly 360x trailing earnings, yet analysts disagree on its fair value by a factor of 24 to 1, from $25 to $600. That spread is not a data problem. It is a valuation problem, and it is precisely what stock valuation analysis is designed to navigate.
When a company is in transition, standard valuation shortcuts break down. Price-to-earnings multiples lose meaning when earnings are depressed. Revenue growth projections become the entire argument. The price an investor pays at entry stops being a footnote and becomes the single most consequential variable in the outcome.
This guide uses Tesla‘s Q1 2026 valuation as a working case study to teach a durable framework for analysing any company whose stock price is pricing in a transformation that has not yet happened. Readers will finish with a concrete process for building bull and bear scenarios, stress-testing assumptions, and understanding what the entry price they pay actually implies about expected returns.
Most investors treat valuation as a lookup exercise. Find the price-to-earnings ratio. Compare it to the sector average. Decide whether the stock is cheap or expensive. The process works well enough for a mature business generating steady earnings, but it fails precisely when the stakes are highest: when a company is deliberately suppressing near-term profits to fund a transformation into something entirely different.
Consider the numbers. Ford trades at roughly 11x earnings. GM trades at approximately 5x. Those multiples reflect mature automotive businesses generating predictable cash flows. Even Nvidia, the most valuable AI-adjacent company on the planet, trades at roughly 55x earnings, a premium that reflects proven, accelerating AI revenue. Tesla, at approximately 360x trailing earnings, sits in a different category altogether. Its Price/Sales ratio of 14.16x versus traditional auto peers at 0.3-0.5x confirms the gap.
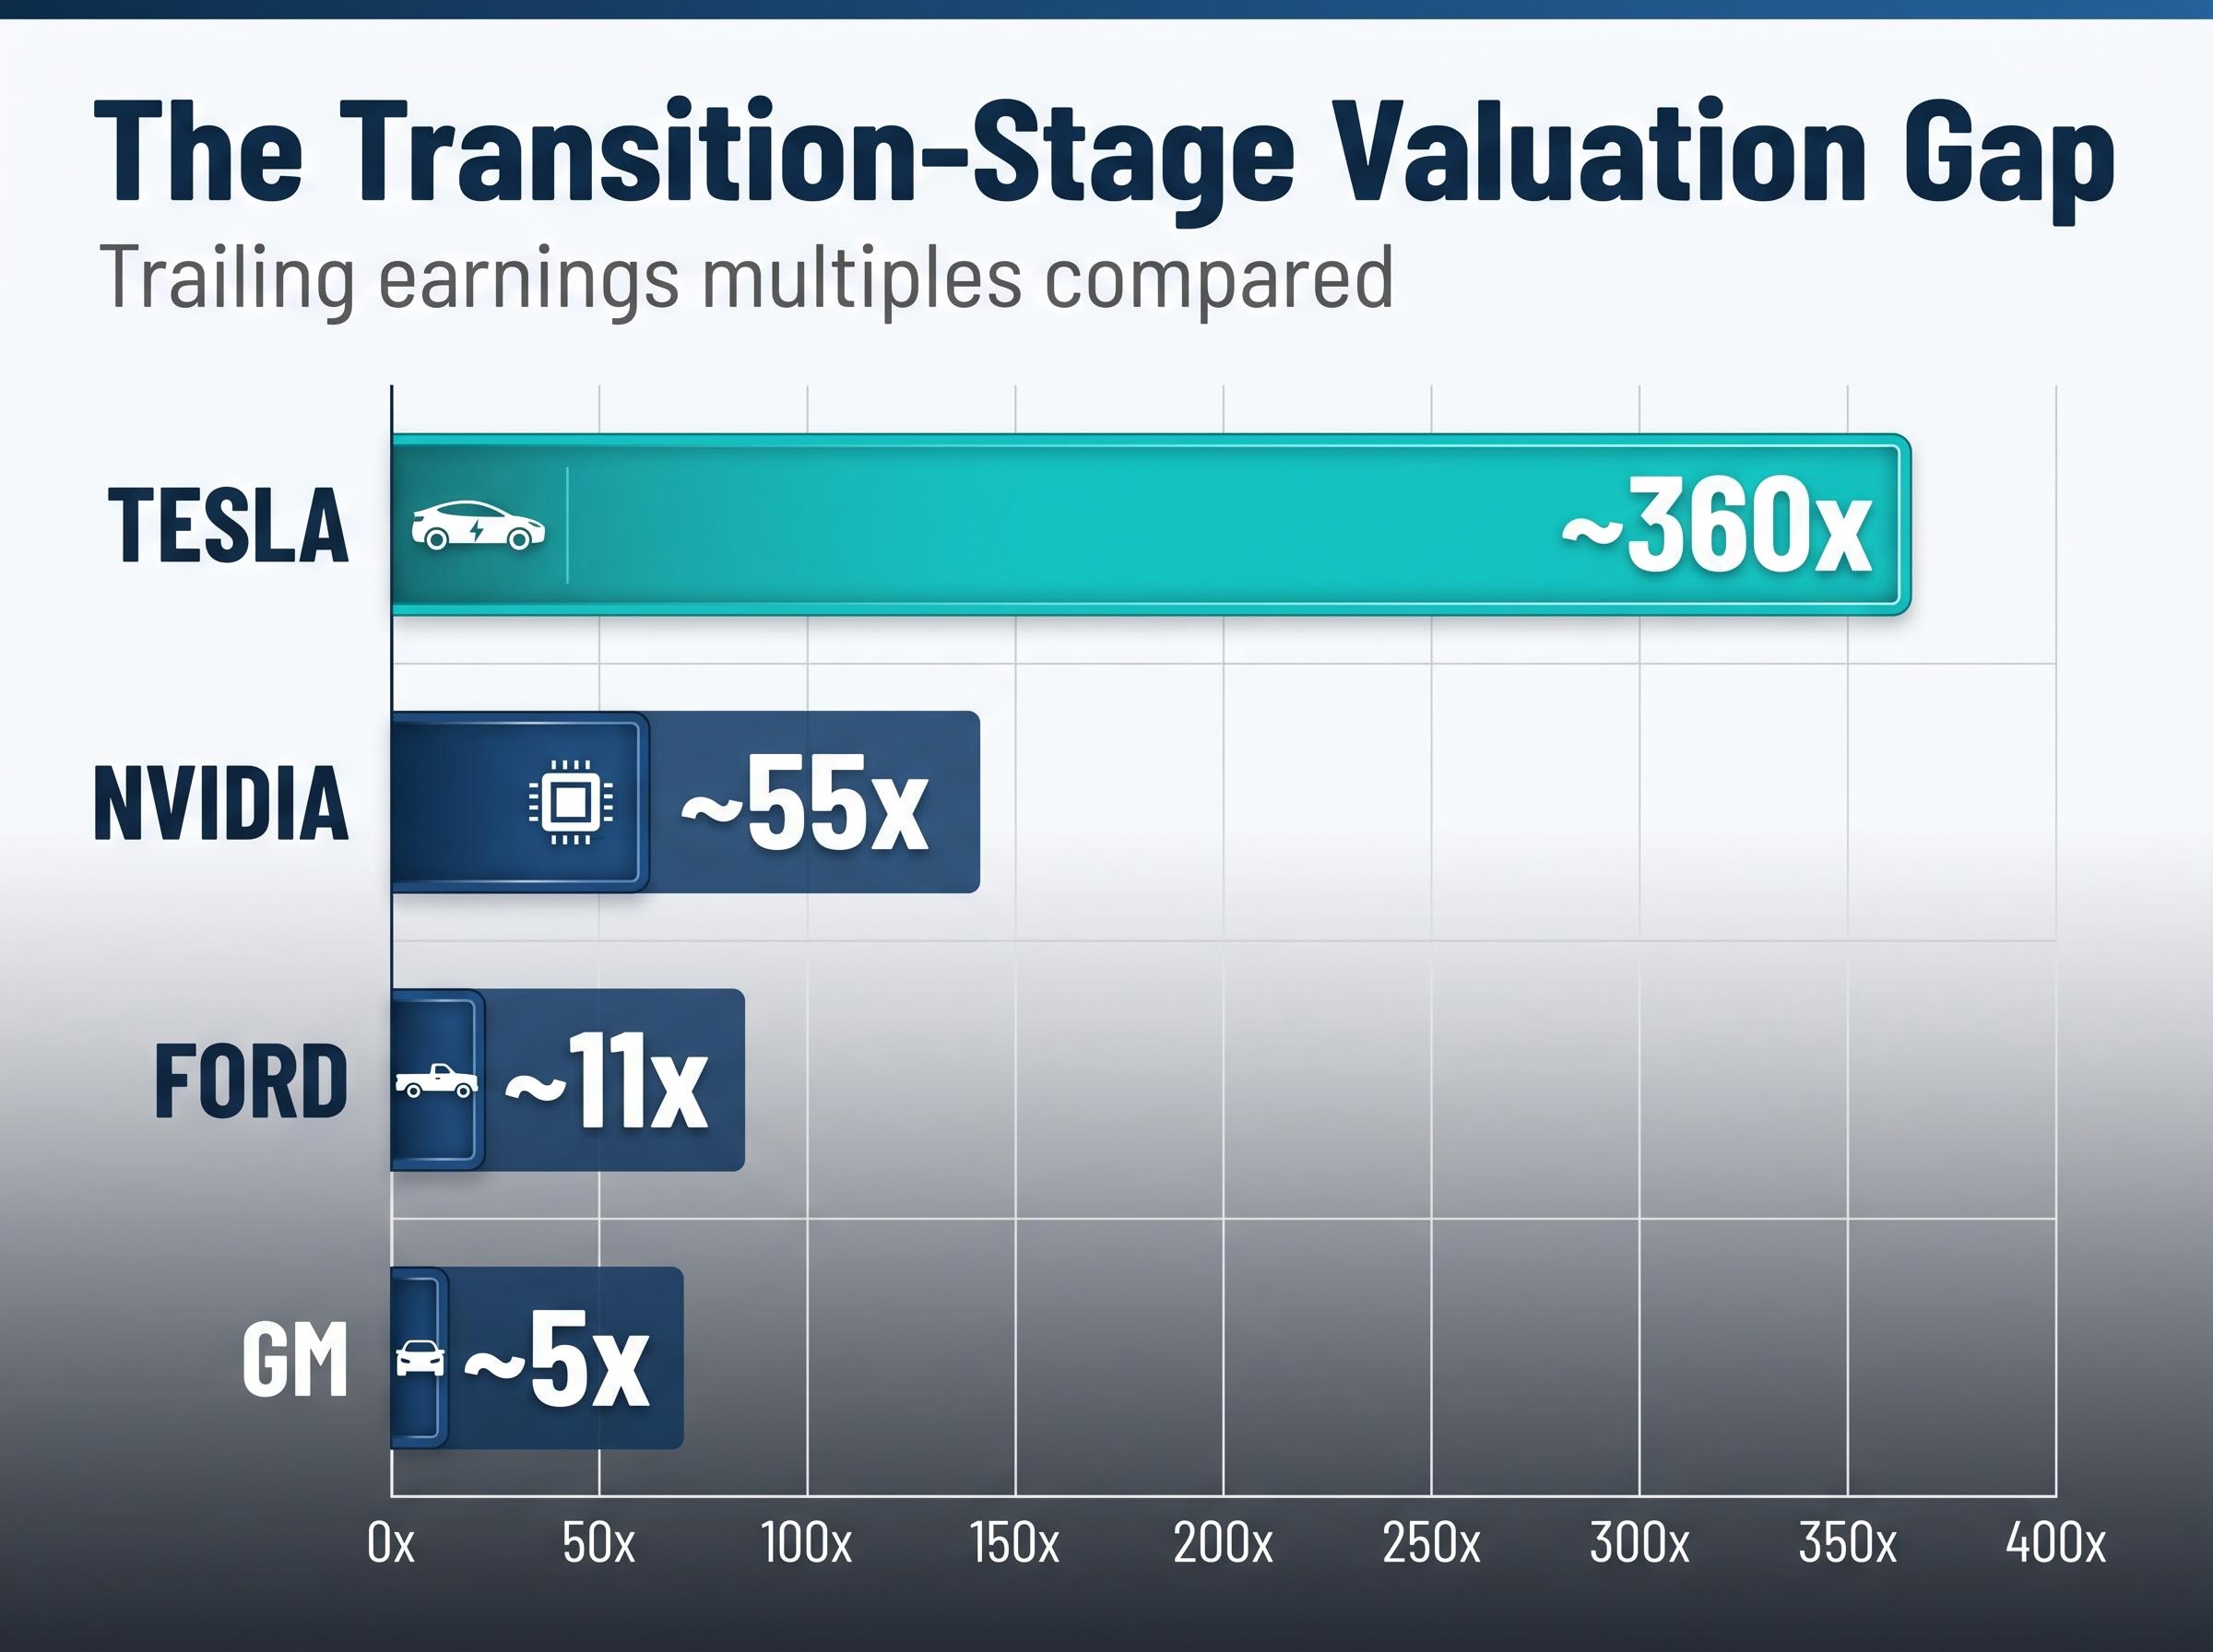
The numbers are not wrong. The inputs are contested. A 360x P/E is not a statement about Tesla‘s current car business. It is a bet on a future business model, one built on robotaxis, humanoid robots, and autonomous software, that does not yet generate revenue.
| Company | P/E Multiple | What the Multiple Implies |
|---|---|---|
| Ford | ~11x | Mature automaker valued on current earnings |
| GM | ~5x | Deeply discounted; market expects limited growth |
| Nvidia | ~55x | Proven AI revenue with accelerating demand |
| Tesla | ~360x | Priced for a business model that does not yet exist at scale |
Bernstein has characterised Tesla as trading at approximately 20x 2026 sales versus peers at 1-2x, a gap that only makes sense if the market is valuing an entirely different company than the one reporting earnings today.
Reaching for familiar ratios when evaluating a company like Tesla is not misreading the number. It is using the wrong tool for the job.
The dividend discount model, which values a stock purely as the present value of its future income stream, illustrates the foundational principle that all valuation frameworks share: what an asset is worth today is determined by what it can return to its owner over time, a logic that applies whether the income stream is a dividend or a robotaxi fare.
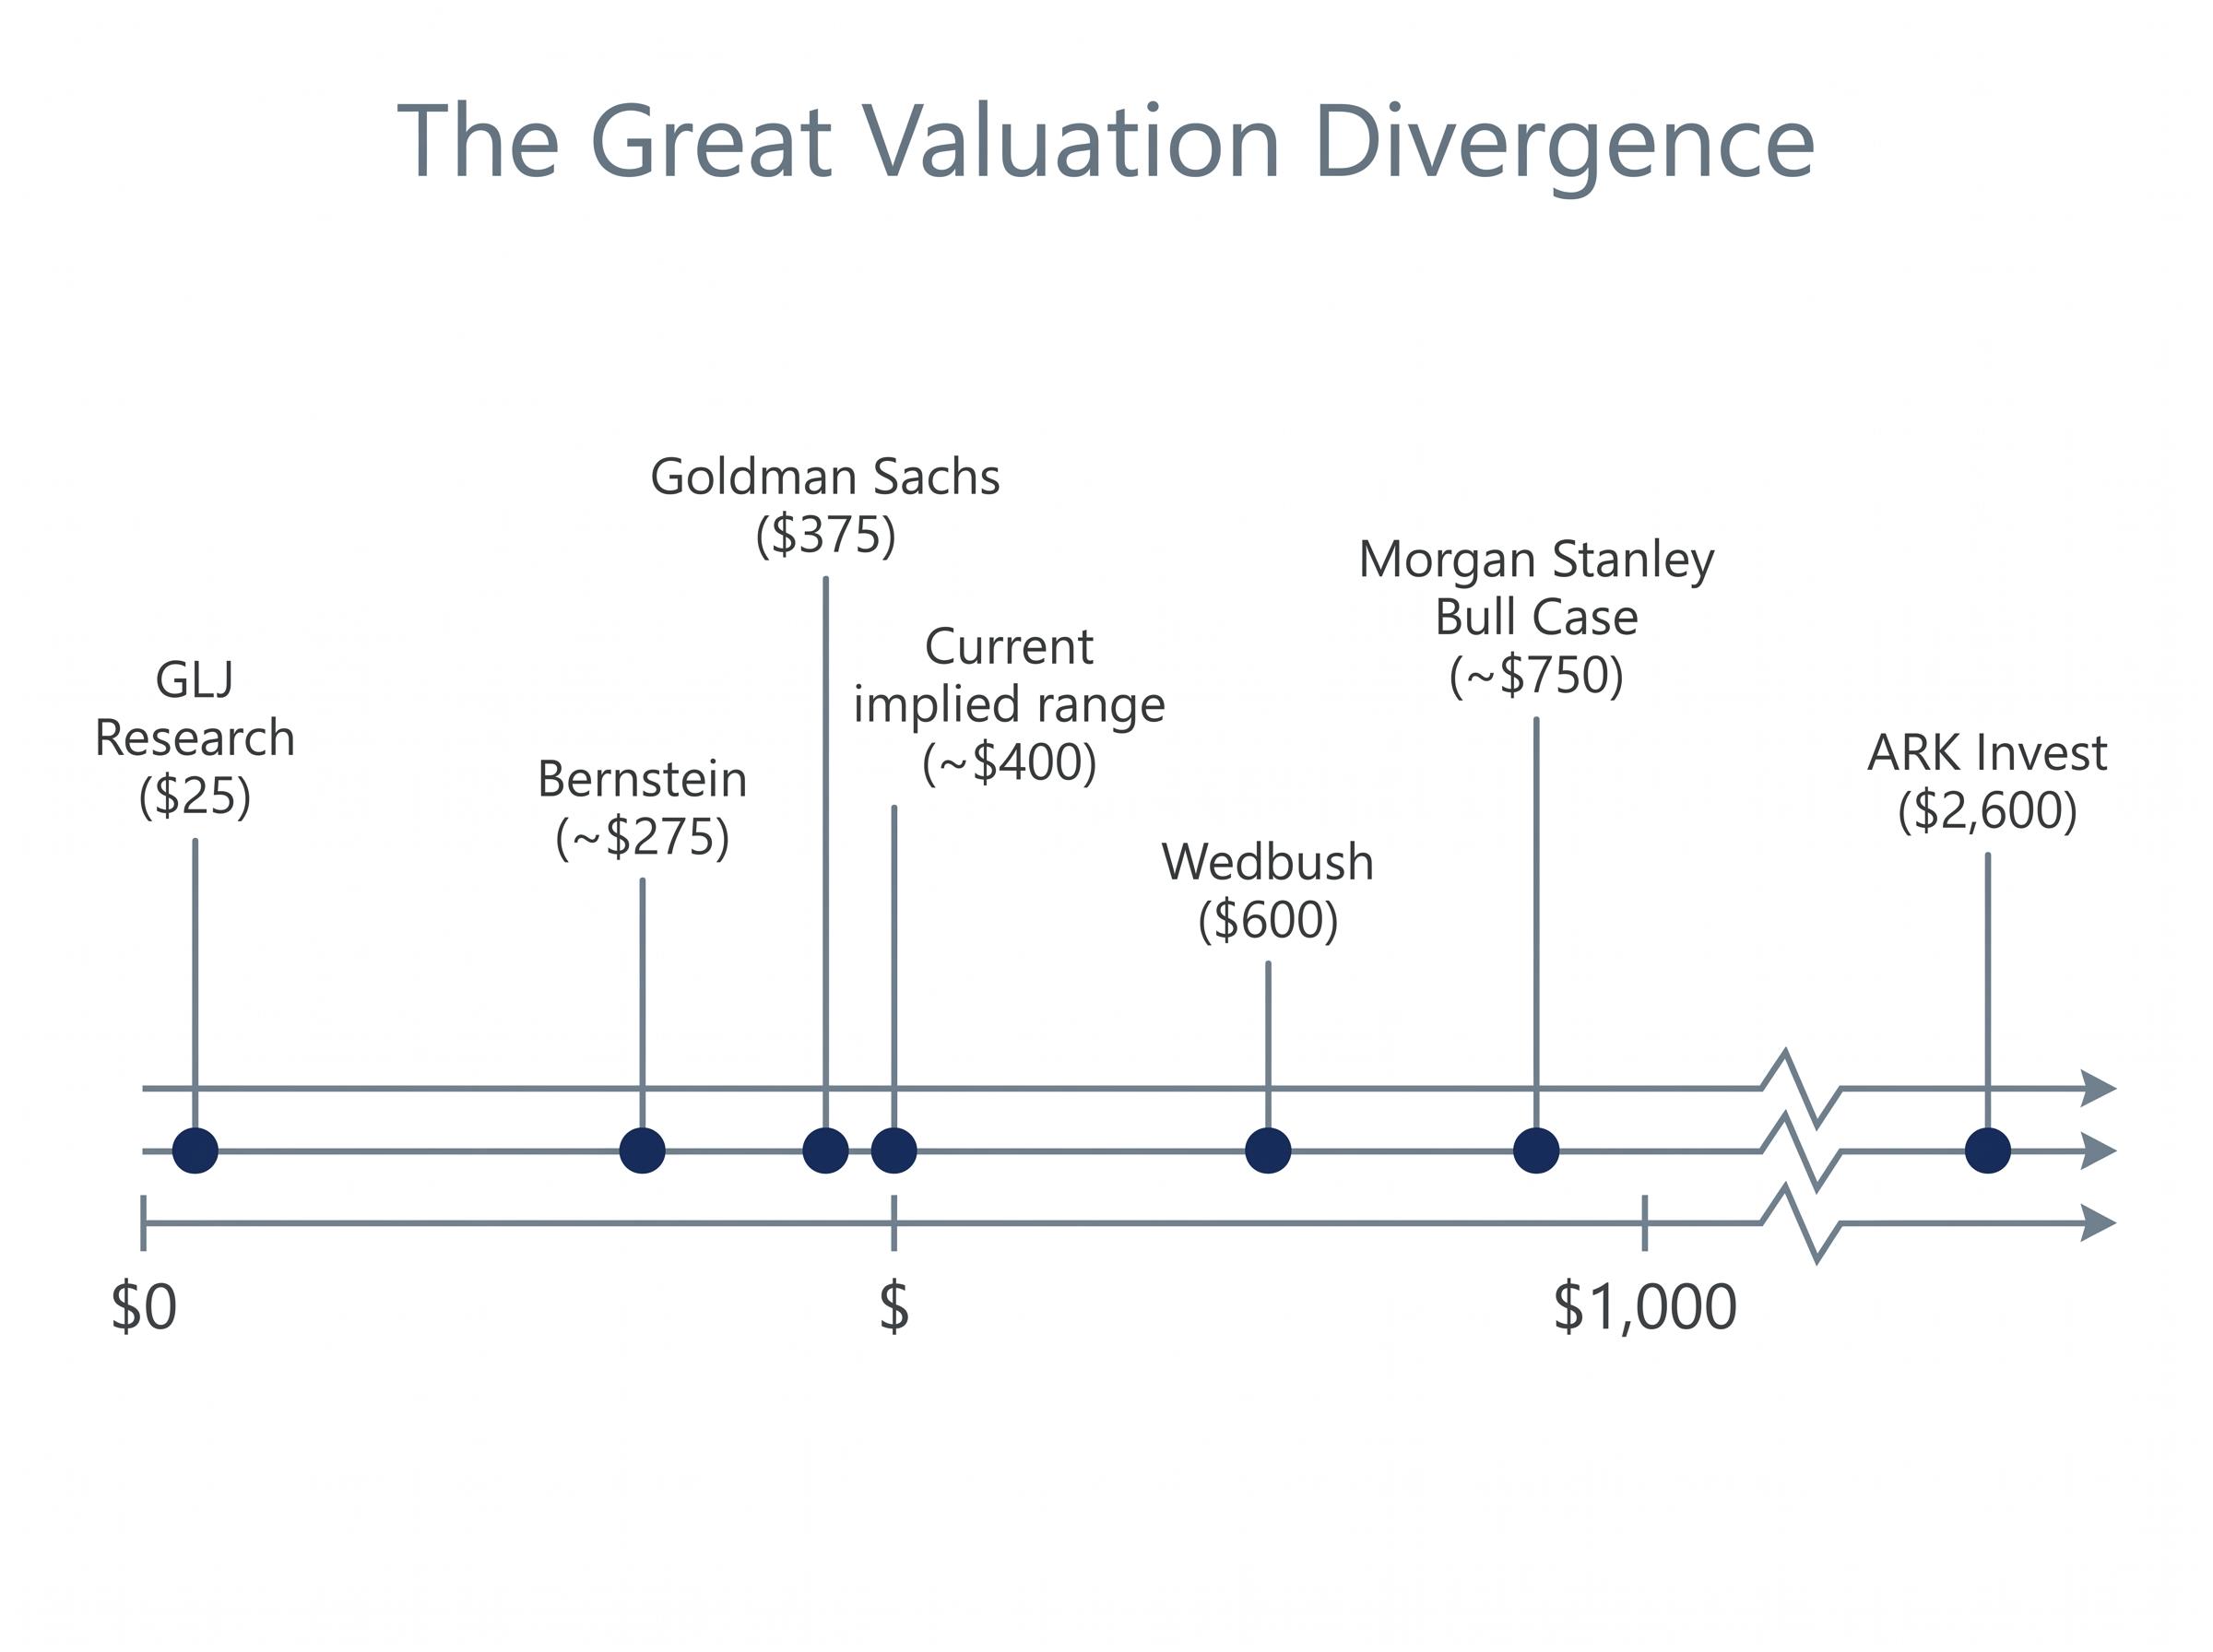
A single-point price target for a transition-stage company is, at best, a guess dressed in precision. When the range of plausible outcomes spans from $25 to $2,600, the honest analytical response is not to pick a number in the middle. It is to make the uncertainty visible and usable.
Scenario-based valuation does exactly that. Rather than forcing a single forecast onto a company where reasonable people disagree by a factor of 24, it structures the disagreement into three explicit outcomes:
The output of this exercise is not a single fair value. It is a probability-weighted view of what any given entry price is actually paying for.
Assigning probabilities to each scenario converts the exercise from a thought experiment into a decision tool. Morgan Stanley‘s framework illustrates how this works in practice.
Adam Jonas and his team have structured Tesla‘s valuation around a bull case of approximately $750, a base case near $450, and a bear case around $200. They assign roughly 70% execution risk to the bull case, meaning only about a 30-35% probability that full robotaxi and robotics success materialises. When these scenarios are weighted, the expected value approximates the stock’s actual trading range near $400, suggesting the market is already pricing in moderate, not certain, execution success.
That calculation is what transforms scenario analysis from an academic exercise into a practical framework. At any given share price, an investor can assess whether the implied probability of the bull case is one they are willing to accept.
The bull case for Tesla is not a feeling. It is a set of specific, identifiable assumptions, each of which must prove correct for the upside scenario to pay off. Treating them as a checklist, rather than a narrative, is what separates disciplined analysis from conviction without structure.
The three assumptions the bull case rests on:
The numbers required to support these assumptions are substantial. Bull case models typically project 20-35% annual revenue growth over 10 years, with net profit margins expanding to 20-30% from the current 7-10% range. Wedbush analyst Dan Ives has maintained a $600 price target, reiterated on 21 April 2026, grounded in robotics and AI optionality. ARK Invest‘s Cathie Wood has projected $2,600 by 2029 in a base case that assumes Optimus captures meaningful share of a $10 trillion+ humanoid robotics market.
Where do these programmes stand today? Approximately 500 Cybercabs are in testing in Austin as of early May 2026, with expansion to Dallas and Houston targeted for mid-2026. No revenue-generating rides have been reported. Optimus V3 production is set to begin in summer 2026 at Fremont, targeting approximately 1,000 units by Q3 2026 for internal use, with Elon Musk projecting first external sales in 2027 at $20,000-$30,000 per unit.
Musk has described Optimus as potentially the largest product ever brought to market. Whether that projection materialises depends on execution timelines that have historically slipped.
Research suggests the full bull case has an estimated 5-10% probability of materialising in its entirety. That figure is not a dismissal. It is a calibration input that tells investors exactly how much they are relying on if they underwrite the most optimistic outcome.
For investors who want to go deeper on the methodology behind separating Tesla’s automotive business value from its embedded robotics and autonomy options, our full explainer on sum-of-the-parts valuation for high-optionality stocks walks through the Q1 2026 earnings data, ARK Invest’s open-source model structure, and how to assign distinct multiples to business lines that have not yet contributed revenue.
Strip away the robotaxi network, the humanoid robots, and the AI software platform. What remains is an electric vehicle manufacturer operating in an increasingly competitive market with compressing margins. The bear case builds from that foundation.
Under bear case assumptions, revenue growth slows to 6-12% annually, net margins settle between 8-14%, and the market applies a valuation multiple of 18-22x earnings, a premium to legacy automakers but far below the current implied multiple. Tesla‘s Q1 2026 gross margin of 19.2% provides the starting reference point, and even generous above-average margin assumptions for an EV-only business produce negative projected returns at a share price of $375-$400.
| Assumption Category | Bull Case Range | Bear Case Range | Current Reality |
|---|---|---|---|
| Revenue Growth (Annual) | 20-35% | 6-12% | Mixed; EV demand softness in Q1 2026 |
| Net Margin | 20-30% | 8-14% | Gross margin 19.2%; net margin ~7-10% |
| Valuation Multiple | 50-100x+ | 18-22x | ~360x TTM P/E |
Goldman Sachs lowered its price target to $375 on 6 April 2026, citing execution risk. Bernstein has maintained an approximately $275 target, with a bear case DCF near $250. GLJ Research‘s Gordon Johnson reiterated a sell at approximately $25 on 22 April 2026, reflecting deep scepticism about the company’s fundamental valuation on current earnings.
CFO guidance of more than $25 billion in 2026 capital expenditures, with no robotics or robotaxi revenue yet confirmed, is the number that concentrates the bear argument. Capital is being deployed at scale into programmes that have not yet generated a dollar of revenue.
Three specific risks define the bear case trajectory:
The regulatory gap is the most immediate. Tesla filed for a commercial robotaxi deployment permit with the California Public Utilities Commission (CPUC), the state body that authorises commercial driverless ride services. As of early May 2026, no deployment authorisation has been granted. Without California, the largest addressable robotaxi market in the United States remains closed.
The competitive gap is the most concrete. Waymo is completing approximately 500,000 paid rides per week across Phoenix, San Francisco, Los Angeles, and Austin, on a trajectory toward $1.2 billion in annualised revenue. Analysts estimate Tesla lags Waymo by 12-18 months in commercial scale and revenue generation.
Waymo’s weekly ride volume and revenue trajectory, reported at 450,000 paid rides per week with 14 million total paid trips completed in 2025 and a target of 1 million weekly rides by end of 2026, establishes the commercial benchmark against which Tesla’s Austin Cybercab testing programme must be measured.
The capital timing mismatch is the most structural. More than $25 billion in planned 2026 capex is flowing into programmes whose revenue timelines remain aspirational. The NHTSA recall notice issued in late April 2026 affecting 218,868 vehicles (a software issue, per NHTSA report RCLRPT-26V283-7135) serves as a reminder that operational risk persists alongside the strategic transition.
The same company, the same fundamentals, and the same scenarios produce entirely different return outcomes depending on the price paid at entry. This is the single most underappreciated variable in stock valuation analysis.
Tesla traded near $100 in prior years. It has peaked near $450. An investor who bought at $100 and holds through a base case that materialises at $450 earns a dramatically different return than an investor who buys at $400 and holds through the same outcome. The company’s future did not change between those two entries. The investor’s return profile changed completely.
At the current share price of approximately $400, the stock implies investors are paying roughly 330x forward earnings against a 2026 consensus EPS of approximately $1.22. For that multiple to normalise to anything resembling a growth-stock valuation, forward EPS estimates would need to grow more than 5x from current levels. Even under bull case assumptions, annualised returns over 10 years from today’s entry price range from approximately 11-35%, illustrating that the most optimistic scenario does not guarantee exceptional returns at this price.
The process for making entry-price sensitivity actionable is straightforward:
Research framing from the unified analysis is clear: “The entry price paid has a significant impact on future returns, illustrated by the contrast between buying Tesla near $100 versus near $400-$450 per share.”
Growth rates, margin trajectories, and regulatory outcomes are outside an investor’s control. Entry price is the one variable that is entirely within it.
The challenge of paying the right price for a single stock sits inside a broader context: broad market valuation signals, including the Buffett Indicator at 223.6% as of May 2026, suggest that margin-of-safety opportunities across US equities are structurally scarce, which raises the cost of misjudging entry price on any individual position.
The Tesla case study is the practice ground. The methodology it teaches applies to any company whose stock price is pricing in a transformation that has not yet been delivered.
Four variables determine scenario outcomes for any transition-stage company:
The analyst divergence on Tesla, a $575 gap between Wedbush‘s $600 target and GLJ Research‘s $25 target, illustrates how wide scenario-based disagreement can legitimately become when the transformation is ambitious and the evidence is early. That Morgan Stanley‘s probability-weighted model approximates actual trading levels near $400 demonstrates that current prices reflect moderate execution probability, not certainty.
The AI hardware and software repricing playing out across the broader technology sector in 2026, where semiconductor equipment indices have gained more than 47% while software applications indices have fallen nearly 23%, provides a concrete reference point for how quickly the market re-rates companies when AI optionality either proves out or fails to materialise.
Having run the scenarios, an investor must now state explicitly which scenario their buy decision is betting on and why. This is the discipline that separates structured analysis from hope.
At approximately $400, a Tesla investor is implicitly pricing in moderate-to-high execution probability on the robotics and autonomous vehicle thesis. The question is whether that probability assignment is supported by evidence: by production ramp data, by regulatory progress, by revenue generation timelines, and by competitive positioning relative to Waymo and others already operating at commercial scale. An investor who cannot articulate their probability assignment in specific terms has not completed their valuation work.
Stock valuation analysis for transition-stage companies is not primarily about calculating a fair value. It is about making explicit what future the current price is paying for.
This guide has delivered two tools. The three-scenario structure (bull, base, bear) makes the range of outcomes visible and forces assumptions into the open. Entry-price sensitivity analysis reveals how the same company and the same fundamentals produce different returns depending solely on the price paid.
Tesla‘s case remains genuinely uncertain. The most likely outcome may fall between full execution and full failure, which is precisely the scenario that justifies neither the $600 bull target nor the $25 bear target. As Optimus production ramps, robotaxi revenue either appears or does not, and more than $25 billion in capex either converts to cash flow or continues to burn, the scenario probabilities will shift, and so will the rational entry price.
The framework does not resolve the uncertainty. It makes the uncertainty usable. Apply it to any company on a watchlist where the stock price is pricing in a future that has not yet arrived, and the same discipline holds: identify the transformation thesis, build the scenarios, and determine what the entry price implies about which future is being underwritten.
This article is for informational purposes only and should not be considered financial advice. Investors should conduct their own research and consult with financial professionals before making investment decisions. Past performance does not guarantee future results. Financial projections are subject to market conditions and various risk factors.
Scenario-based stock valuation analysis structures uncertainty into three explicit outcomes (bull, base, and bear cases), each with distinct assumptions for revenue growth, margins, and valuation multiples, allowing investors to assess what any given entry price is actually paying for rather than relying on a single price target.
Standard P/E ratios lose meaning when a company is deliberately suppressing near-term profits to fund a transformation into a new business model, because the multiple reflects a future business that does not yet generate revenue rather than the current earnings power of the existing business.
The same company and the same future fundamentals produce entirely different return outcomes depending on the price paid at entry; for example, buying Tesla near $100 versus near $400 produces dramatically different returns even if the base case scenario materialises identically in both situations.
Research cited in the article estimates the full bull case, which includes robotaxi revenue at scale, commercial Optimus deployment, and software-like margins, has an estimated 5-10% probability of materialising in its entirety, making it a calibration input rather than a base expectation.
The four key variables are revenue growth rate, margin trajectory from current suppressed levels to steady-state profitability, terminal valuation multiple the market will assign once the transformation is resolved, and the timeline the market is willing to wait for execution before re-rating the stock.