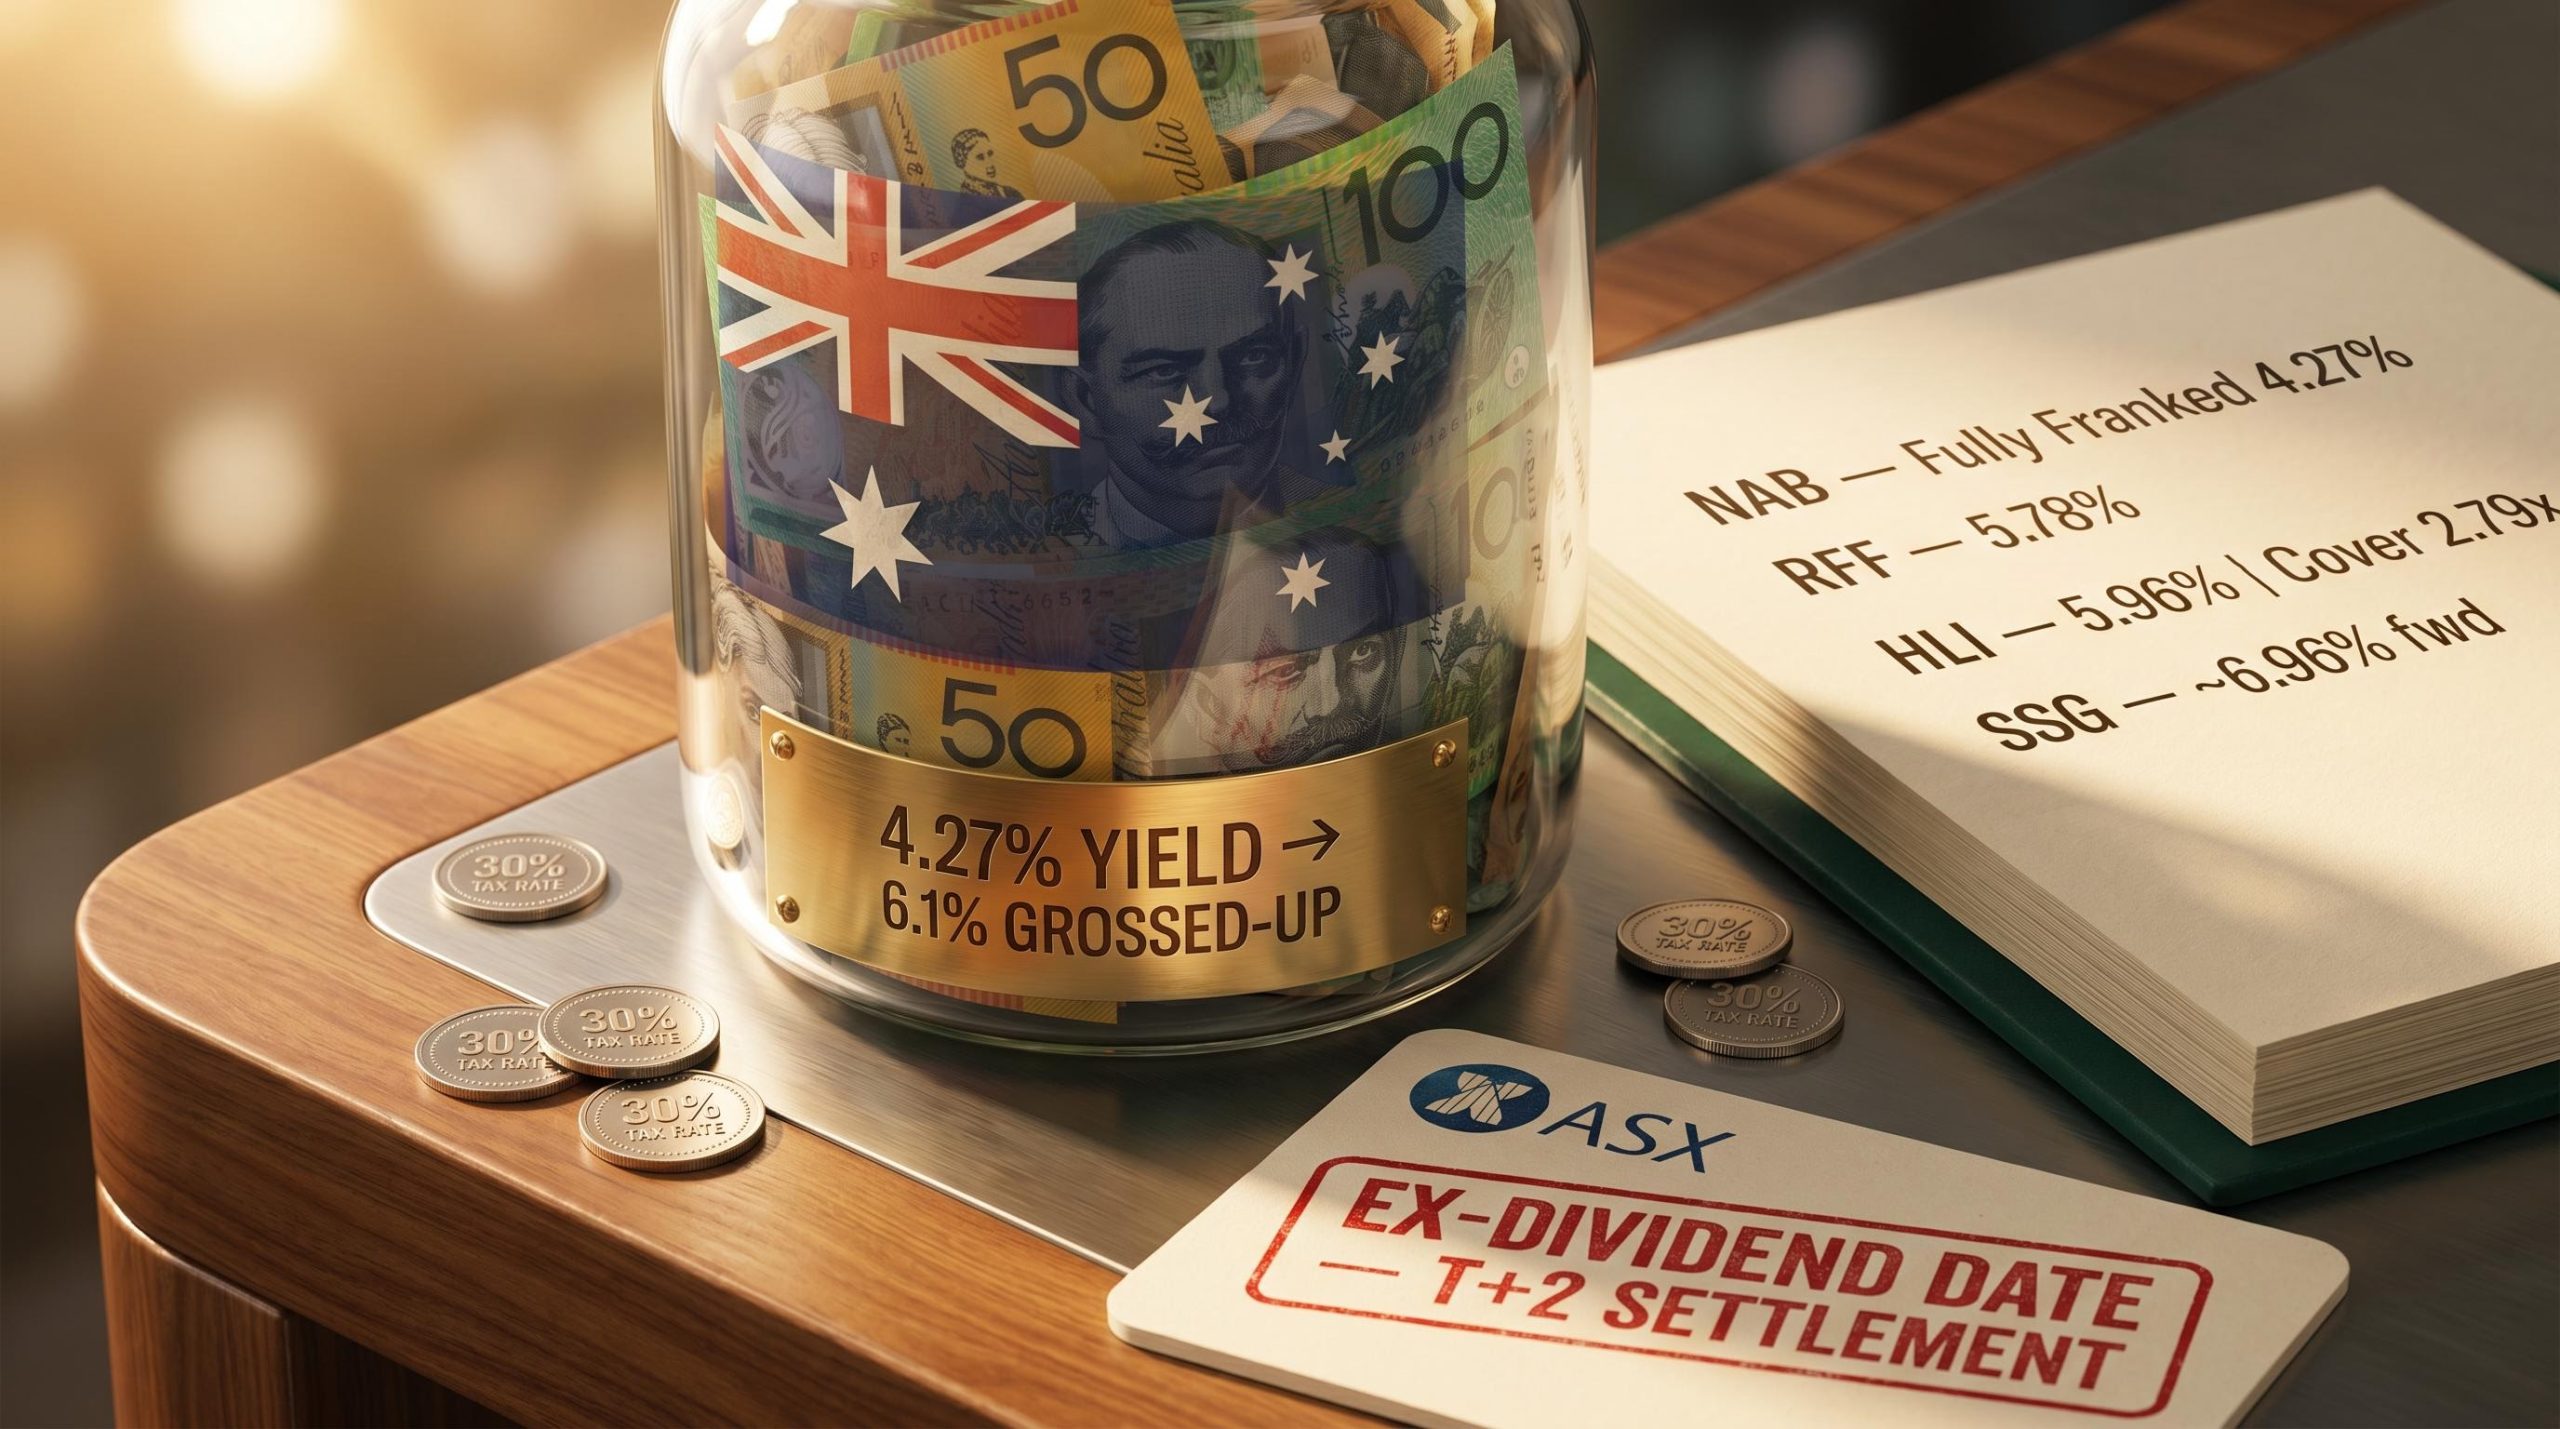
How to Build a Global ETF Portfolio on the ASX With 3 Funds
7 hrs ago
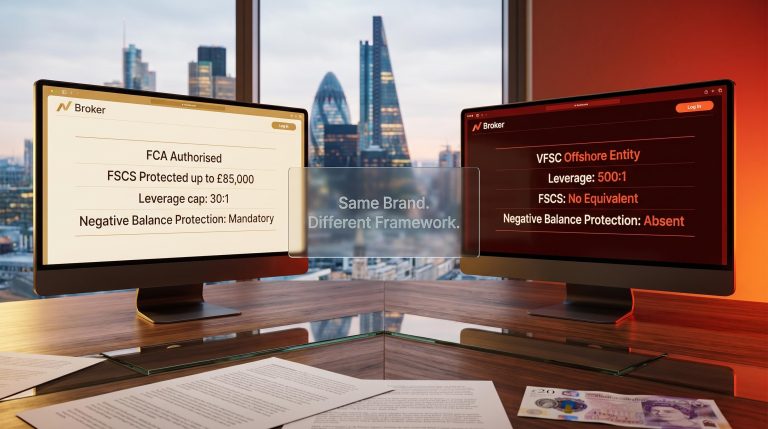
A fully franked 4.27% yield from National Australia Bank grosses up to approximately 6.1% for an investor on the 30% tax rate, before a single cent of share price appreciation enters the calculation. That gap between the headline yield and the true income return is precisely what most new ASX income investors miss. Dividend investing in Australia carries a structural advantage unavailable in most global markets: the franking credit system. But that advantage only translates into returns for investors who understand how to evaluate sustainability, read the calendar correctly, and construct a portfolio with genuine diversification rather than concentration in banks and resources. This guide covers the full operational toolkit: how to calculate and interpret yield and payout ratio, the calendar dates that determine whether a dividend is received at all, how reinvestment plans compound wealth, the traps that punish yield chasers, and how to build a diversified ASX income portfolio that holds up across cycles.
Dividend yield is a simple calculation: annual dividend per share divided by the current share price, multiplied by 100. A stock paying $1.00 per share in annual dividends with a share price of $20 yields 5%.
The number looks straightforward. It is not.
Yield moves in two directions. A company raising its dividend pushes yield higher, which signals a growing business. But yield also rises when the share price falls, even if the dividend stays flat. A stock paying that same $1.00 dividend whose price drops from $20 to $10 now yields 10%, yet the business is weaker, not stronger. Yield figures published in screeners and articles may reflect outdated prices, so verifying against the current share price before acting is always worth the few seconds it takes.
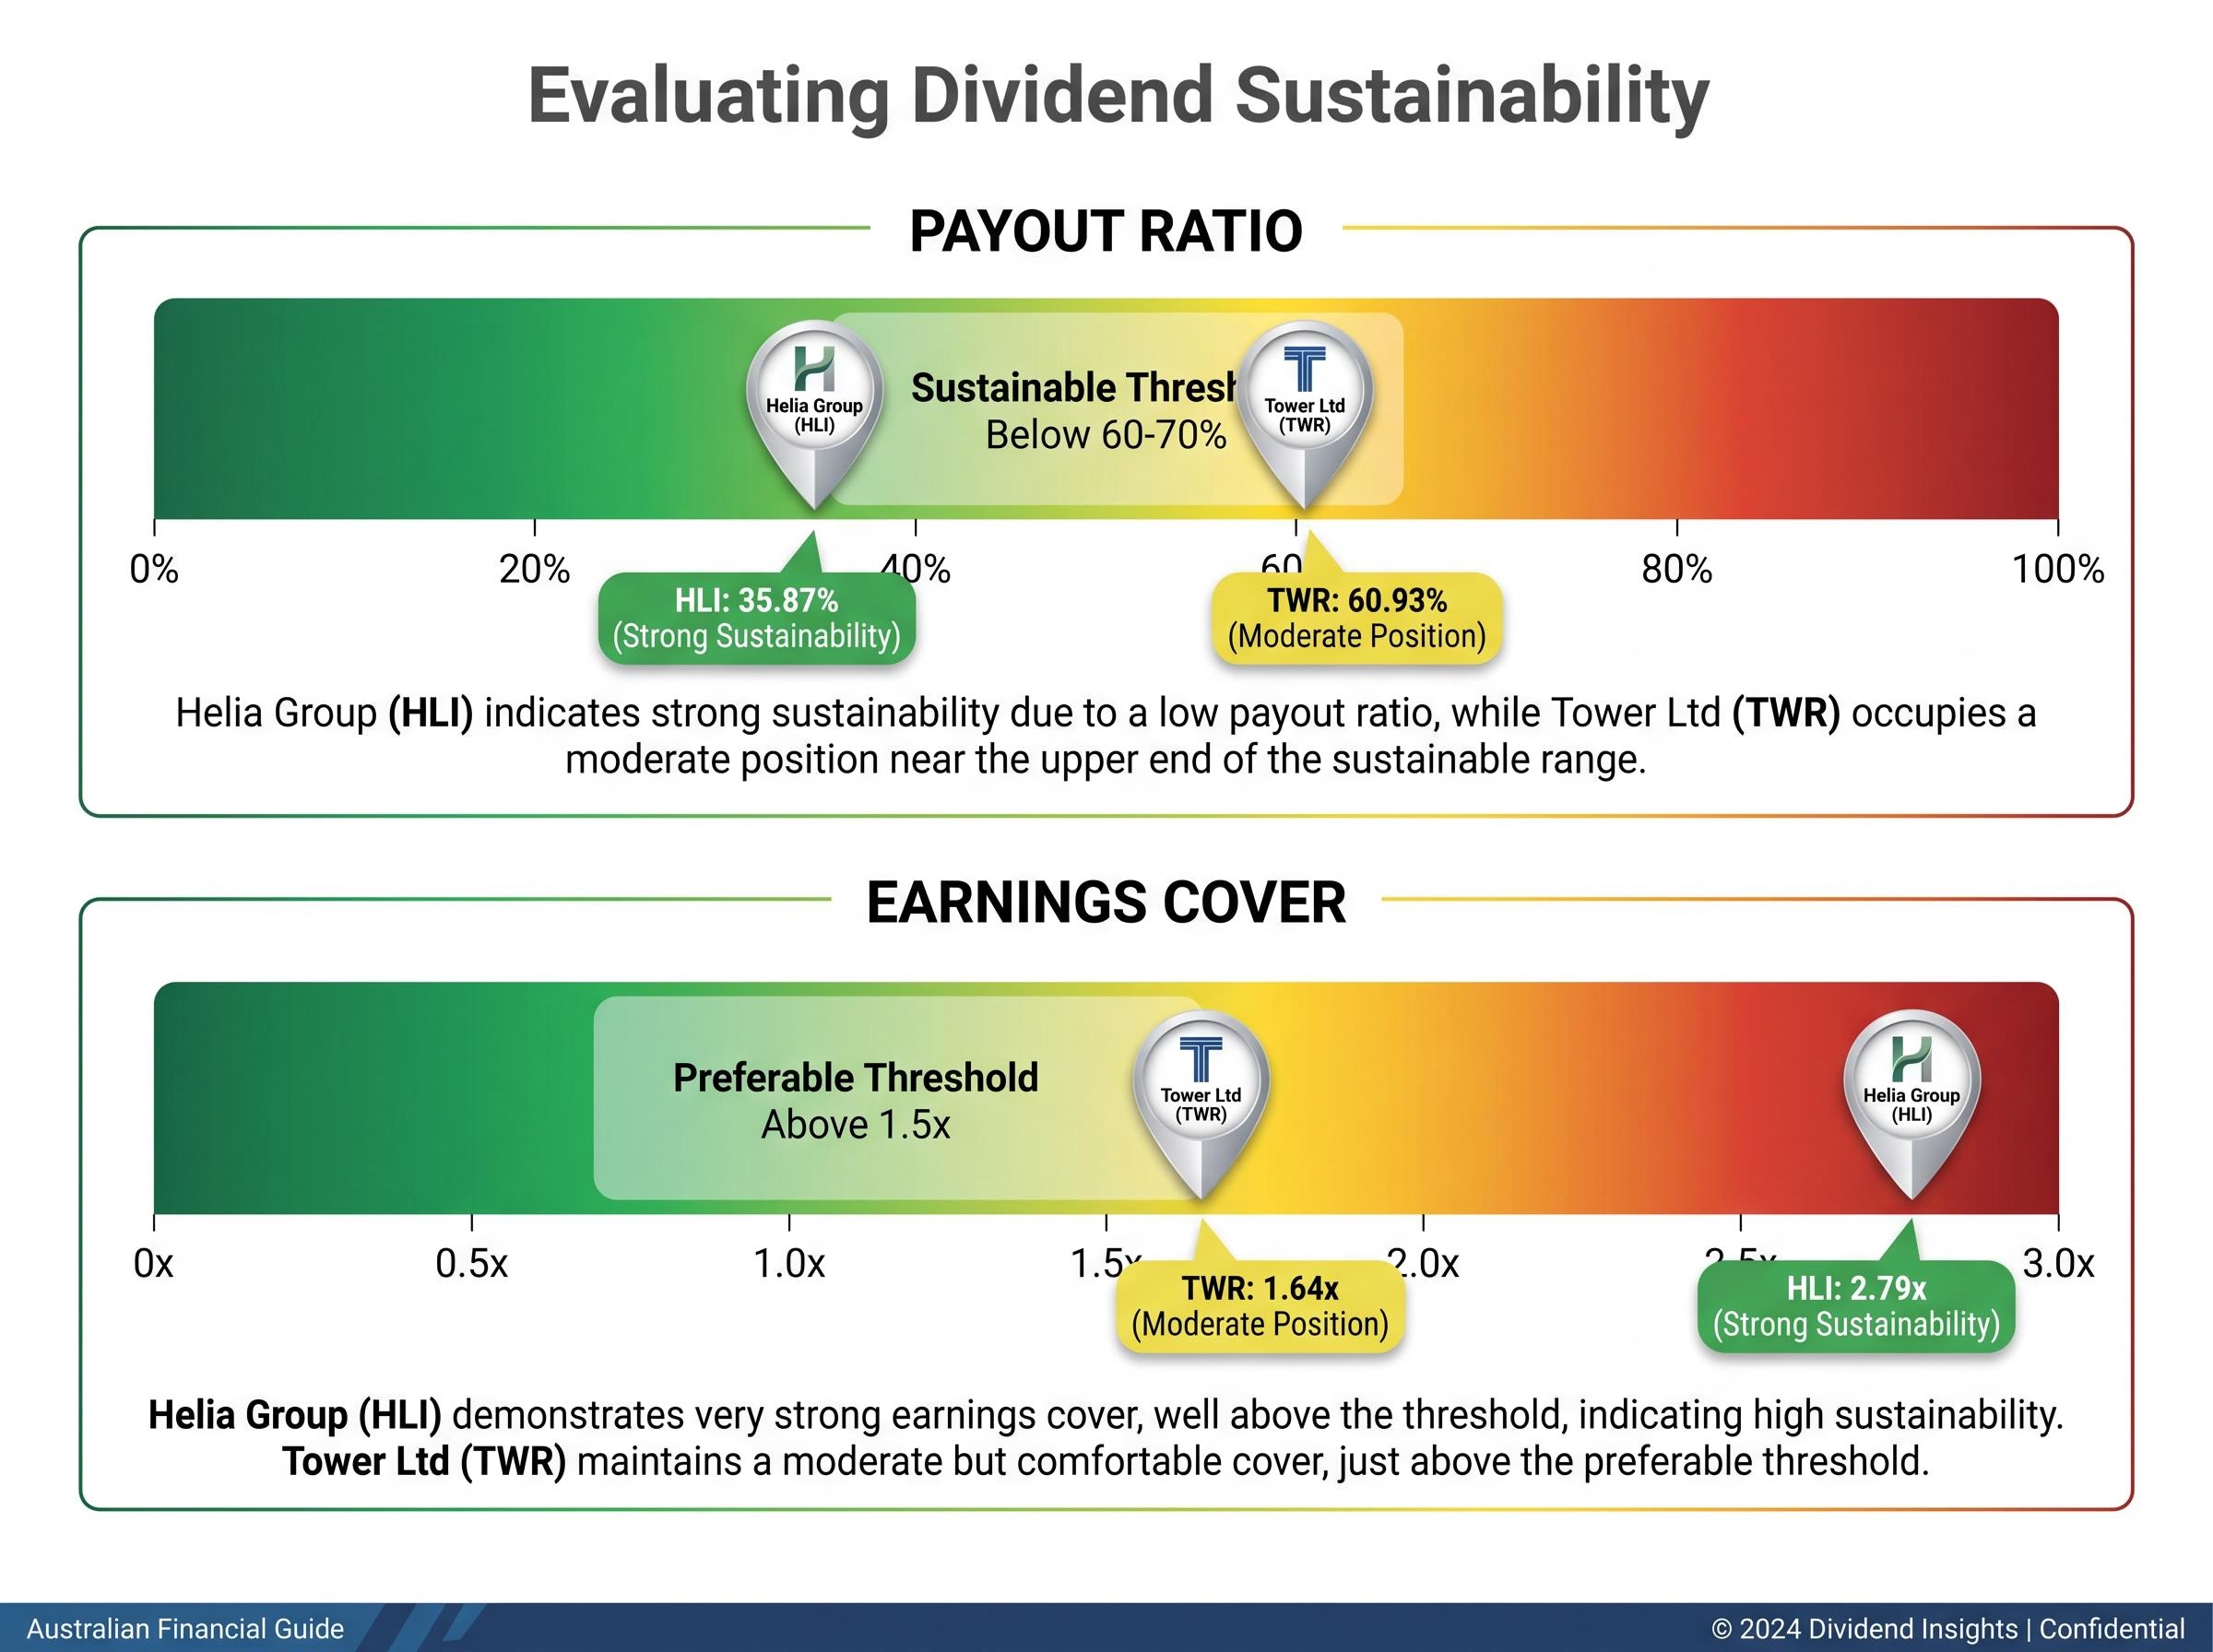
The payout ratio measures what percentage of net earnings a company distributes as dividends: total dividends divided by net earnings, expressed as a percentage. A payout ratio below 60-70% is generally considered sustainable. Above that level, the company retains less earnings to reinvest, service debt, or absorb a downturn, making the dividend more vulnerable to a cut.
The inverse of the payout ratio, known as earnings cover, shows how many times earnings cover the dividend. A cover ratio above 1.5x is preferable. Helia Group (HLI) currently sits at a payout ratio of approximately 35.87%, with earnings cover of approximately 2.79x, a reading that suggests strong sustainability. Tower Ltd (TWR), by contrast, carries a payout ratio of approximately 60.93% and earnings cover of approximately 1.64x, a moderate position closer to the threshold where dividend resilience begins to thin.
The dividend discount model formalises this quality-first discipline by treating a stock’s value as the present value of its future dividend stream rather than a resale price target, an approach that forces investors to interrogate earnings growth assumptions and payout sustainability rather than simply comparing headline yields across screeners.
| Metric | Formula | Healthy Reading | Warning Reading |
|---|---|---|---|
| Dividend Yield | Annual dividend per share ÷ current share price × 100 | Rising yield driven by growing dividends | Rising yield driven by falling share price |
| Payout Ratio | Total dividends ÷ net earnings × 100 | Below 60-70%; earnings cover above 1.5x | Above 70%; earnings cover below 1.5x |
Four dates govern every ASX dividend, and they play out in a fixed sequence:
Most ASX companies follow a semi-annual dividend schedule, declaring payments after half-year and full-year financial results.
The ex-dividend date is where most timing mistakes happen, and the reason is settlement mechanics. The ASX operates on a T+2 settlement cycle: a trade executed on any given day settles two business days later. If the ex-dividend date is a Wednesday, a purchase made on Wednesday will not settle until Friday, after the record date has passed.
A purchase made on the ex-dividend date settles two business days later, after the record date has passed. That investor will not receive the dividend.
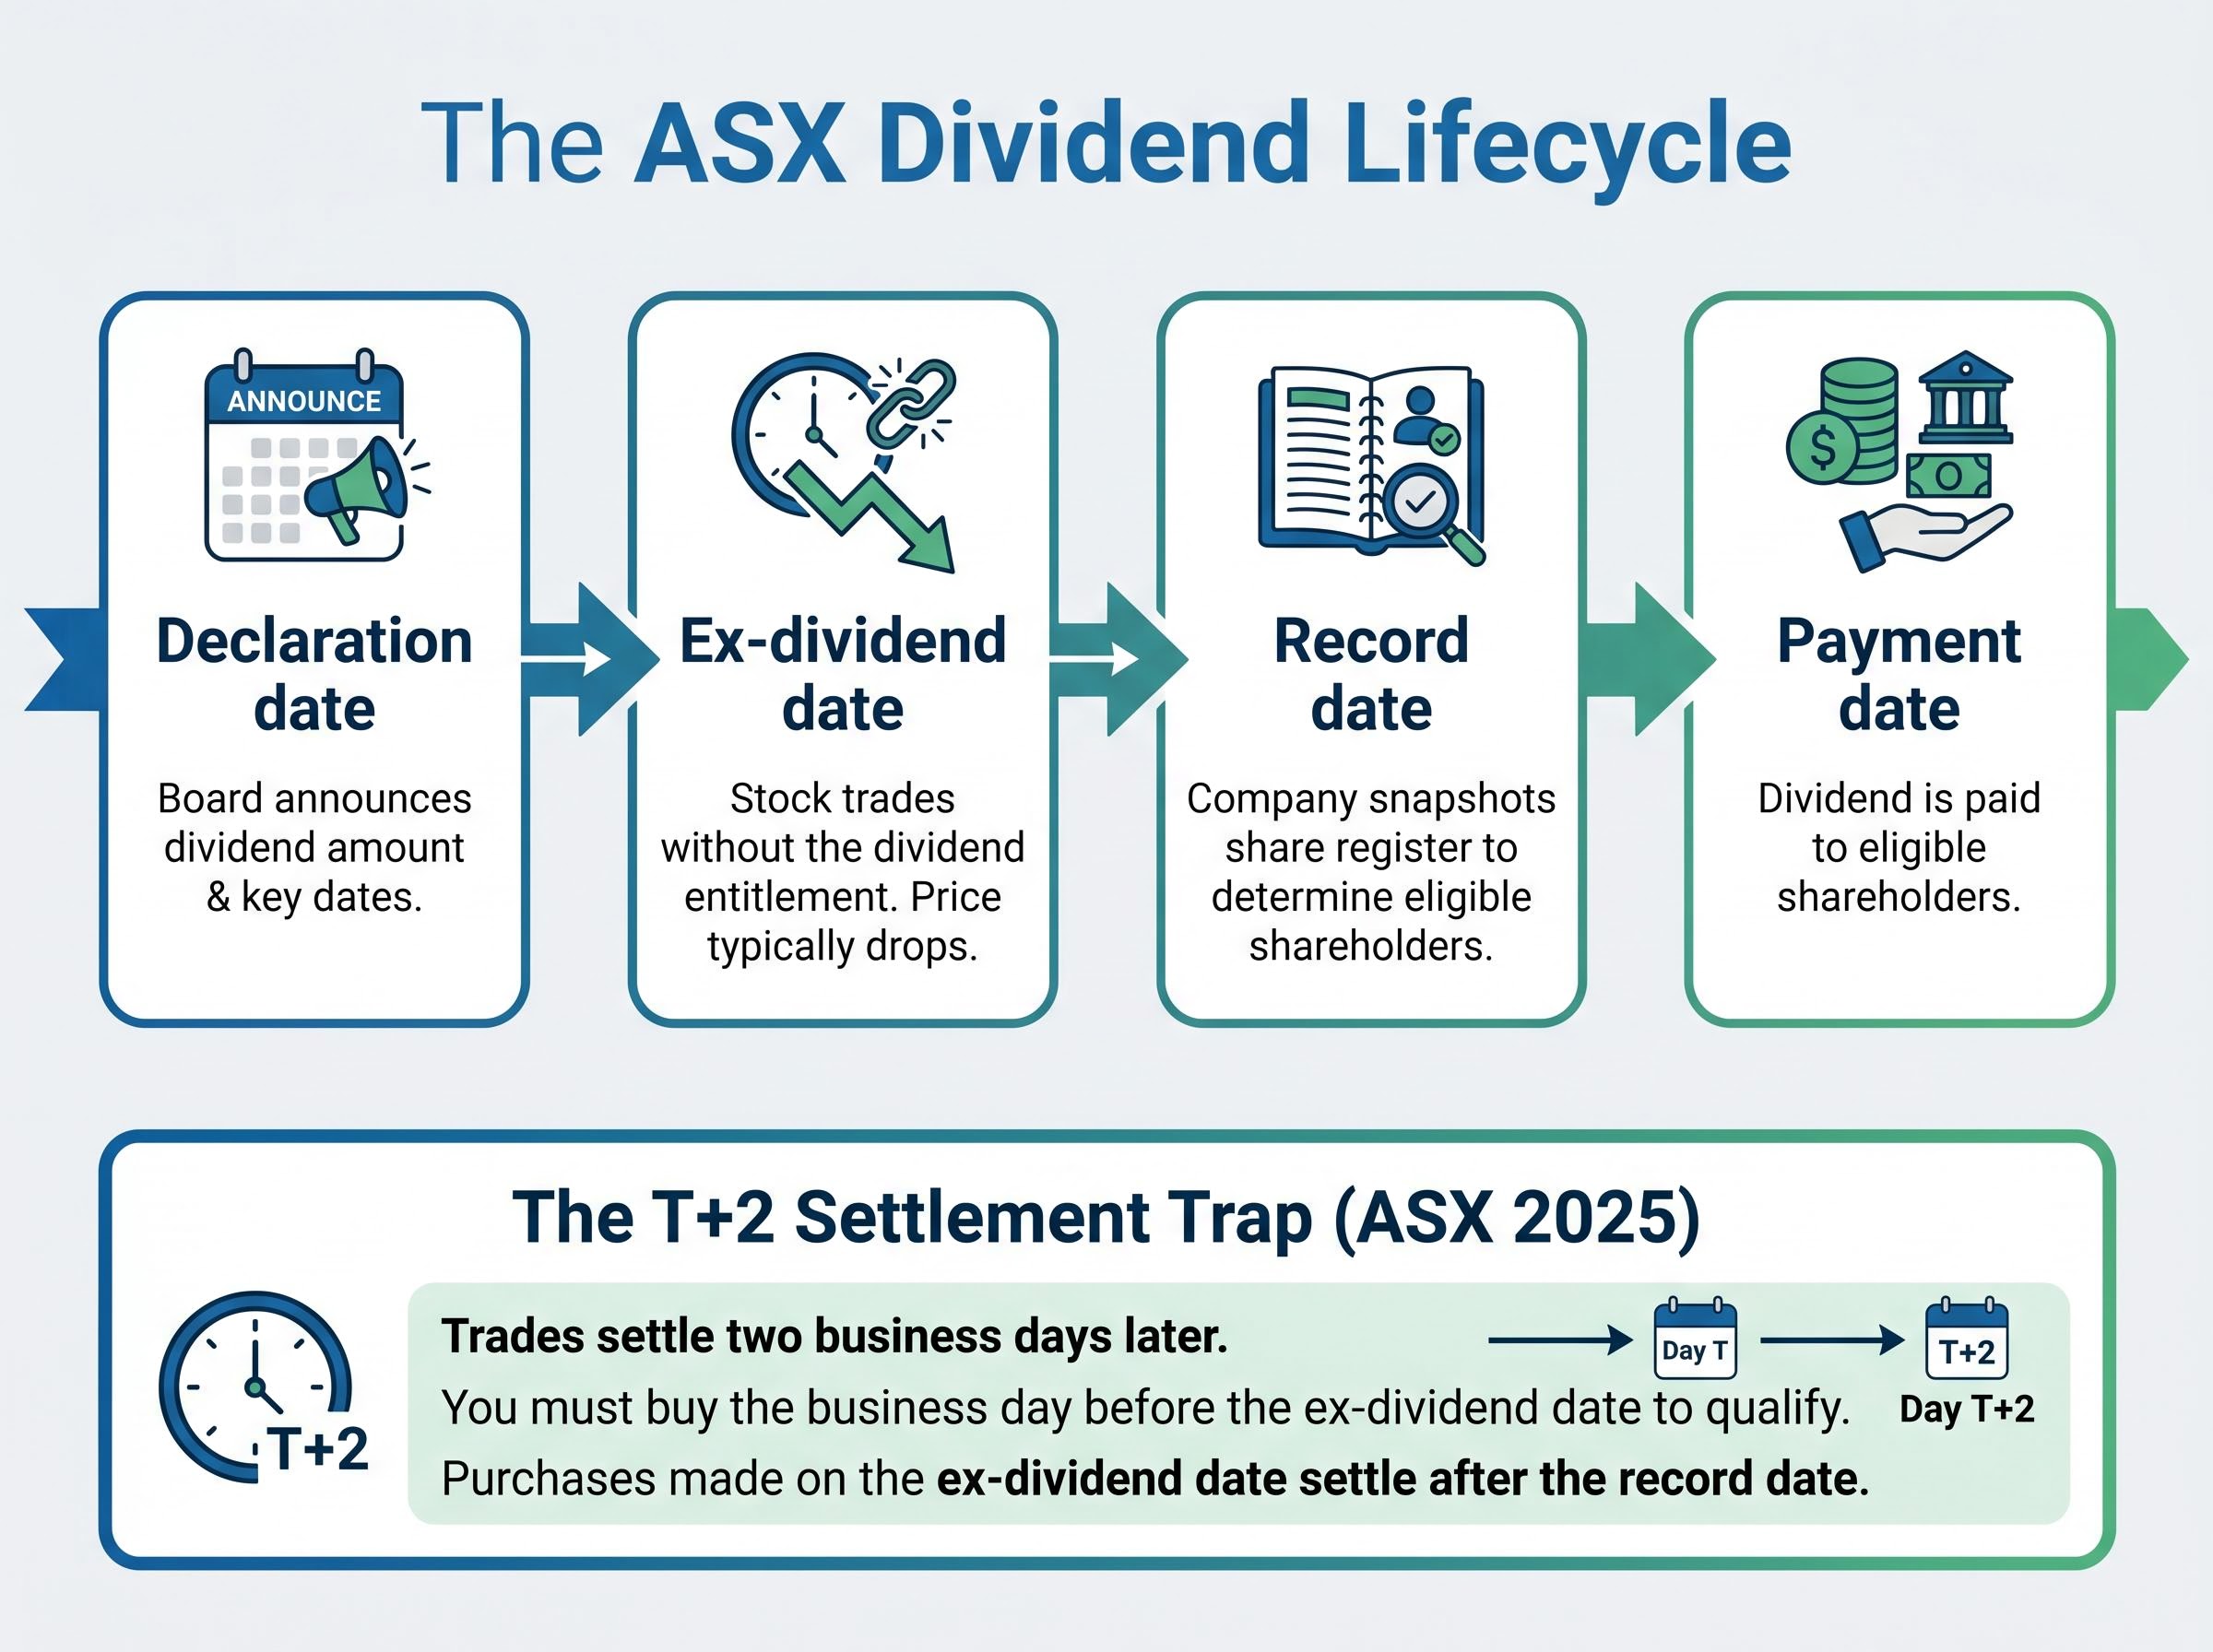
The last day to buy and still qualify is the business day before the ex-dividend date. In the Wednesday example, that means Tuesday.
The ASX T+2 settlement framework defines the two-business-day window between trade execution and settlement that determines whether a buyer appears on the share register by the record date, making the business day before the ex-dividend date the definitive last opportunity to qualify for an upcoming payment.
One further point worth noting: share prices typically fall by approximately the dividend amount on the ex-dividend date, as the upcoming payment is no longer attached to the shares. Buying the day before solely to capture a dividend often produces no net gain once that price adjustment is factored in. ASX T+2 settlement rules remain unchanged as of 2025; investors should monitor for any future transition to T+1, which has been adopted in some other markets.
Understanding the three types of ASX dividend payments provides the conceptual map for placing every other mechanic in this guide into context.
The distinction between recurring and special dividends matters more than it might appear. Helia Group (HLI) carried a headline trailing yield of 16.6% at one point, a figure that reflected special dividend payments. Strip those out, and the recurring yield sits at approximately 5.96%, a strong number, but a very different income expectation.
Franking status adds another layer. Dividends from Australian companies may be fully franked, partially franked, or unfranked, depending on how much corporate tax has been paid on the underlying profits. The corporate tax rate is 30% for large companies and 25% for base rate entities.
The ATO franking credit refund rules confirm that where an investor’s franking credits exceed their total tax liability, the excess is refundable as cash, a benefit that applies to eligible retirees, SMSFs in pension phase, and low-income earners and makes fully franked dividends particularly valuable for those groups.
Grossed-up yield example: NAB’s fully franked 4.27% cash yield grosses up to approximately 6.1% for a shareholder on the 30% marginal tax rate. The franking credit represents pre-paid corporate tax that offsets the investor’s personal tax liability.
| Franking Status | Meaning | Investor Benefit |
|---|---|---|
| Fully franked | Full corporate tax already paid on earnings | Full franking credit offset; excess refundable for retirees, SMSFs in pension phase, and low-income earners |
| Partially franked | Partial corporate tax paid | Proportional credit offset; smaller tax reduction |
| Unfranked | No corporate tax paid (e.g., foreign income or trust structures) | No franking credit; taxed at investor’s full marginal rate |
A dividend reinvestment plan (DRP) gives shareholders the option to receive additional shares instead of a cash dividend payment. The mechanics follow a straightforward cycle:
No brokerage is charged on DRP shares, a structural cost advantage over accumulating shares through market purchases. Some companies have historically offered DRP shares at a 1-2.5% discount to the market price, though no comprehensive verified list of discounted DRPs for 2025-2026 is currently available. Investors should check individual company ASX announcements for current terms.
The compounding dynamic is where DRPs become genuinely powerful. On a fully franked stock, the grossed-up dividend value, not just the cash yield, feeds into the reinvestment cycle. Over years, the effect of reinvesting at zero brokerage on a progressively larger holding produces returns that a static cash-yield approach cannot replicate. Rural Funds Group (RFF), with a 5.78% current yield and inflation-linked distribution guidance, represents the type of structure where DRP compounding aligns well with long-term wealth accumulation.
DRP compounding and franking credits working together over a two-year period on a single holding can produce total returns that are roughly 20 percentage points higher than what the share price chart alone records, as CBA demonstrated between April 2024 and April 2026 when a 52.5% price gain became an estimated 72% total return once reinvested fully franked dividends were included.
DRPs are best suited to investors in the accumulation phase, those building a portfolio over years rather than drawing income from it today. For retirees relying on dividends as a living expense, taking cash is the more practical choice.
One administrative consideration: each DRP share parcel creates a separate cost base for capital gains tax (CGT) purposes. Over a decade of quarterly or semi-annual reinvestments, that creates a substantial record-keeping obligation at the point of sale. Maintaining accurate records from the outset avoids a significant headache later.
A dividend trap is a stock where the headline yield looks attractive but reflects a falling share price, an unsustainable payout, or a one-off special dividend that will not repeat. The resource sector provides the sharpest illustration of how this plays out across a full commodity cycle.
| Stock | Peak Yield (Approx.) | Current Yield (2025) | Yield Change |
|---|---|---|---|
| New Hope Corp (NHC) | 9.92% | 3.62% | -6.30 percentage points |
| Woodside Energy (WDS) | 8.40% | 4.68% | -3.72 percentage points |
| Yancoal Australia (YAL) | 6.39% | 2.47% | -3.92 percentage points |
Investors who built income portfolios around those peak-cycle yields experienced income cuts of 40-60% as commodity prices normalised. The yield was real at the time; the sustainability was not.
Income ETF total return data exposes the same yield trap dynamic that applies to individual stocks: dividend harvesting products on the ASX delivered five-year annualised returns of 8.8% against a comparable passive fund’s 14.4%, a gap driven by capital cannibalisation that headline distribution figures never reveal.
Prestal Holdings (PTL) carried a trailing twelve-month yield of 98.59% at one point, a figure driven entirely by a one-off special dividend. The company’s forward yield is 0%. No regular dividend is currently paid. That single data point illustrates how dramatically headline yield figures can mislead.
REITs present a different form of risk. Abacus Group (ABG, 8.21%) and Cromwell Property Group (CMW, 7.41%) sit at the higher end of distribution yields, but their sensitivity to interest rate movements means both income levels and unit prices can shift materially as the rate environment changes.
The four most common mistakes ASX dividend investors make:
A resilient income portfolio draws from multiple sector buckets, each with different economic drivers. Concentration in any single sector, whether banks, resources, or REITs, increases vulnerability to a downturn that hits that sector in isolation.
The four sector buckets:
| Stock (Ticker) | Sector Bucket | Current Yield | Franking | Sustainability Note |
|---|---|---|---|---|
| NAB (NAB) | Financial income | 4.27% | Fully franked | Prudent management; better yield among majors |
| Shaver Shop (SSG) | Defensive income | ~6.96% fwd | Fully franked | ~10% grossed-up; strong free cash flow |
| Rural Funds Group (RFF) | Property income | 5.78% | None (trust) | Inflation-linked; guided distribution growth |
| Helia Group (HLI) | Financial income | ~5.96% | Fully franked | Earnings cover ~2.79x; excludes specials |
The quality-over-yield principle runs through every sector decision. A portfolio of 5-6% fully franked yields from well-covered businesses will, over time, outperform a portfolio of 10%+ yields from companies at cyclical peaks or under earnings pressure. Analysts in 2025 have specifically cautioned against over-concentration in banks and miners as the backbone of income portfolios.
This checklist is a starting filter, not a substitute for full research or licensed financial advice.
The investors who generate sustainable income from ASX dividends over years share one common characteristic: they evaluate quality first and yield second. Franking credits, earnings cover, sector diversification, and DRP compounding are the levers that make the Australian system genuinely powerful for long-term wealth building, but each lever requires discipline to use correctly.
The distinction matters at every stage. An accumulation-phase investor benefits most from DRP participation, fully franked compounding, and a total return focus that captures both income and capital growth. An income-phase investor, drawing a living from dividends, prioritises cash yield, franking credit value (particularly where ATO refunds apply), and sustainability over growth.
Quality over yield: a fully franked 4.27% cash yield that grosses up to 6.1% from a well-covered business is a stronger long-term income foundation than a 10% yield from a company at the top of its earnings cycle.
Current term deposit rates of approximately 4-5% in the 2025-2026 environment mean the yield advantage of dividend stocks is narrower than in prior years. That makes quality even more important. Shaver Shop’s grossed-up yield of approximately 10%, backed by strong free cash flow and full franking, represents the kind of genuine high yield that can outperform fixed-rate alternatives over time. Chasing a headline number without the fundamentals behind it does not.
The practical next step: audit any existing income holdings against the checklist in the previous section. Verify every yield figure at current prices. And treat ASX dividend investing for what the system rewards: patience, diversification, and discipline over the long term.
Investors wanting to build resilience beyond yield selection will find our comprehensive walkthrough of portfolio construction for volatile ASX markets, which covers a three-layer framework spanning cash, income-generating bonds, and diversified equities, with specific guidance on how dollar-cost averaging and tax-loss harvesting create structural advantages during drawdowns.
This article is for informational purposes only and should not be considered financial advice. Investors should conduct their own research and consult with financial professionals before making investment decisions. Past performance does not guarantee future results.
Dividend investing in Australia involves buying ASX-listed shares that pay regular income distributions, with a unique structural advantage: the franking credit system, which allows investors to claim a credit for corporate tax already paid on profits, boosting the effective after-tax yield compared to most global markets.
Franking credits represent corporate tax already paid by an Australian company on its profits; when you receive a fully franked dividend, those credits offset your personal tax liability, and if your credits exceed your tax bill, the excess is refundable. For example, NAB's fully franked 4.27% cash yield grosses up to approximately 6.1% for an investor on the 30% marginal tax rate.
The ex-dividend date is the first trading day on which buyers of a stock will not qualify for the upcoming dividend payment; because the ASX operates on a T+2 settlement cycle, investors must purchase shares at least one business day before the ex-dividend date to appear on the share register in time to receive the payment.
Check the payout ratio (ideally below 60-70%) and earnings cover (preferably above 1.5x); a company like Helia Group with a payout ratio of around 35.87% and earnings cover of approximately 2.79x signals a much more sustainable dividend than one sitting at the threshold, where a downturn could force a cut.
A dividend reinvestment plan (DRP) lets shareholders receive additional shares instead of cash, with no brokerage charged and sometimes at a small discount to market price; DRPs are best suited to accumulation-phase investors building long-term wealth, while those relying on dividends for living expenses are generally better served by taking cash.