How to Value Stocks When the Future Looks Nothing Like Today
22 mins ago

At $411.79 per share and a forward P/E of 85-95x, Tesla is priced as though its robotics and autonomous vehicle businesses already exist at scale. They do not yet. That gap between current price and unproven future is exactly where investment risk lives, and it is exactly where stock valuation analysis earns its keep.
Tesla’s Q1 2026 earnings, reporting revenue of $22.39 billion, gross margin of 19.2%, and adjusted EPS of $0.41, reignited the debate that has defined this stock for years. The disagreement is not really about whether Tesla is a good company. It is about whether the entry price today gives an investor a fair shot at a return given the range of outcomes that could plausibly materialise. That question applies to every high-multiple growth stock, not just this one.
This guide uses Tesla’s current valuation as a live classroom. It walks through the core valuation methods, shows how to build bull and bear case scenarios using real assumptions, and explains why entry price is often the single most consequential variable an investor controls. The framework that follows is repeatable; it applies to any company in transition.
This article is for informational purposes only and should not be considered financial advice. Investors should conduct their own research and consult with financial professionals before making investment decisions.
The instinct is reasonable: pull up the P/E ratio, compare it to a peer, and draw a conclusion. For a mature business with stable earnings, that instinct works. For a company straddling two or three different business identities at once, it quietly breaks down.
Tesla is simultaneously operating as:
Each segment warrants a different methodology. Applying a single ratio across all three produces a number, but not a useful one.
Tesla trades at a forward P/E of 85-95x. Toyota trades at approximately 8x. That gap does not mean one company is overvalued and the other is cheap. It means the market is embedding a substantial probability-weighted premium for businesses that do not yet generate material revenue.
Peer group selection shapes the entire output of a comparative valuation: framing Tesla as an automaker implies a 12-18x forward P/E benchmark, while framing it as an AI and technology platform implies a 55-75x benchmark, and neither framing is objectively wrong because each reflects a different thesis about which business the company will primarily inhabit at the end of the holding period.
The analyst spectrum reflects this uncertainty. Barclays (Dan Levy) held a price target near $360 in early 2026. Morgan Stanley maintained an Overweight rating with targets in the $420-$500 range. ARK Invest has published bull case scenarios extending far higher. These are not failures of analysis. They are different answers to the same unanswerable question: which business will Tesla primarily be in a decade?
Understanding why transitional companies break standard ratios is the prerequisite for every step that follows. Without it, the tools produce false precision.
Four instruments sit in the valuation toolkit. Each measures something specific, each works under certain conditions, and each fails in ways that matter for a company like Tesla.
| Method | Formula | Best Used When | Key Limitation |
|---|---|---|---|
| P/E Ratio | Stock Price ÷ Earnings Per Share | Company is profitable with stable, representative earnings | Distorted when earnings are suppressed, cyclical, or in transition |
| P/S Ratio | Market Cap ÷ Annual Revenue | Earnings are negative or unreliable; common for growth-stage companies | Ignores profitability entirely; two companies with identical revenue can have vastly different margins |
| EV/EBITDA | Enterprise Value ÷ EBITDA | Comparing companies with different capital structures or in acquisition analysis | Less informative for high-growth companies where capital expenditure is consuming most EBITDA |
| DCF | Sum of projected free cash flows discounted to present value | Estimating intrinsic value over a multi-year horizon using explicit assumptions | Highly assumption-sensitive; terminal value can represent 70-80% of total output |
Tesla’s market capitalisation of approximately $1.453 trillion against a Q1 2026 annualised revenue run rate of roughly $90 billion places the company’s P/S ratio far outside traditional automotive valuation ranges. The P/E, at 85-95x forward earnings, tells a similar story: this is not a stock being valued on current results. The price reflects a bet on what comes next.
That leaves DCF as the method best equipped to handle the question. It is also the most dangerous.
A DCF model is theoretically correct: the value of any asset is the present value of the cash it will generate in the future. The problem is practical. For a company like Tesla, where terminal value assumptions about robotics and autonomous vehicles can represent the majority of the model’s output, small changes in inputs produce enormous swings in the answer.
If the discount rate shifts by 1 percentage point, or the long-term growth assumption changes by 2 percentage points, the model output can move by more than $100 per share. Two analysts using the same framework, the same revenue projections, and nearly identical inputs can arrive at valuations that differ by 50% or more.
This is precisely why scenario-based analysis, rather than a single DCF point estimate, has become the practitioner standard for transitional growth stocks. The next section builds that framework.
Scenario analysis does not predict which future will arrive. Its value lies in a different discipline: making assumptions explicit, bounded, and testable, so an investor can see exactly what has to be true for the price to be justified.
The standard framework uses three scenarios, bull, base, and bear, each built on internally consistent assumptions about revenue growth, margin trajectory, and the exit multiple the market might assign at the end of the holding period.
For Tesla, the inputs look like this:
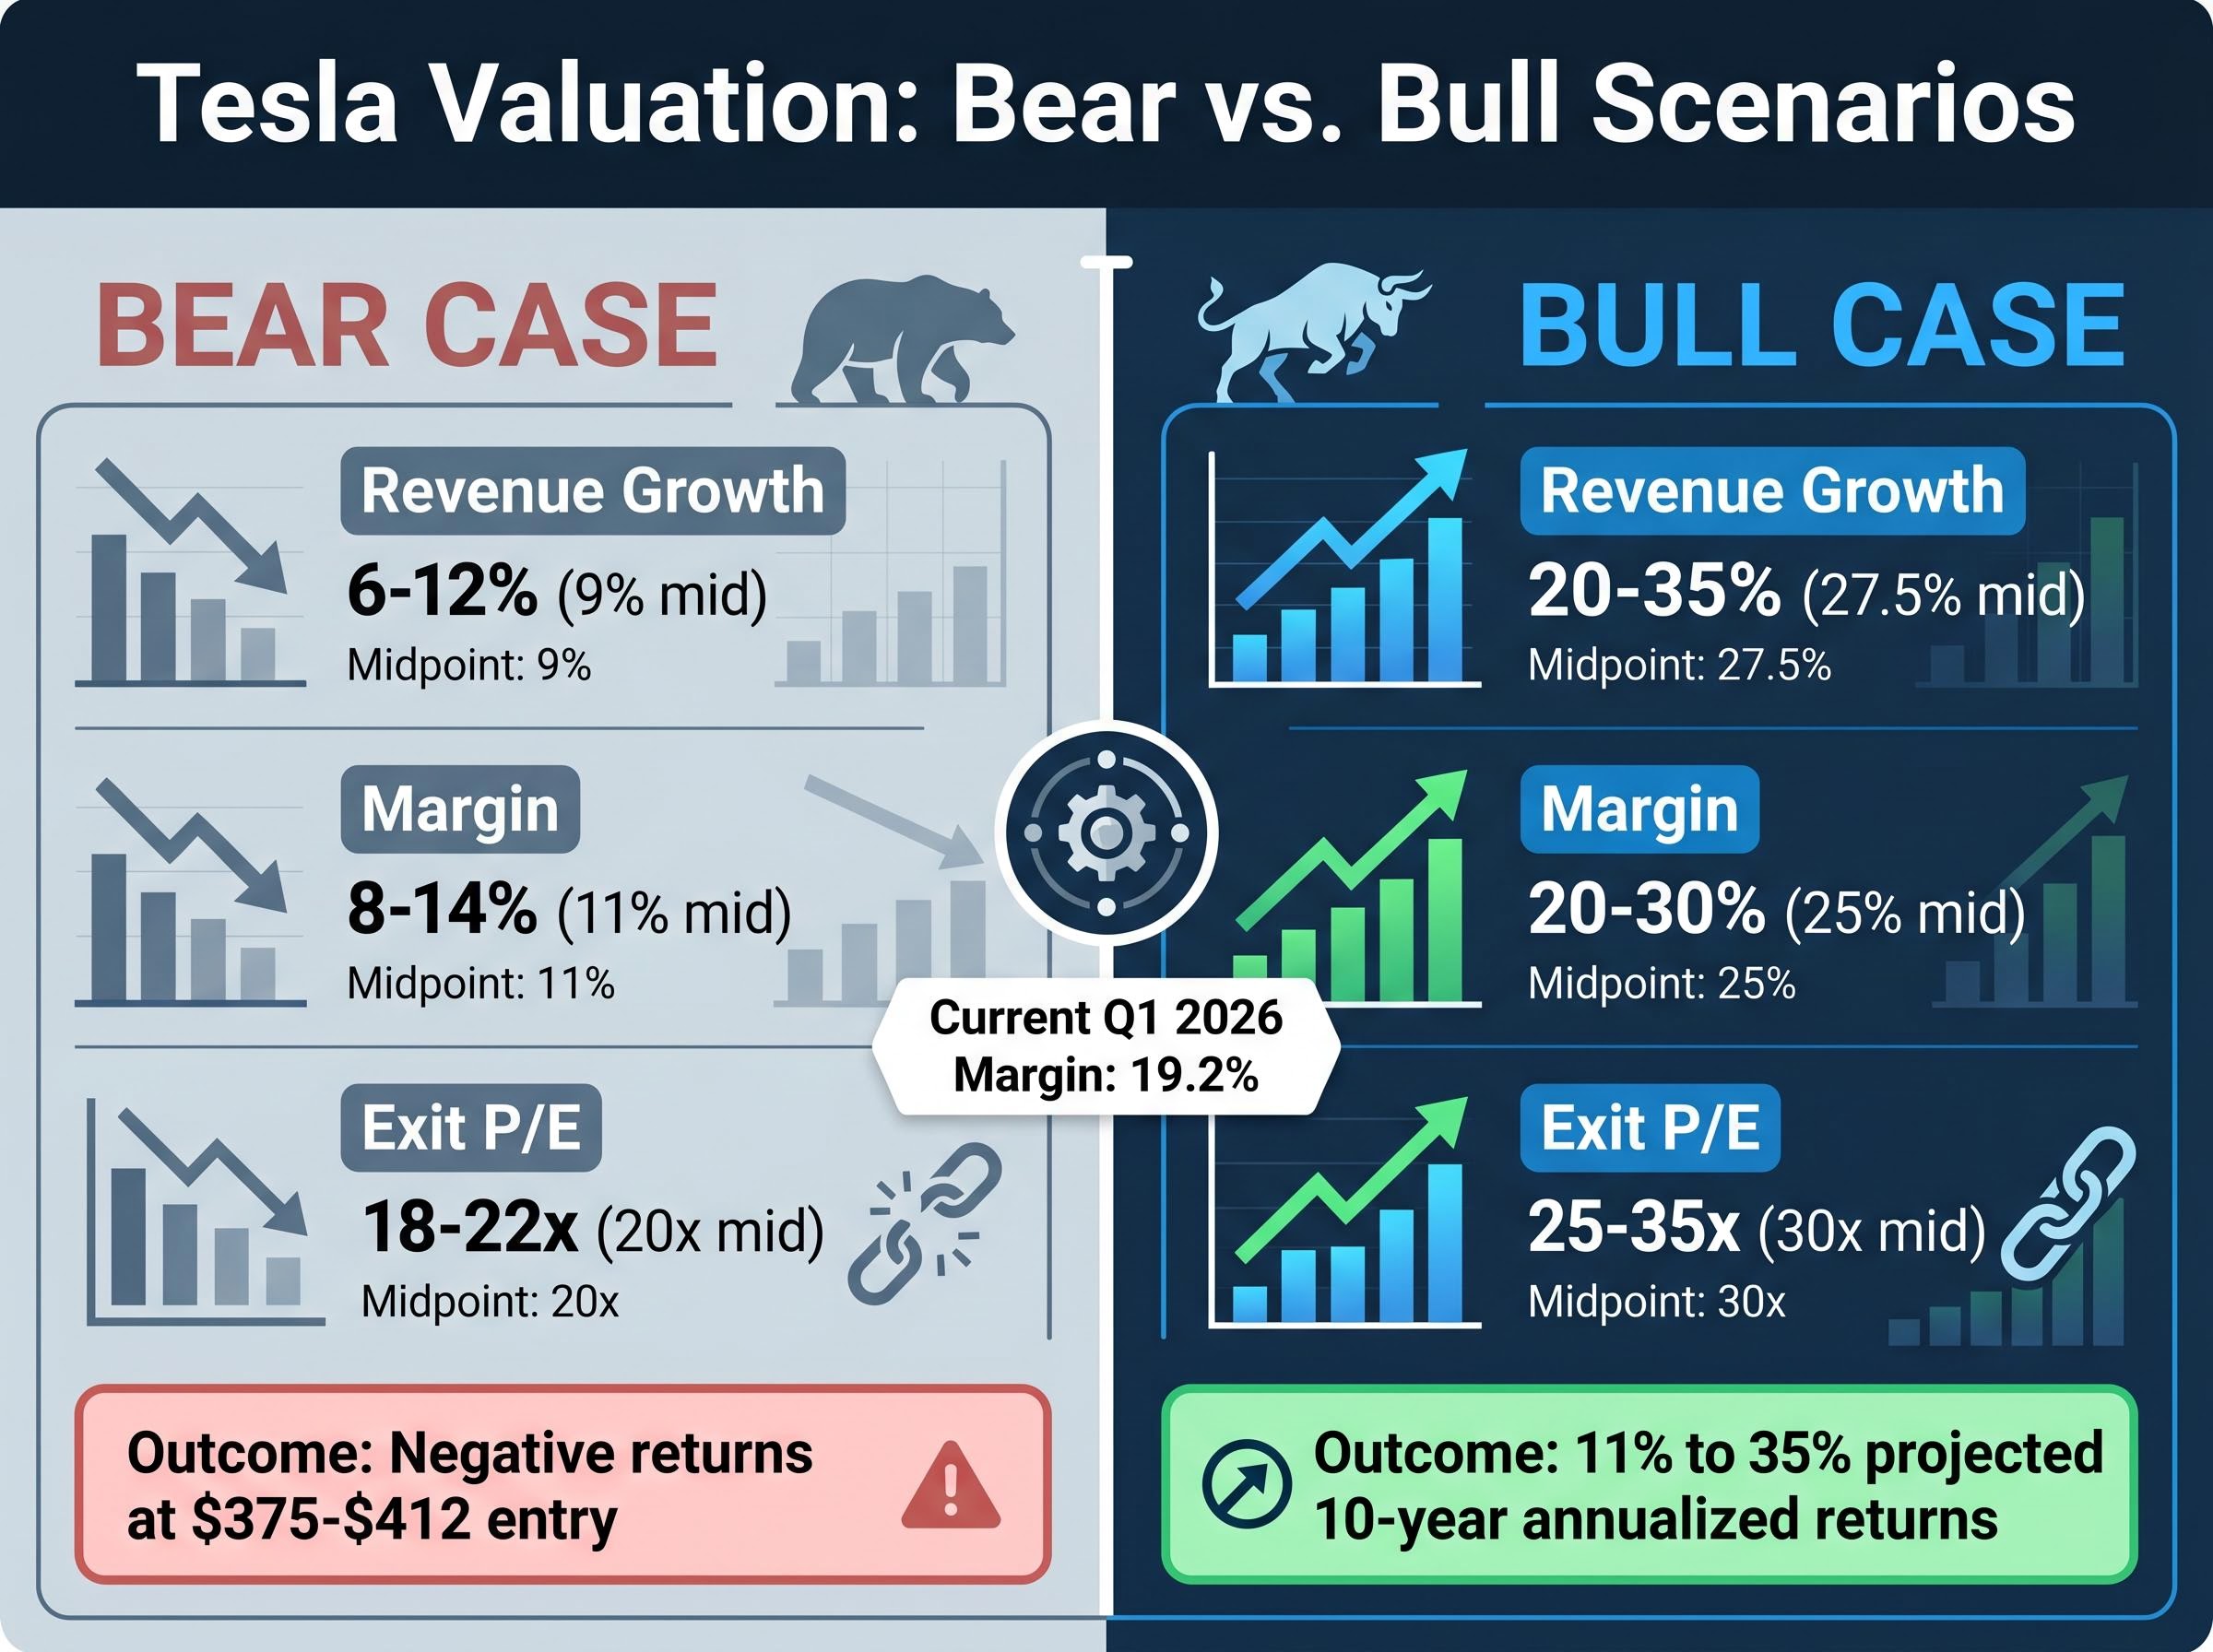
| Assumption Variable | Bear Case Range | Bear Case Midpoint | Bull Case Range | Bull Case Midpoint |
|---|---|---|---|---|
| Revenue Growth (Annual) | 6-12% | 9% | 20-35% | 27.5% |
| Net Profit Margin | 8-14% | 11% | 20-30% | 25% |
| Exit P/E Multiple | 18-22x | 20x | 25-35x | 30x |
The bear case assumes Tesla remains primarily an automaker. Revenue grows, but at rates consistent with a maturing EV market facing price competition. Margins compress toward industry norms. The exit multiple reflects a premium auto company, not a technology platform. Under these assumptions, every projected return outcome is negative at an entry price near $375-$412.
The bull case assumes the AI and robotics transition materialises substantially. Robotaxi revenue begins at scale, Optimus generates third-party income, and margins expand as software-like economics take hold. Under these assumptions, projected 10-year annualised returns range from approximately 11% to 35%.
The asymmetry is stark. Tesla’s Q1 2026 gross margin of 19.2% sits closer to the bear case margin range than the bull case. Forward analyst EPS estimates project earnings growing more than 5x from current levels, which is the bull case already embedded in the multiple.
At entry prices above $400, all bear case return outcomes are negative. Bull case outcomes require the AI and robotics transition to materialise substantially. The question for any investor is not which scenario they believe in, but how much probability they assign to each.
The full bull case, a complete AI and robotics platform at scale, carries an estimated probability of roughly 5-10%. That figure is not a dismissal. It is an acknowledgement that the most extraordinary outcomes are, by definition, the least likely, and that expected value calculations must account for that.
Past performance does not guarantee future results. Financial projections are subject to market conditions and various risk factors.
An investor cannot control whether Tesla achieves Level 4 autonomy, whether Optimus ships at scale, or whether margins expand. The one variable entirely within an investor’s control is the price paid to enter the position.
Entry price shapes returns through three distinct mechanisms:
At elevated multiples, even a correct long-term thesis can produce a poor return if too much of the future is already priced in. The entry price determines which scenarios need to materialise for the investment to work.
A 20% revenue miss at Tesla’s current multiple would disproportionately compress returns relative to a similarly sized miss at a 10x P/E stock. The sensitivity runs in both directions, but the downside convexity at high multiples is what makes entry price the single most actionable variable in any valuation framework.
Building scenarios is the first discipline. Stress-testing them is the second. The goal is to identify, before entering a position, which specific risks carry the most power to invalidate the bull case at the current entry price.
For Tesla, four categories carry the most weight:
Waymo’s weekly ride volume data, reported at approximately 500,000 rides as of March 2026 across its active commercial cities, reflects a competitor that has already navigated the regulatory and operational challenges Tesla’s robotaxi business has yet to face at equivalent scale.
The California DMV autonomous vehicle permit requirements establish a staged progression from supervised testing to driverless testing before any manufacturer can apply for a commercial deployment permit, a distinction that places Tesla’s current driverless testing permit several regulatory steps short of public robotaxi authorisation.
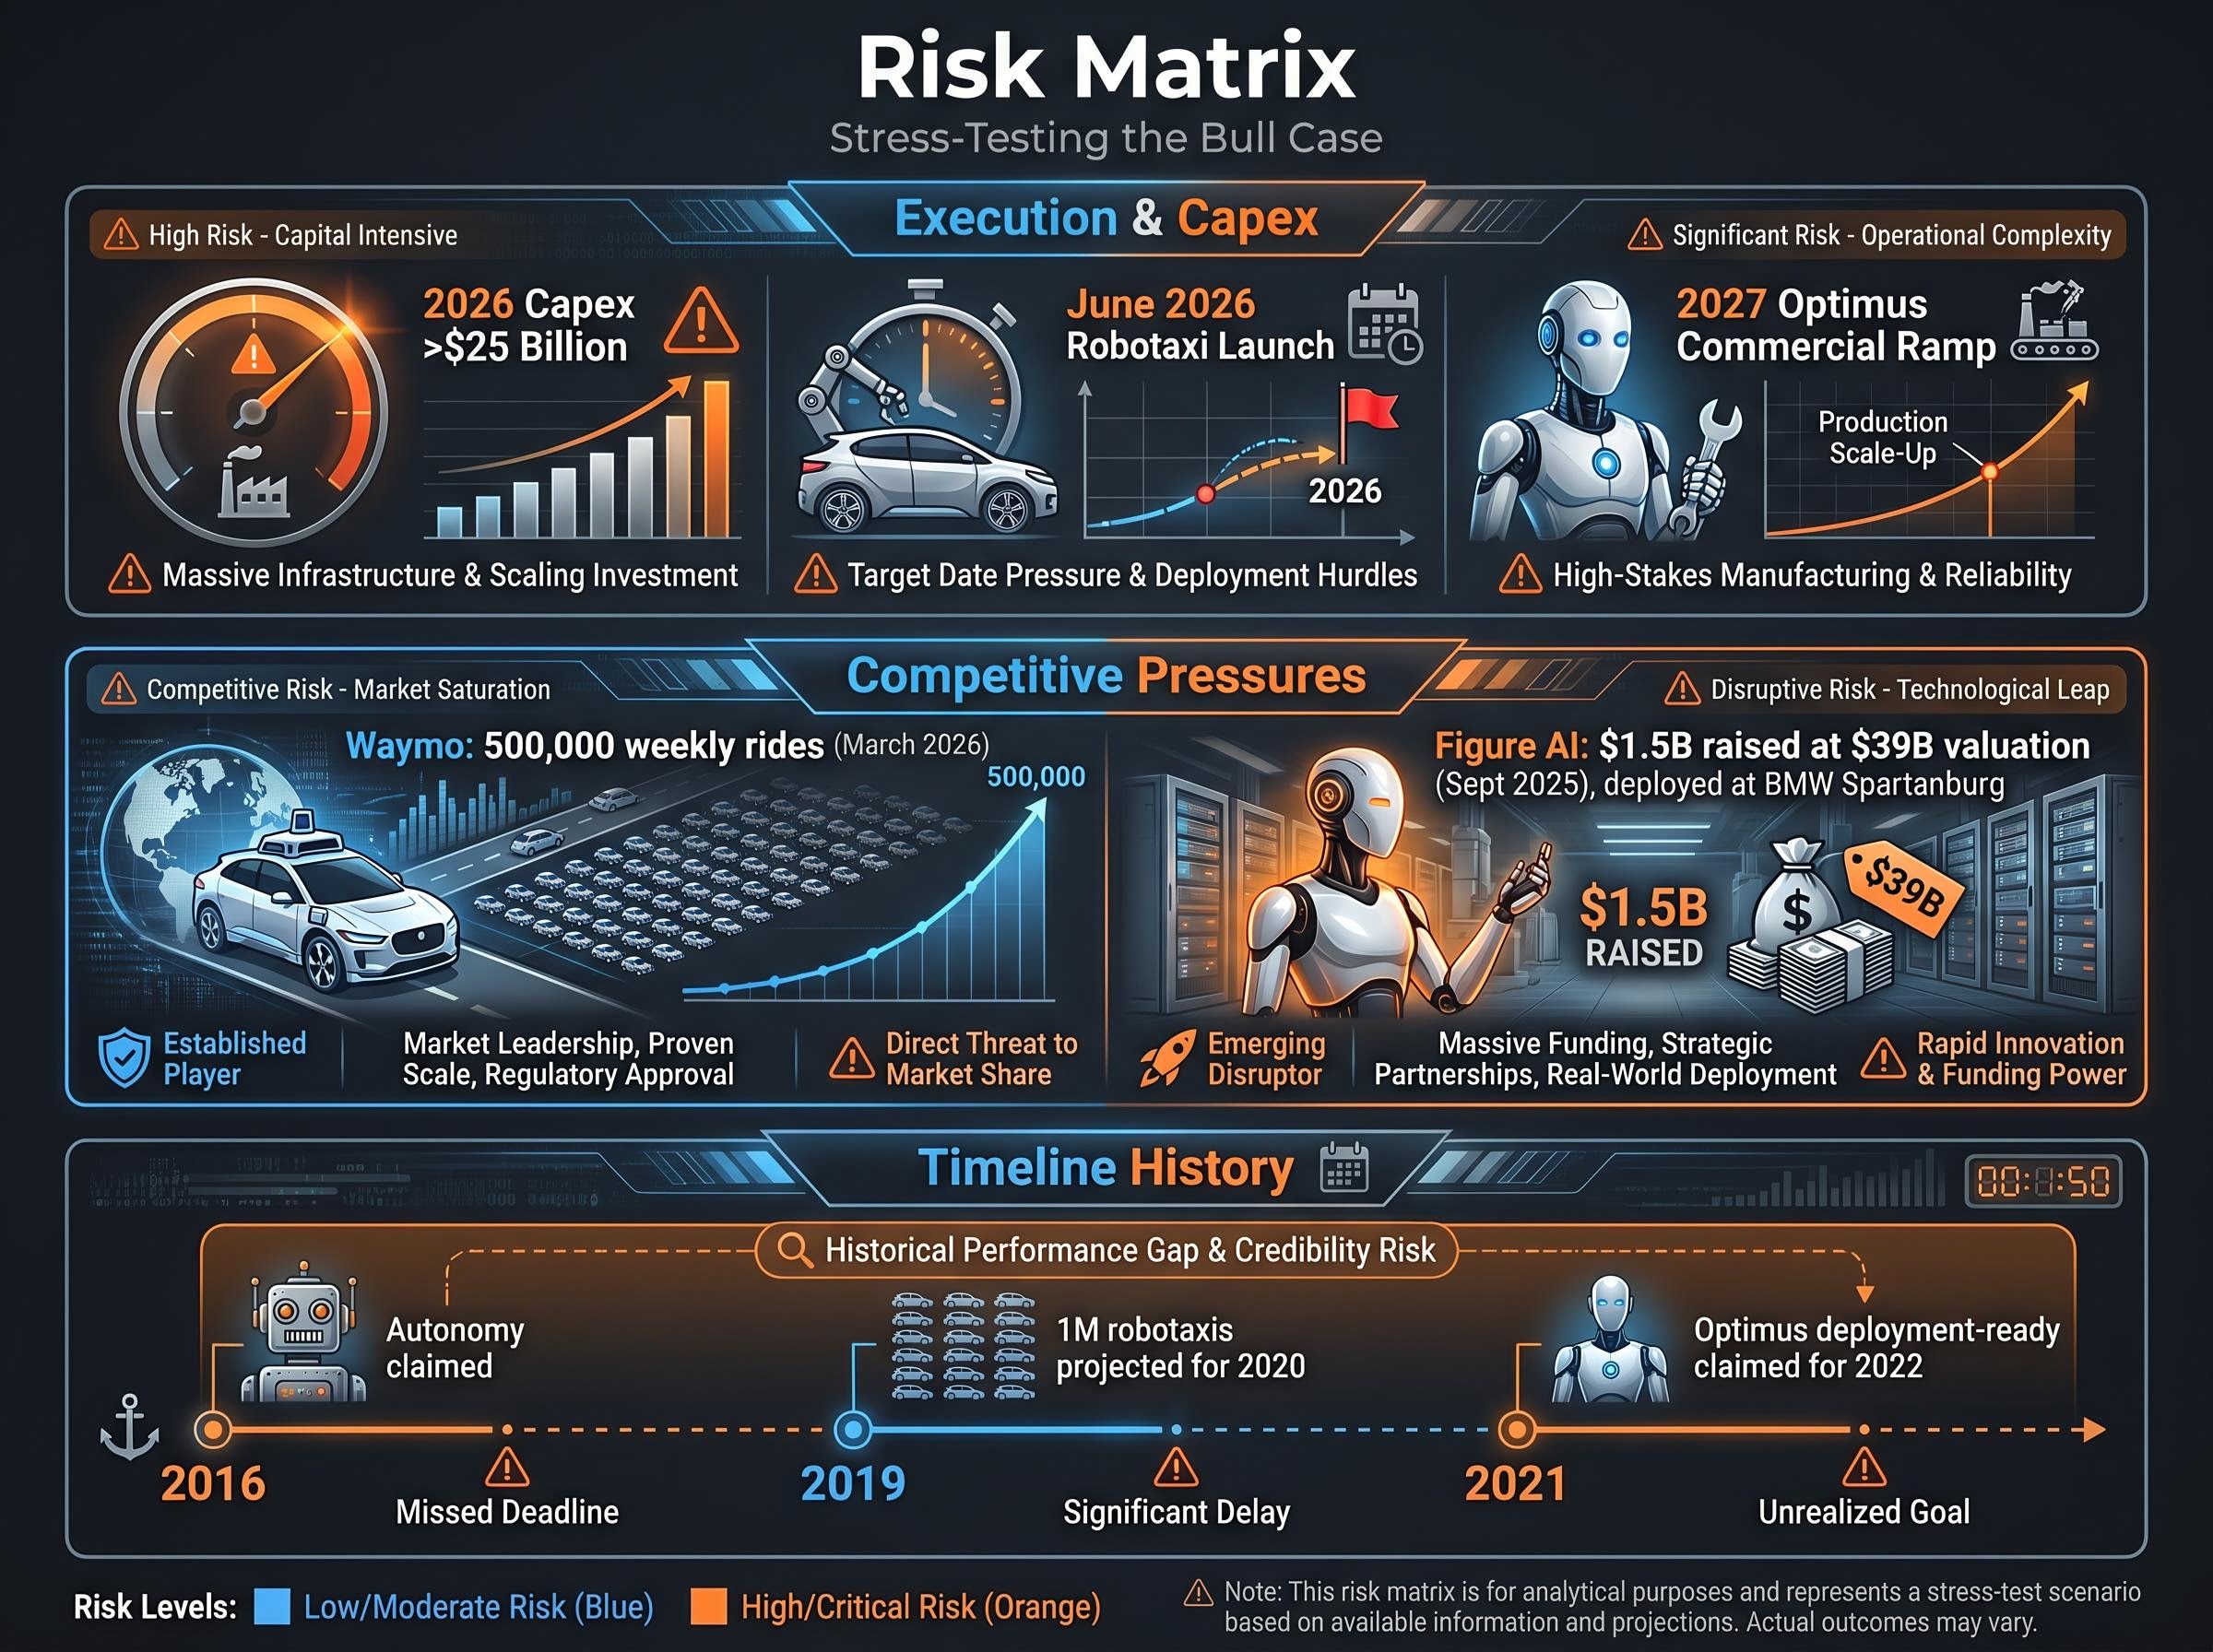
Elon Musk’s historical timeline pattern is a relevant input for probability weighting. Full hardware autonomy was claimed in 2016. One million robotaxis by 2020 were projected in 2019. Optimus was described as deployment-ready in 2021 for a 2022 timeline. The pattern is consistent: the core innovations have materialised, but consistently later than announced.
Precise probability estimates are less important than directional discipline. The question is not “what is the exact probability of the bull case?” It is “which scenario requires the most things to go right simultaneously?” That scenario warrants lower probability, regardless of the specific number assigned.
A practical approach is a checklist. For each milestone the bull case requires (robotaxi commercial launch, Optimus third-party revenue, margin expansion above 20%), note whether current evidence, regulatory filings, production data, and financial results, is trending toward or away from achievement.
This converts probability weighting from guesswork into an evidence-based review process that can be updated quarterly as new data arrives.
Monitoring triggers, predefined metrics such as auto gross margin thresholds, robotaxi regulatory filing milestones, and Optimus production run rates, convert the probability-weighting exercise from a one-time entry decision into a repeatable quarterly review process that evolves as evidence accumulates.
These statements are speculative and subject to change based on market developments and company performance.
Tesla made the framework visible, but the methodology is portable. Any company trading at a multiple that embeds an unproven future, whether in AI, biotechnology, clean energy, or any sector in transition, warrants the same structured approach.
The six-step process:
The key data sources for U.S. investors are SEC EDGAR for primary filings, company investor relations sites for earnings releases, and platforms like Yahoo Finance for aggregated data. The tools are free. The discipline is the differentiator.
For investors building the scenario framework outlined above, our full explainer on reading earnings reports critically walks through how to identify non-GAAP manipulation, spot buried guidance cuts, and extract the raw inputs needed to update bull, base, and bear assumptions each quarter, using a six-step process completable in 20 minutes with free tools including SEC EDGAR and Yahoo Finance.
The investor who builds explicit scenarios does not know more about the future than anyone else. They know exactly what they are paying for, and what has to be true for the price to be justified.
Tesla is a compelling case study not because it is unique, but because it makes visible a challenge present in every high-multiple growth stock. The investor must decide how much of an unproven future they are willing to pay for today.
The bull case, an AI and robotics platform operating at scale, is a genuinely extraordinary scenario that could justify an extraordinary price. But the probability-weighted expected value at current prices requires most things to go right: robotaxi launch on schedule, Optimus generating third-party revenue by 2027, margins expanding well above 19.2%, and no sustained competitive displacement from Waymo, Figure AI, or others.
At $411.79 and 85-95x forward P/E, the margin of safety under bear case assumptions is thin to nonexistent. That does not make Tesla a bad company. It makes the entry price a high-conviction bet on a specific future.
AI stock valuations across the broader market face a structurally similar challenge: the Shiller CAPE ratio stood at 40.11 as of May 2026, a level historically reached only at the dot-com peak, and four major analytical frameworks including Minsky, Kindleberger, Sharma, and Shiller CAPE deliver split verdicts on whether record Nasdaq 100 gains reflect genuine AI revenues or speculative excess built on projected productivity that has not yet appeared in corporate earnings.
U.S. investors can access primary financial data through SEC EDGAR and apply the six-step scenario framework outlined above to any high-multiple stock before establishing or adding to a position. The framework does not eliminate uncertainty. It ensures the investor understands precisely what the market is asking them to believe, and at what price.
Stock valuation analysis is the process of estimating a company's intrinsic worth using methods like P/E ratios, price-to-sales, EV/EBITDA, and discounted cash flow models. It matters because the price an investor pays relative to that estimated value is often the single most consequential variable determining long-term returns.
A discounted cash flow (DCF) model estimates a company's value by projecting future free cash flows and discounting them back to a present value using a chosen discount rate. For transitional companies like Tesla, small changes in growth or discount rate assumptions can shift the output by more than $100 per share, which is why scenario-based DCF analysis with bull, base, and bear cases is the practitioner standard.
At elevated multiples like Tesla's forward P/E of 85-95x, even a correct long-term thesis about a company's business can produce poor returns if the future is already priced in, a process called multiple compression. Entry price also determines how much margin of safety an investor holds if the bull case assumptions fail to materialise on schedule.
A scenario analysis involves defining internally consistent assumptions for revenue growth, net profit margin, and an exit multiple under optimistic and pessimistic conditions, then calculating projected returns at the current entry price under each scenario. The discipline is not to predict which scenario will occur, but to make assumptions explicit so investors can see exactly what must be true for the price to be justified.
U.S. investors can access primary financial data including 10-K and 10-Q filings through SEC EDGAR at no cost, supplement with company investor relations pages for earnings releases, and use platforms like Yahoo Finance for aggregated ratio data such as P/E, P/S, and EV/EBITDA to build their own valuation scenarios.