Why Seeing Machines Trades Below 5p Despite EU Mandate Wins
3 hrs ago

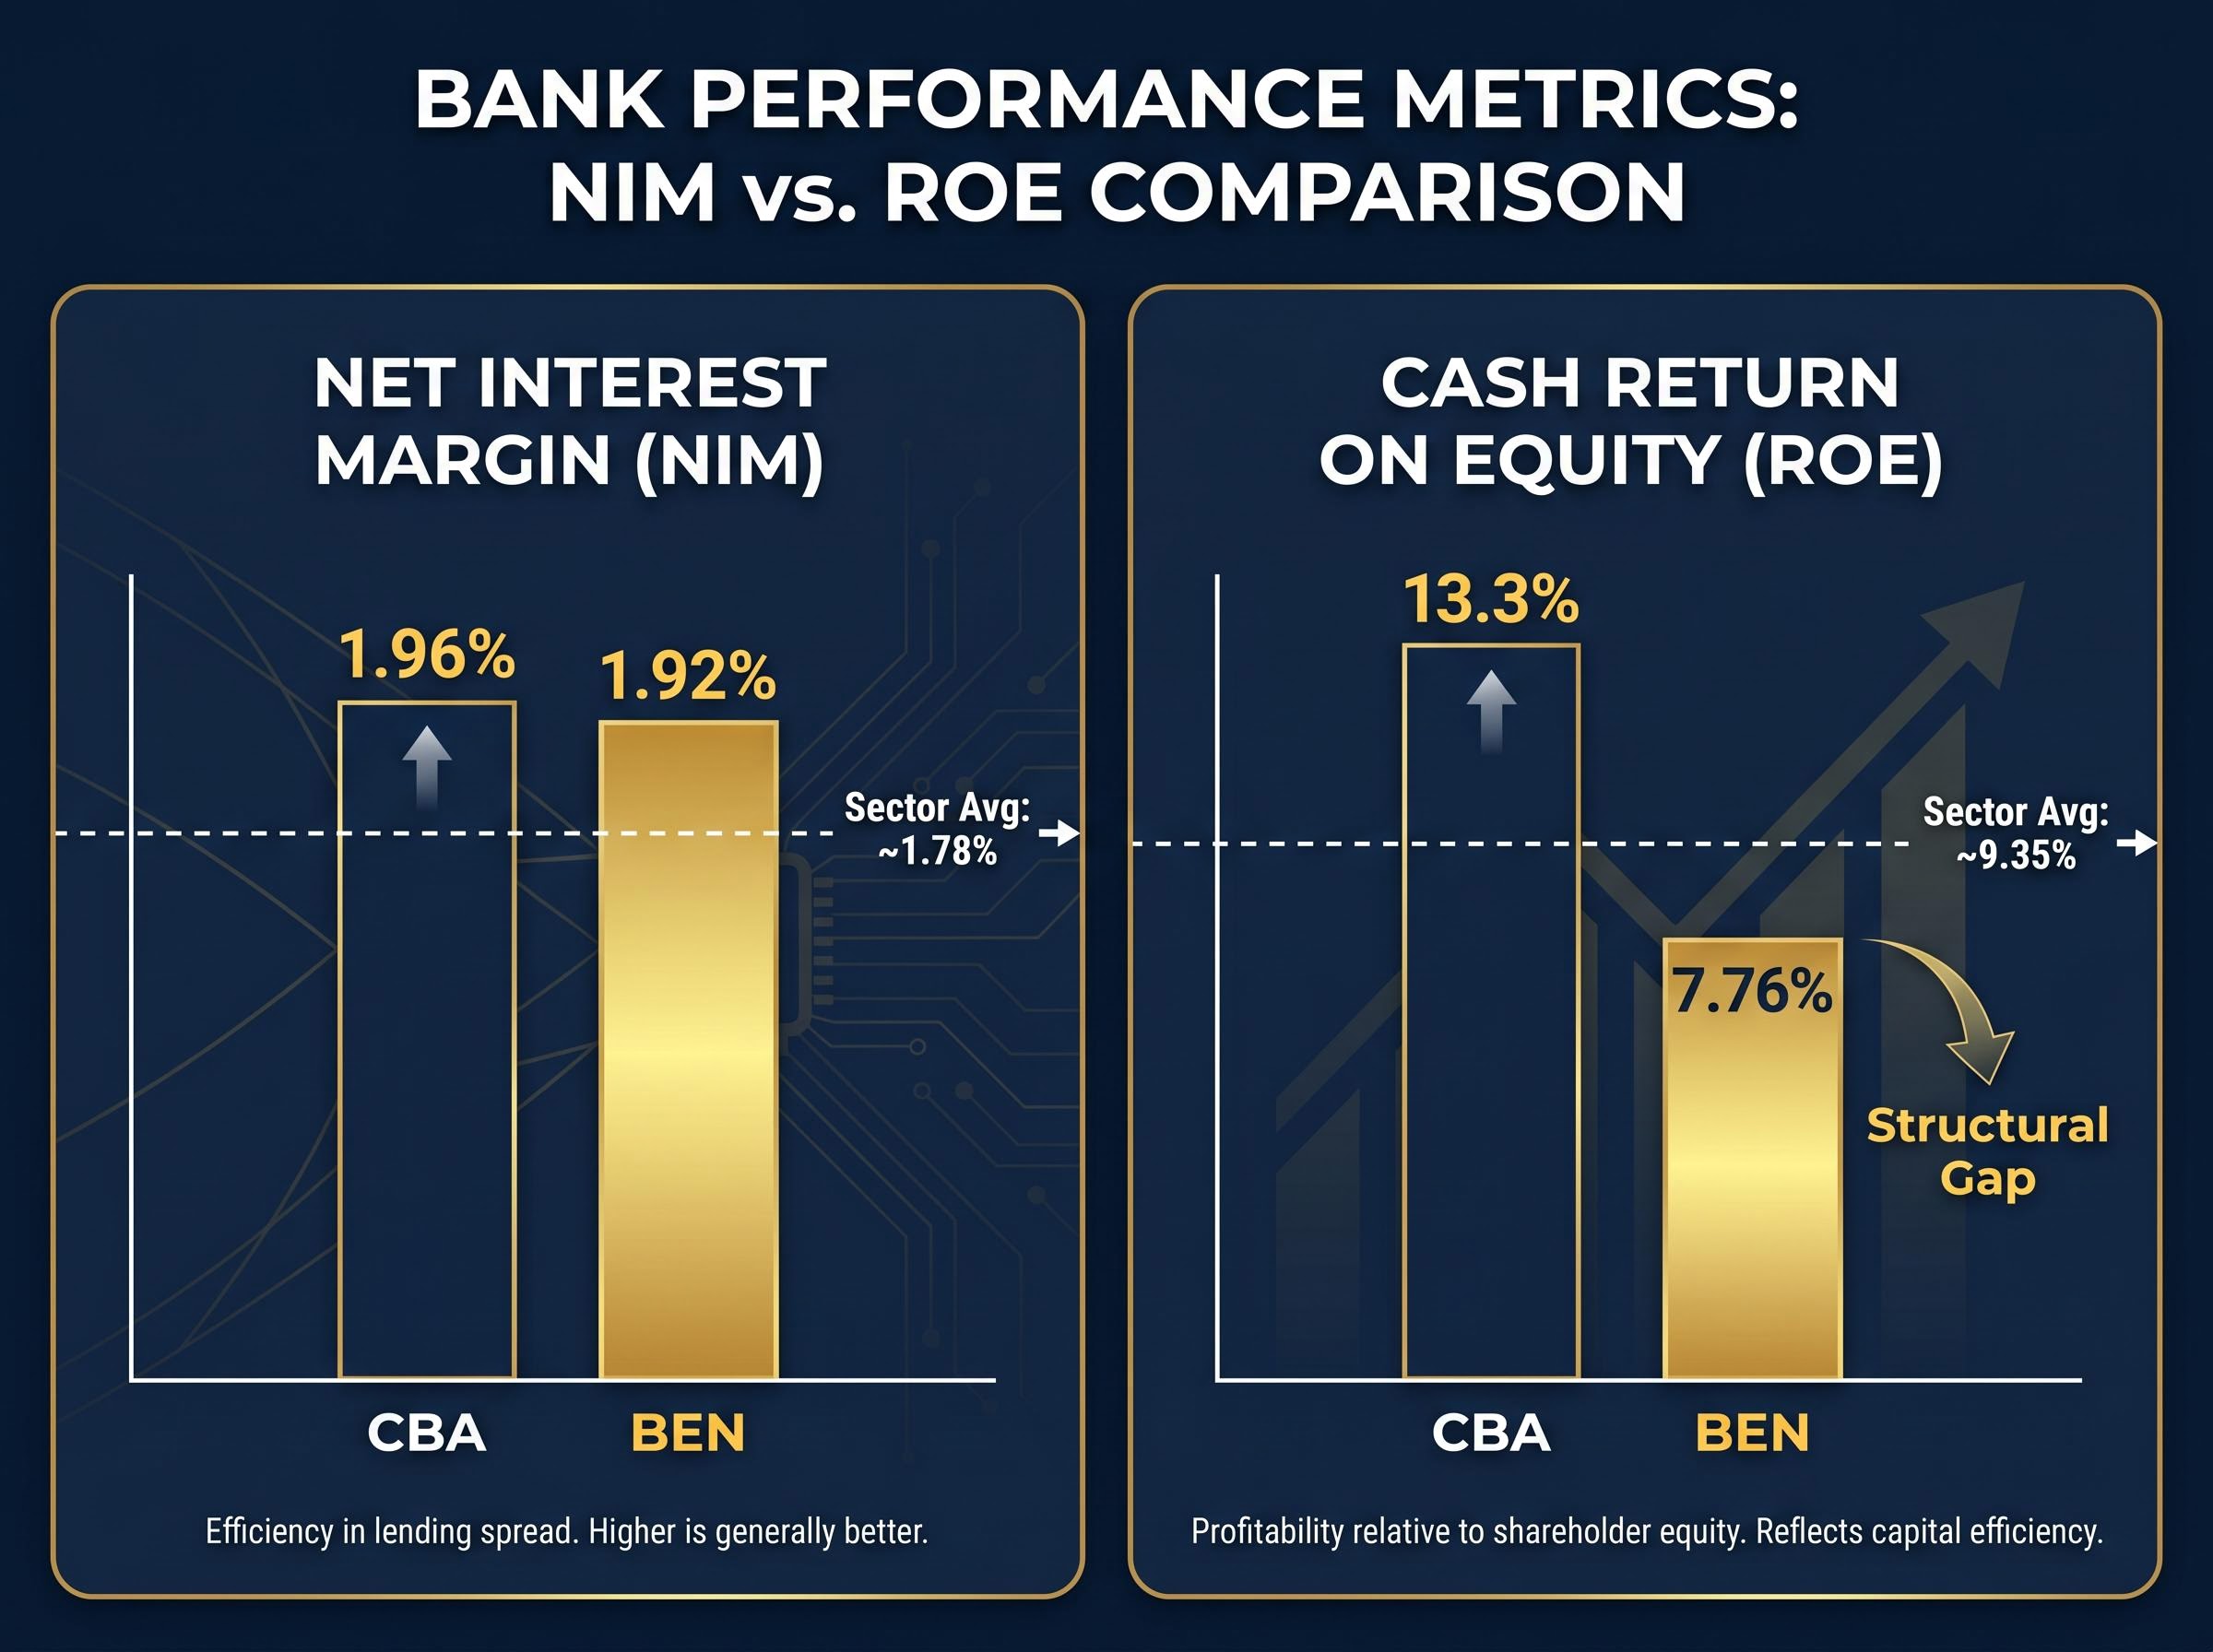
Bendigo and Adelaide Bank reported a 1H FY26 net interest margin of 1.92%, placing it above most ASX banking peers. Its cash return on equity of 7.76% tells a different story, trailing the major banks by 3 to 5 percentage points. That tension, strong margin but weak capital returns, is the central question for any investor sizing up the bank’s fundamental quality.
With BEN shares trading around $10.40 as of May 2026, and the bank having reported its half-year results in February, this is an active decision moment for Australian equity investors. Raw valuation metrics tell one part of the story. Fundamental operating quality, measured through net interest margin (NIM), return on equity (ROE), and Common Equity Tier 1 (CET1) capital relative to peers, tells another.
This analysis maps BEN’s three core financial health indicators against six ASX banking peers, explains what each metric reveals about competitive position, and draws a clear-eyed assessment of where the bank sits on the quality spectrum, distinct from whether the share price is cheap.
The headline number is genuinely encouraging. BEN’s 1.92% NIM in 1H FY26 ranks fourth among the seven ASX banks tracked here, above Westpac (1.82%), NAB (approximately 1.74%), ANZ (1.68%), and BOQ (1.64%). Only CBA (1.96%) and Suncorp Bank (1.93%) outperform. Against an indicative sector average of approximately 1.78% (calculated by Rask), BEN sits comfortably above the middle of the pack.
Deposit pricing discipline and asset mix explain much of BEN’s positioning. Lending income accounts for approximately 87% of total revenue, and the bank’s regional and community deposit base has provided a funding cost advantage relative to some peers.
| Bank | NIM (Most Recent) | Period |
|---|---|---|
| CBA | 1.96% | 1H FY26 |
| Suncorp Bank | 1.93% | 1H FY25 |
| BEN | 1.92% | 1H FY26 |
| Westpac | 1.82% | 1Q FY25 |
| NAB | ~1.74% | 1Q FY25 |
| ANZ | 1.68% | 1Q FY25 |
| BOQ | 1.64% | 1H FY25 |
The ranking is real, but the trajectory carries a caveat.
BEN management has indicated that margins are “likely to be slightly lower in the second half” of FY26, citing competitive pricing pressure across mortgages and term deposits.
An above-average NIM today is not the same as a durable NIM advantage. How much of that margin holds through the cycle is the question that matters.
A bank earns money on the spread between what it charges borrowers and what it pays depositors and wholesale lenders. NIM captures that spread as a percentage of the bank’s total interest-earning assets.
The calculation is not as simple as mortgage rate minus deposit rate. Three components determine where NIM lands:
A bank charging 6% on mortgages and paying 4% on deposits does not simply pocket a 2% spread. Non-earning assets, fee-free transaction balances, and the mix of fixed versus variable lending all shape the actual outcome. Across the ASX peer set, that outcome currently ranges from 1.64% (BOQ) to 1.96% (CBA), a span of 32 basis points that represents meaningful differences in earnings power.
The NIM, ROE, and CET1 benchmarks used throughout this analysis reflect sector averages calculated by Rask against the most recent available reporting periods, and readers should note that Bendigo and Adelaide Bank serves as the live worked example in a companion framework piece covering how professionals apply these three diagnostics to any ASX bank result.
BEN derives approximately 87% of total revenue from lending, compared with major banks that generate larger income streams from fees, markets trading, and wealth management. A 10 basis point swing in NIM therefore has an outsized impact on BEN’s earnings relative to more diversified peers, making margin trends the single most consequential variable in any assessment of the bank’s earnings outlook.
The full peer comparison reveals a pattern that is structural, not cyclical.
CBA leads at 13.3% cash ROE, followed by ANZ at 11.7%, NAB at 11.6%, and Westpac at 10.7%. Suncorp Bank sits at 8.4%. BEN’s 7.76% places it sixth of seven, with only BOQ (5.2%) trailing. Against a sector average of approximately 9.35% (per Rask’s calculation), BEN falls short by roughly 1.5 percentage points.
| Bank | Cash ROE | Period |
|---|---|---|
| CBA | 13.3% | 1H FY26 |
| ANZ | 11.7% | FY24 |
| NAB | 11.6% | FY24 |
| Westpac | 10.7% | FY24 |
| Suncorp Bank | 8.4% | 1H FY25 |
| BEN | 7.76% | 1H FY26 |
| BOQ | 5.2% | 1H FY25 |
The drivers are well documented. UBS has characterised BEN’s franchise as “sub-scale” in mortgages and business banking, limiting pricing power. Elevated cost-to-income ratios, driven by sustained technology and compliance investment, compress the return on each dollar of equity deployed. Lower revenue diversification compounds the effect: when NIM is the dominant earnings lever, any margin pressure feeds directly through to ROE.
Goldman Sachs has described BEN’s strategic simplification programme as a medium-term positive, but “not sufficient to close the ROE gap to majors in the near term.”
ROE is the closest single number to a measure of how effectively management deploys the capital shareholders have entrusted to them. BEN’s persistently below-average performance on this metric remains the most significant fundamental constraint on long-term share price re-rating potential.
The ASX bank sector rally that characterised the first four months of 2026 reflects price momentum concentrated in names like CBA and ANZ, yet the analyst consensus behind that move, unanimous sell ratings on CBA and broadly bearish tilts across three of the four majors, underscores how sharply price momentum and fundamental valuation can diverge at sector level.
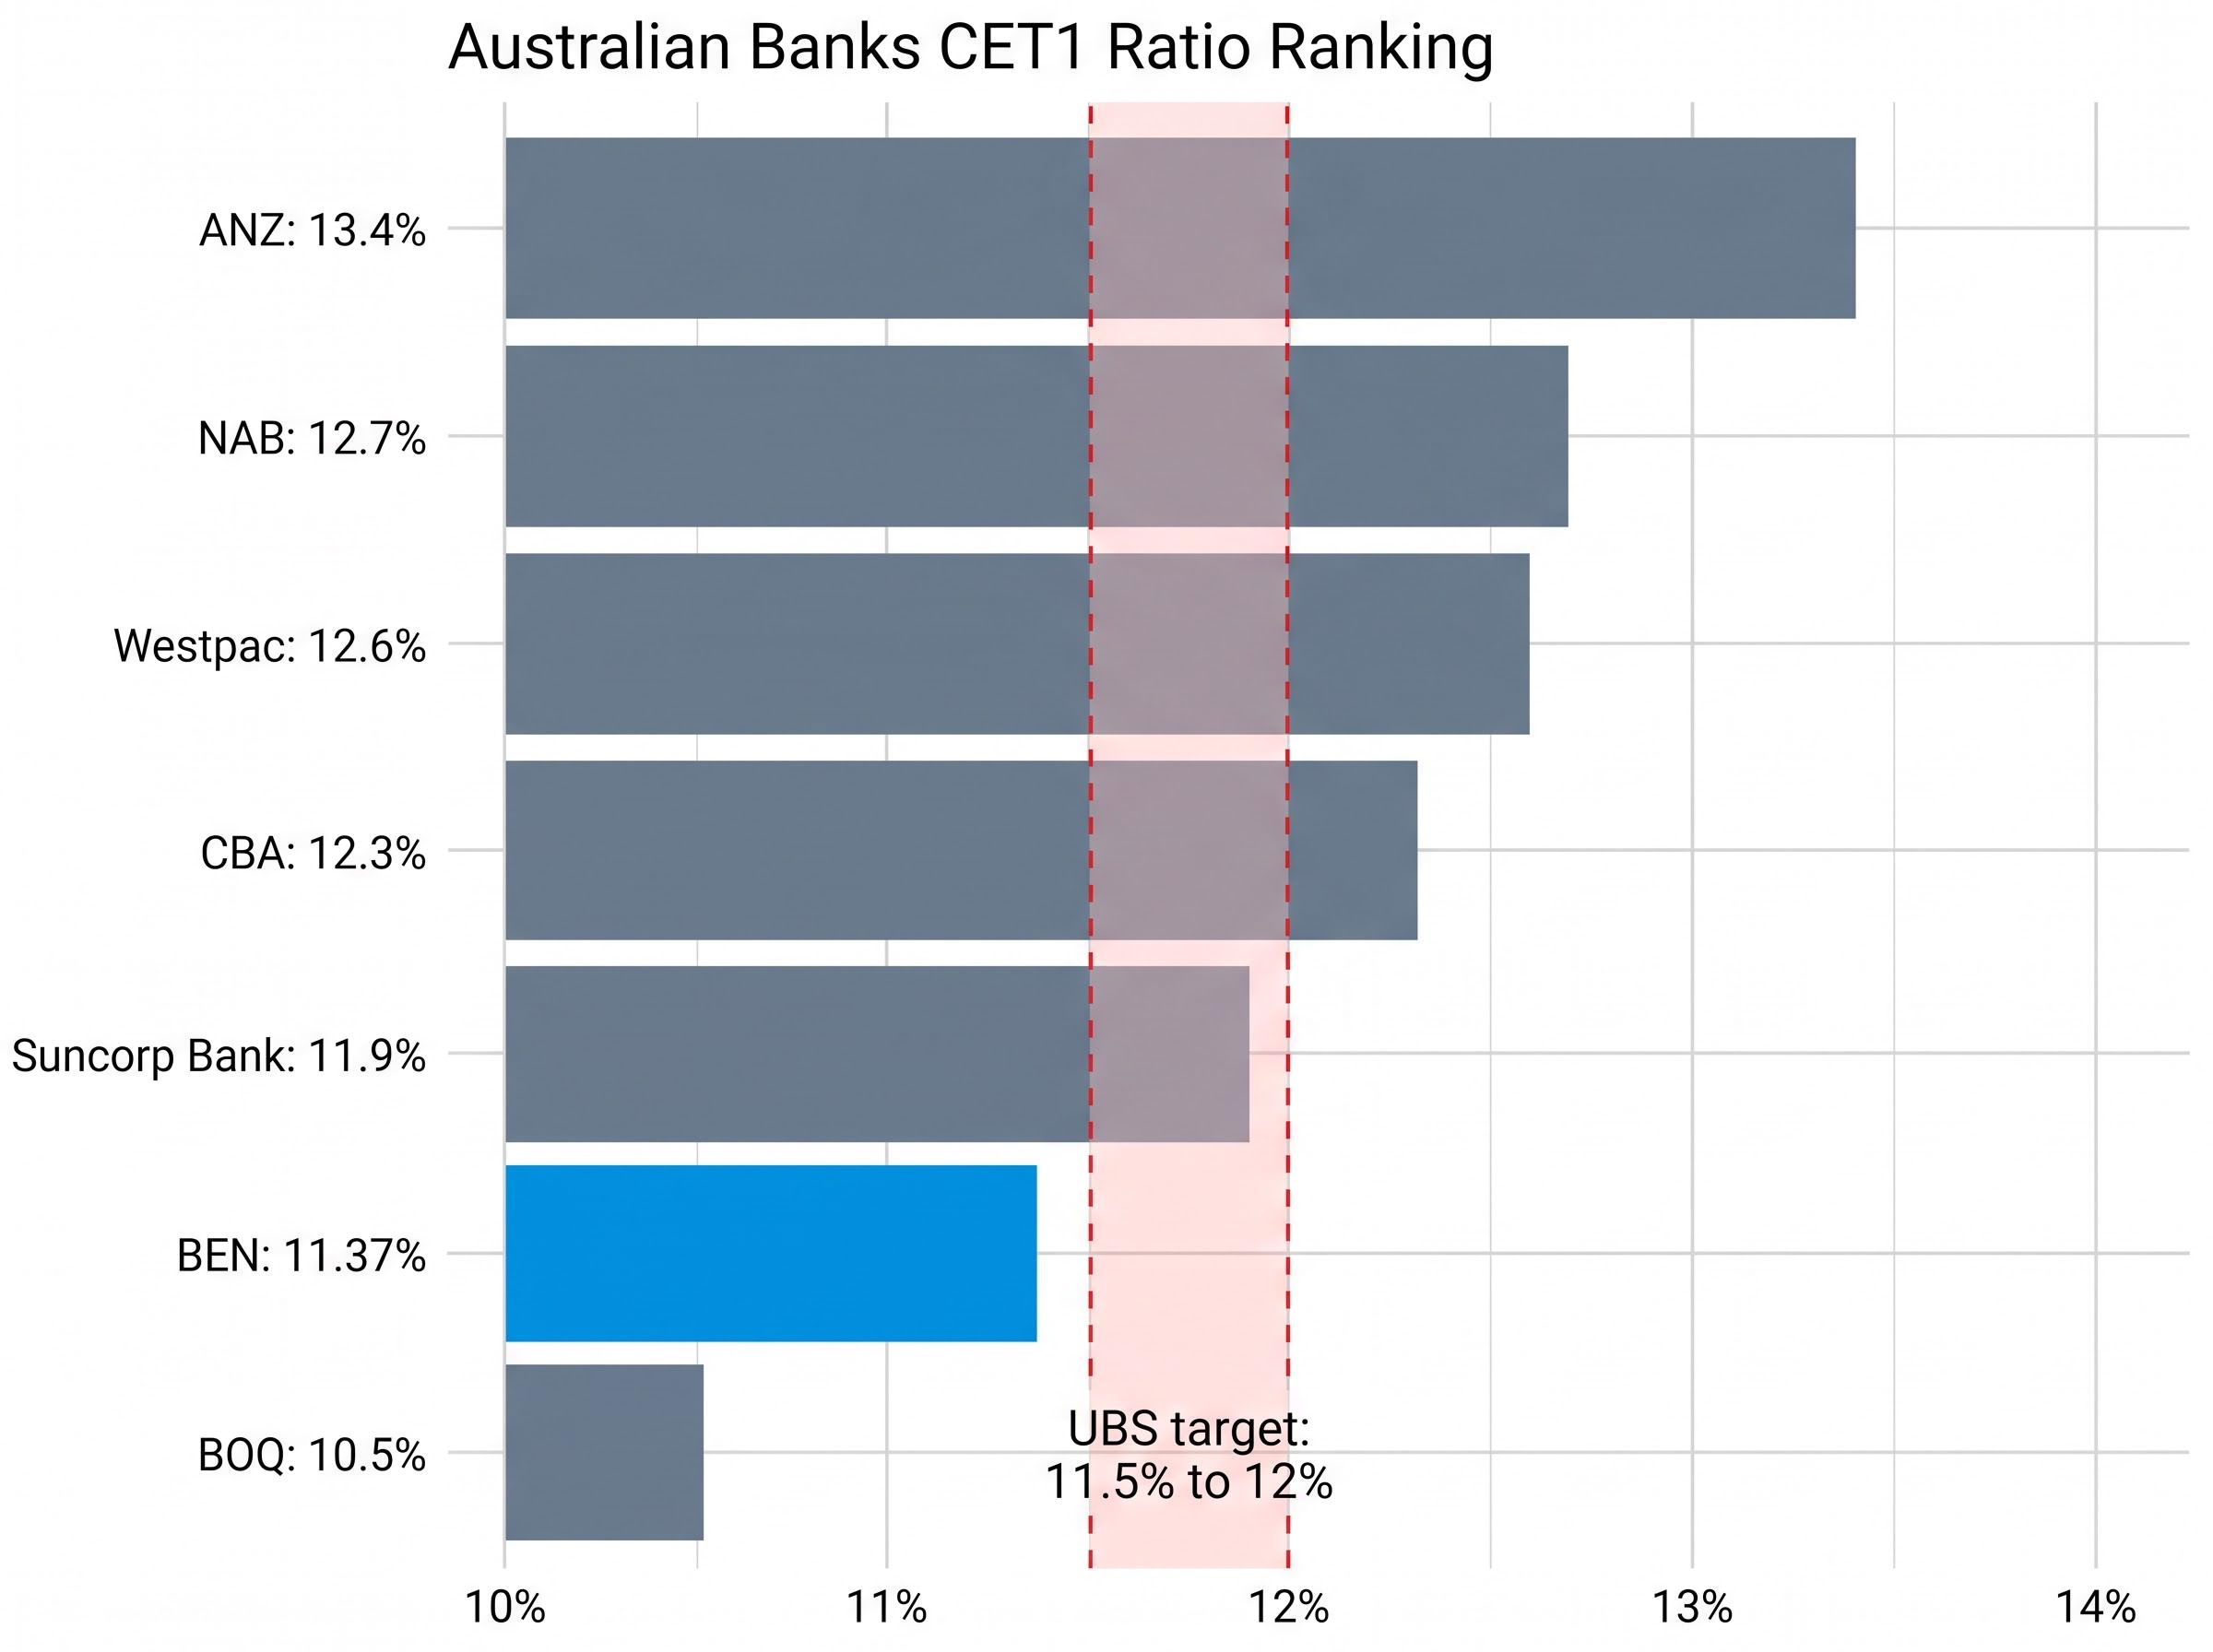
BEN’s CET1 ratio of 11.37% at 31 December 2025 sits above the Australian Prudential Regulation Authority’s (APRA) minimum requirements. It also sits below every major bank and below Suncorp Bank.
| Bank | CET1 Ratio | Reporting Period |
|---|---|---|
| ANZ | 13.4% | 31 Dec 2025 |
| NAB | 12.7% | 31 Dec 2025 |
| Westpac | 12.6% | 31 Dec 2025 |
| CBA | 12.3% | 31 Dec 2025 |
| Suncorp Bank | 11.9% | 31 Dec 2024 |
| BEN | 11.37% | 31 Dec 2025 |
| BOQ | 10.5% | 28 Feb 2025 |
The distance to the regulatory floor matters more than the headline number suggests. APRA’s Countercyclical Capital Buffer (CCyB) of 1% of risk-weighted assets (RWA), in place since at least January 2023, shrinks the management buffer above regulatory triggers. APRA has also noted that smaller and regional banks may warrant relatively higher buffers than the minimum, reflecting less diversified funding and income sources.
APRA’s capital buffer framework sets the minimum CET1 requirements, the Capital Conservation Buffer, and the 1% Countercyclical Capital Buffer that all Australian authorised deposit-taking institutions must hold above regulatory trigger points, making the distance between a bank’s reported CET1 and those combined floors the true measure of usable headroom.
UBS has flagged that BEN must run CET1 “closer to 11.5% to 12%” to remain comfortably above triggers. The practical consequences are clear:
A thinner buffer is not a solvency concern. It is a flexibility constraint, and flexibility is what separates banks that can grow, return capital, and absorb shocks simultaneously.
CBA’s CET1 trajectory over the most recent quarter illustrates the dynamic at work across the sector: total capital ratios declined even as the absolute CET1 level held firm, because risk-weighted asset growth from commercial lending and mortgage expansion outpaced new capital issuance, a pattern that places upward pressure on the entire peer group’s capital management discipline.
The sector-wide NIM expansion that characterised FY23 and FY24 has peaked. CBA and Westpac both reported a few basis points of NIM contraction in the December 2025 half relative to the prior period. The question is how far compression extends, and whether BEN’s above-peer margin holds.
The October 2025 RBA Financial Stability Review confirms that Australian banks are navigating simultaneous pressure from mortgage lending competition and deposit repricing, with NIMs across the system facing compression as funding cost advantages from the rate-rise cycle progressively unwind.
Three forces are driving margins lower, in order of immediacy:
Jarden forecasts that by FY27, major-bank NIM could revert towards 1.70-1.75%, and has described BEN’s 1.92% margin as “likely above sustainable levels” given prolonged pricing competition. Macquarie and UBS estimate sector-wide NIM could fall 3-7 basis points in 2H FY26. Morgan Stanley has noted that BEN is “earnings-leveraged to further rate cuts.”
Regional banks that benefited disproportionately from rising rates may see more pronounced margin give-back when the cycle turns, unless product mix shifts materially. Macquarie has also warned of rising arrears in regional SME and mortgage portfolios, a compounding factor that could simultaneously lift provisioning costs while margins compress. BEN’s NIM advantage is real, but the evidence points towards cyclical tailwind rather than structural moat.
The three metrics paint a consistent picture when assembled together.
| Bank | NIM | Cash ROE | CET1 |
|---|---|---|---|
| CBA | 1.96% | 13.3% | 12.3% |
| ANZ | 1.68% | 11.7% | 13.4% |
| NAB | ~1.74% | 11.6% | 12.7% |
| Westpac | 1.82% | 10.7% | 12.6% |
| Suncorp Bank | 1.93% | 8.4% | 11.9% |
| BEN | 1.92% | 7.76% | 11.37% |
| BOQ | 1.64% | 5.2% | 10.5% |
BEN’s genuine strengths deserve recognition:
The structural constraints are equally documented:
One softer indicator adds context. BEN’s Seek workplace culture score of 2.9 out of 5 trails a sector benchmark of 3.1, a signal of organisational headwinds that could constrain long-run operational improvement. The distinction between a cheap share price and a fundamentally strong operator is where this analysis delivers its value. BEN is not a weak bank. It is a structurally sub-scale one, and these metrics quantify the gap.
BEN is operationally solid but not a structural compounder. Its above-average NIM is near-peak, its ROE is below average and structurally constrained, and its capital adequacy is below major bank peers. These three positions together define a bank that rewards patience, not momentum.
BEN’s strategic direction, digital investment, community banking focus, cost discipline, addresses the ROE gap over time. Broker consensus, however, does not expect meaningful closure within a two-year horizon. Morgan Stanley maintains an underweight rating. UBS holds a sell/underperform view. Goldman Sachs rates the stock neutral.
For valuation context, dividend discount model (DDM) based fair value estimates from research range from approximately $13.32 to $13.75 per share, against a current price of approximately $10.40. That gap suggests the market is already pricing in the structural constraints this analysis has documented. The bank’s 60-75% payout ratio policy provides a dividend sustainability anchor, but capital demands limit flexibility at the upper bound.
The investor question is precise: not whether BEN is cheap, but whether its fundamental operating quality justifies a position relative to peers offering stronger ROE and greater capital flexibility. These metrics provide the evidence. The conclusion belongs to the reader.
For investors who have worked through BEN’s fundamental quality profile and are now weighing whether an individual position is justified relative to broad market exposure, our dedicated guide to the BEN versus VAS decision applies a four-step framework covering time horizon, monitoring capacity, NIM conviction, and regulatory risk tolerance, walking through the specific trade-offs between a discounted single-bank position and a low-cost diversified ETF at 0.10% per annum.
This article is for informational purposes only and should not be considered financial advice. Investors should conduct their own research and consult with financial professionals before making investment decisions. Past performance does not guarantee future results. Financial projections are subject to market conditions and various risk factors.
Net interest margin (NIM) is the spread between what a bank earns on loans and what it pays on deposits, expressed as a percentage of interest-earning assets. For BEN, NIM is especially important because lending accounts for approximately 87% of total revenue, meaning even a small change in margin has an outsized impact on earnings compared to more diversified major banks.
BEN reported a cash ROE of 7.76% in 1H FY26, well below the major bank range of 10.7% to 13.3%, with only BOQ at 5.2% sitting lower among the seven peers tracked. Analysts including UBS and Goldman Sachs attribute this gap to a sub-scale franchise, elevated cost-to-income ratios, and limited revenue diversification.
The Common Equity Tier 1 (CET1) ratio measures a bank's core equity capital as a proportion of its risk-weighted assets, and is the primary indicator of financial resilience under APRA's regulatory framework. BEN's CET1 of 11.37% at 31 December 2025 sits above regulatory minimums but below every major bank and Suncorp Bank, which UBS suggests means BEN needs to run capital closer to 11.5% to 12% to remain comfortably above trigger points.
BEN management has flagged margins are likely to be slightly lower in the second half of FY26, with Jarden describing the 1.92% NIM as above sustainable levels given prolonged mortgage competition, deposit repricing pressure, and the potential for RBA rate cuts that would compress at-call deposit margins further. Macquarie and UBS estimate sector-wide NIM could fall 3-7 basis points in 2H FY26.
BEN paid a total of 58 cents per share in FY25 and declared a 30 cents per share interim dividend for 1H FY26, fully franked. The bank targets a payout ratio of 60-75% of cash earnings, though capital requirements limit flexibility at the upper end of that range.