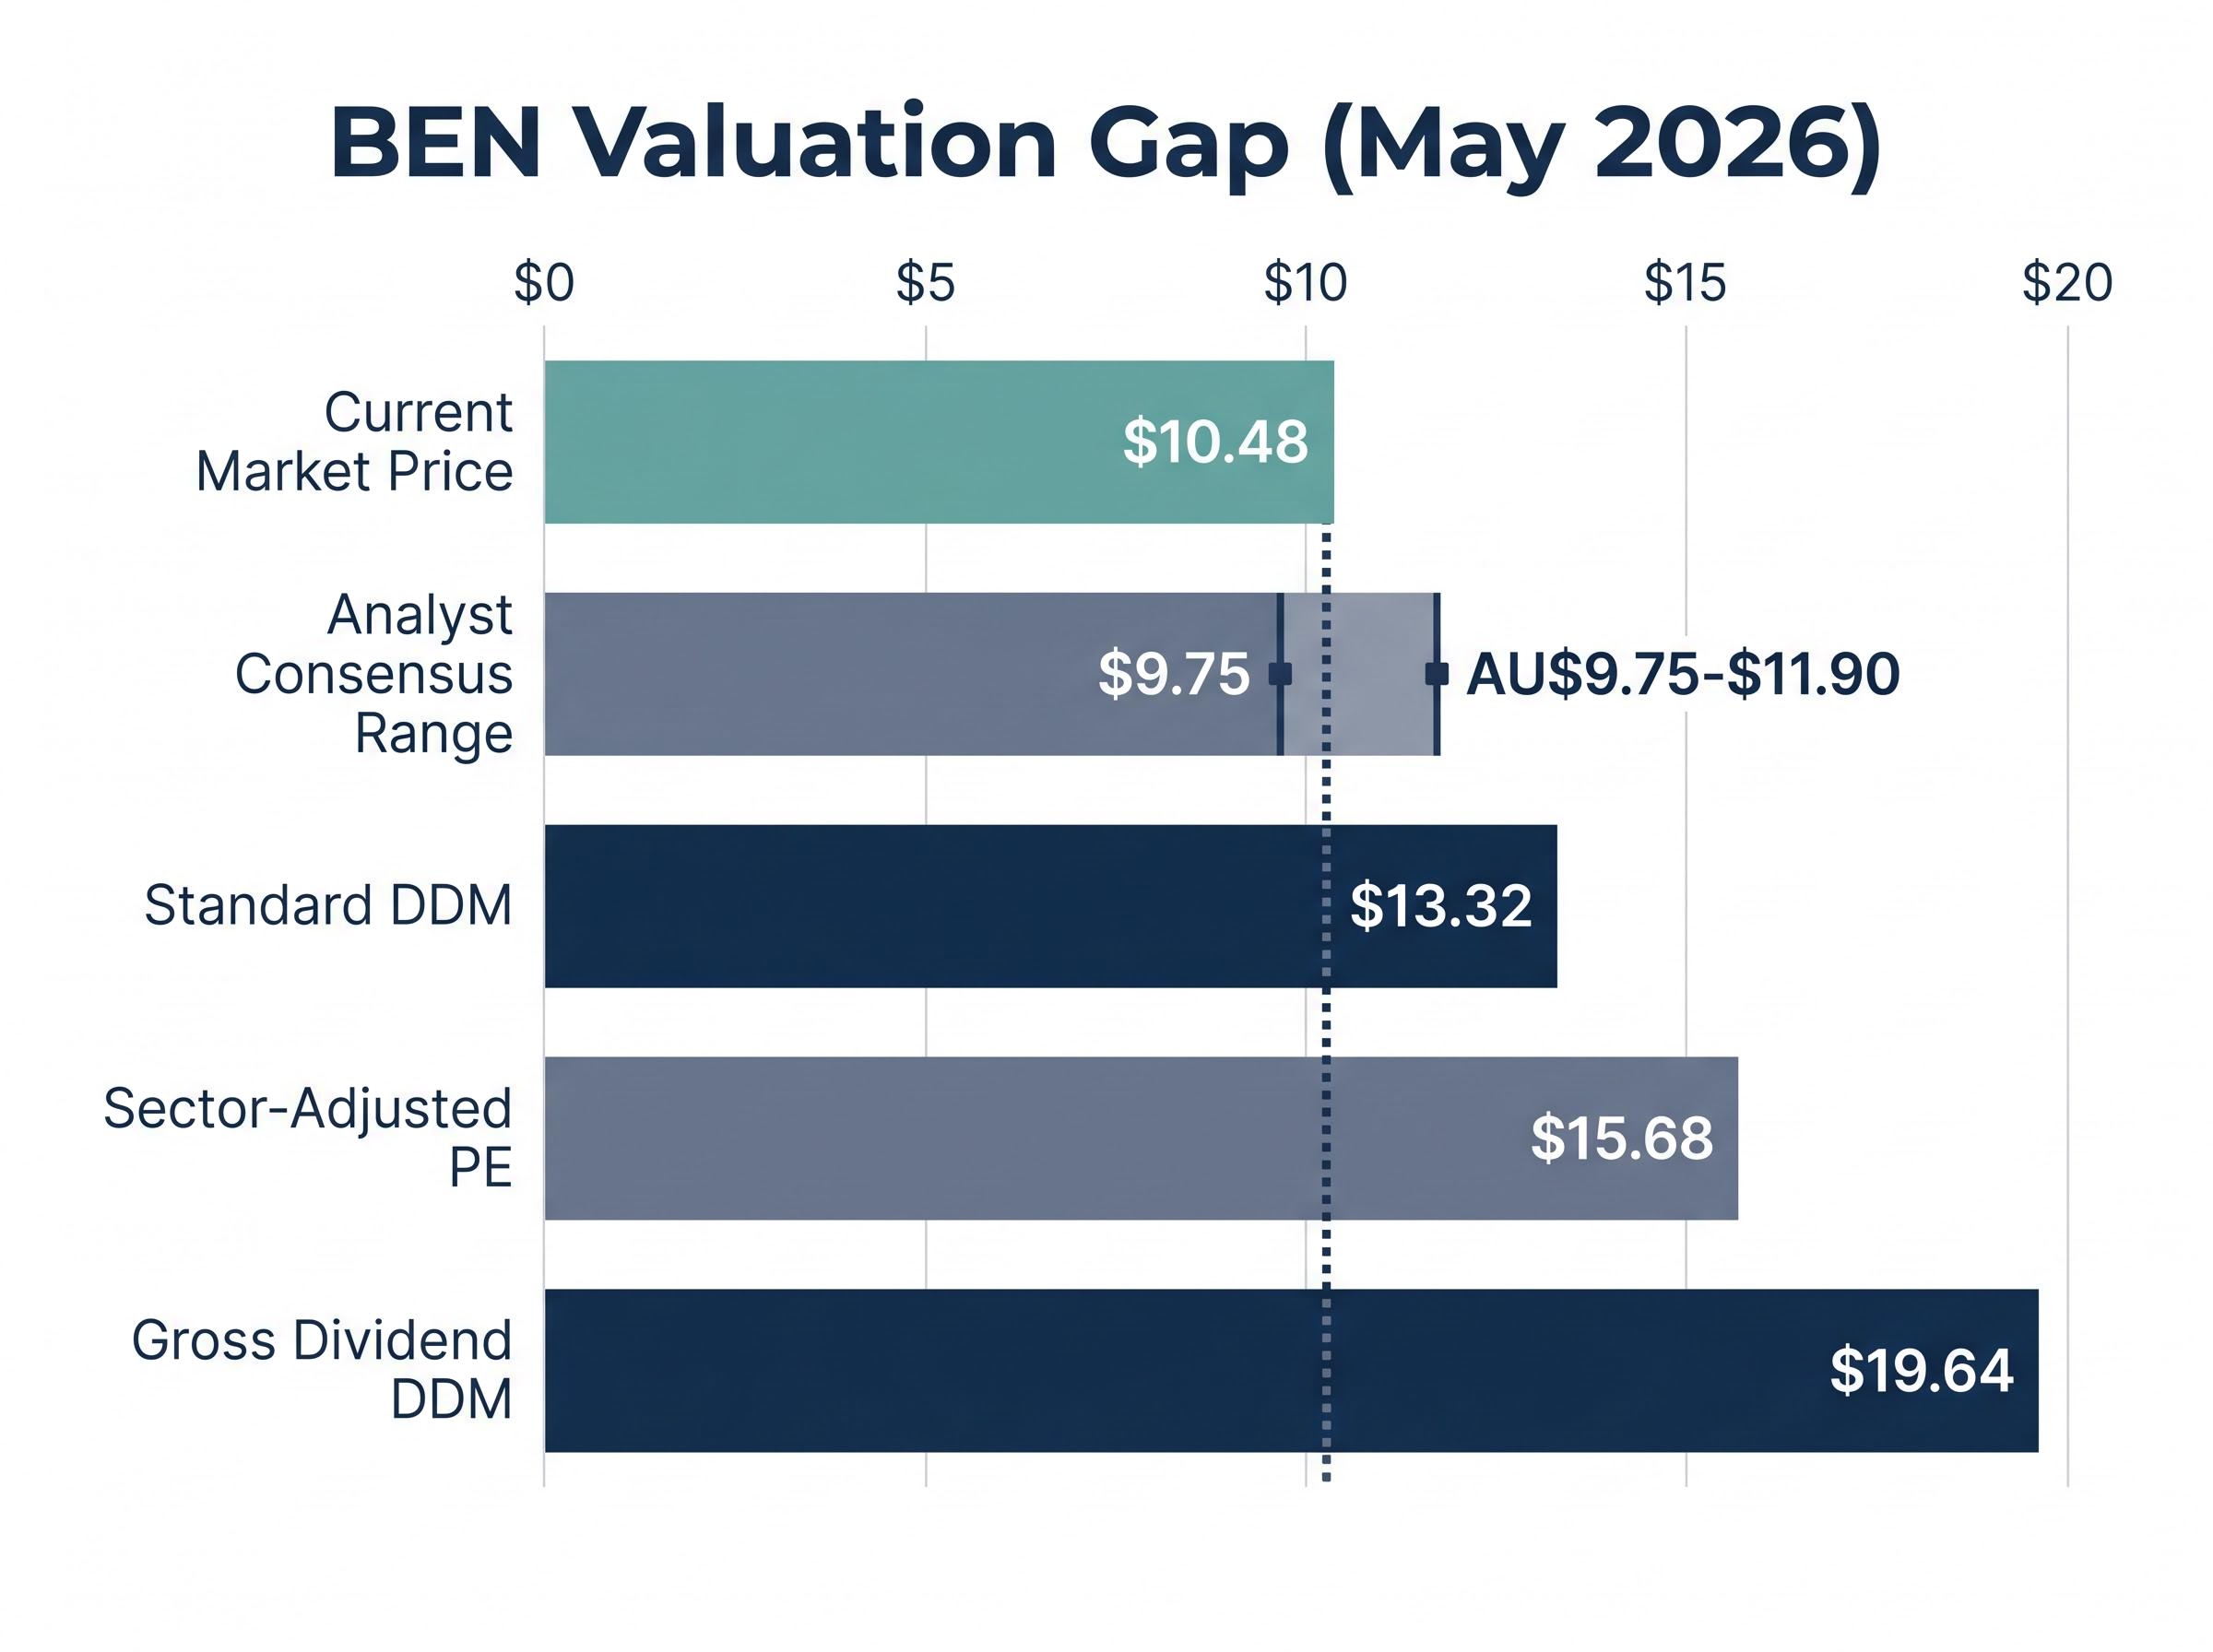
Bendigo and Adelaide Bank shares sit at roughly $10.48 in May 2026, a price that trails multiple valuation model outputs by a wide margin. A sector-adjusted PE approach implies $15.68. Dividend discount models produce a range from $13.32 to $19.64. On paper, the discount is substantial. But for long-term investors weighing the BEN share price against the cost of owning the entire Australian market through a diversified ETF at 0.10% per year, the more useful question is whether the gap justifies the concentration risk, and the analytical work required to monitor it. This article provides a practical decision framework for Australian investors weighing individual ASX bank stock selection against a low-cost passive alternative, using Bendigo and Adelaide Bank as the live case study.
Why BEN’s valuation gap is real but incomplete as a buy signal
Three separate valuation approaches produce estimates well above the current share price. A sector-adjusted PE model, applying the 18x banking sector average to BEN’s $0.87 FY24 EPS, implies a value of $15.68. A standard dividend discount model produces $13.32. A gross dividend DDM, which accounts for franking credits, stretches to $19.64.
The role of franking credits in DDM analysis matters significantly for Australian investors: a gross dividend DDM that includes the full value of imputation credits will always produce a higher intrinsic value than a cash-only model, which is precisely why the $19.64 gross estimate sits so far above the $13.32 cash-only figure.
The range is wide, but every estimate sits materially above the $10.48 market price. That creates an apparent opportunity. It also raises a question: if the discount is this visible, why does analyst consensus sit at just AU$10.70-$10.85, implying only 2-4% upside?
| Method | Key Inputs | Implied Value | vs. Current Price |
|---|---|---|---|
| Sector-adjusted PE | 18x sector avg, $0.87 EPS | $15.68 | +50% |
| Standard DDM | Cash dividends, cost of equity | $13.32 | +27% |
| Gross Dividend DDM | Gross dividends incl. franking | $19.64 | +87% |
Analyst consensus target range: AU$9.75-$11.90 across 7-12 analysts (May 2026), implying modest upside at best, a sharp contrast with the model outputs above.
The divergence between model-implied values and analyst targets is the signal that matters. Either the market is systematically mispricing BEN, or the models are capturing upside while omitting risks that analysts are pricing in. The remainder of this article tests which explanation holds.
The macro assumptions behind bank valuations explain much of the divergence between PE-model outputs and analyst consensus targets: the same earnings figure can support a valuation ranging from single digits to multiples of the current price depending on assumed growth rates, discount rates, and rate cycle duration.
When big ASX news breaks, our subscribers know first
The NIM recovery story and what it actually means for earnings
Bendigo and Adelaide Bank’s 1H26 results, released on 16 February 2026, showed a net interest margin of 1.92%, up 4 basis points from 1.88% in the prior half. Cash earnings reached $256.4 million, a 2.8% increase half-on-half.
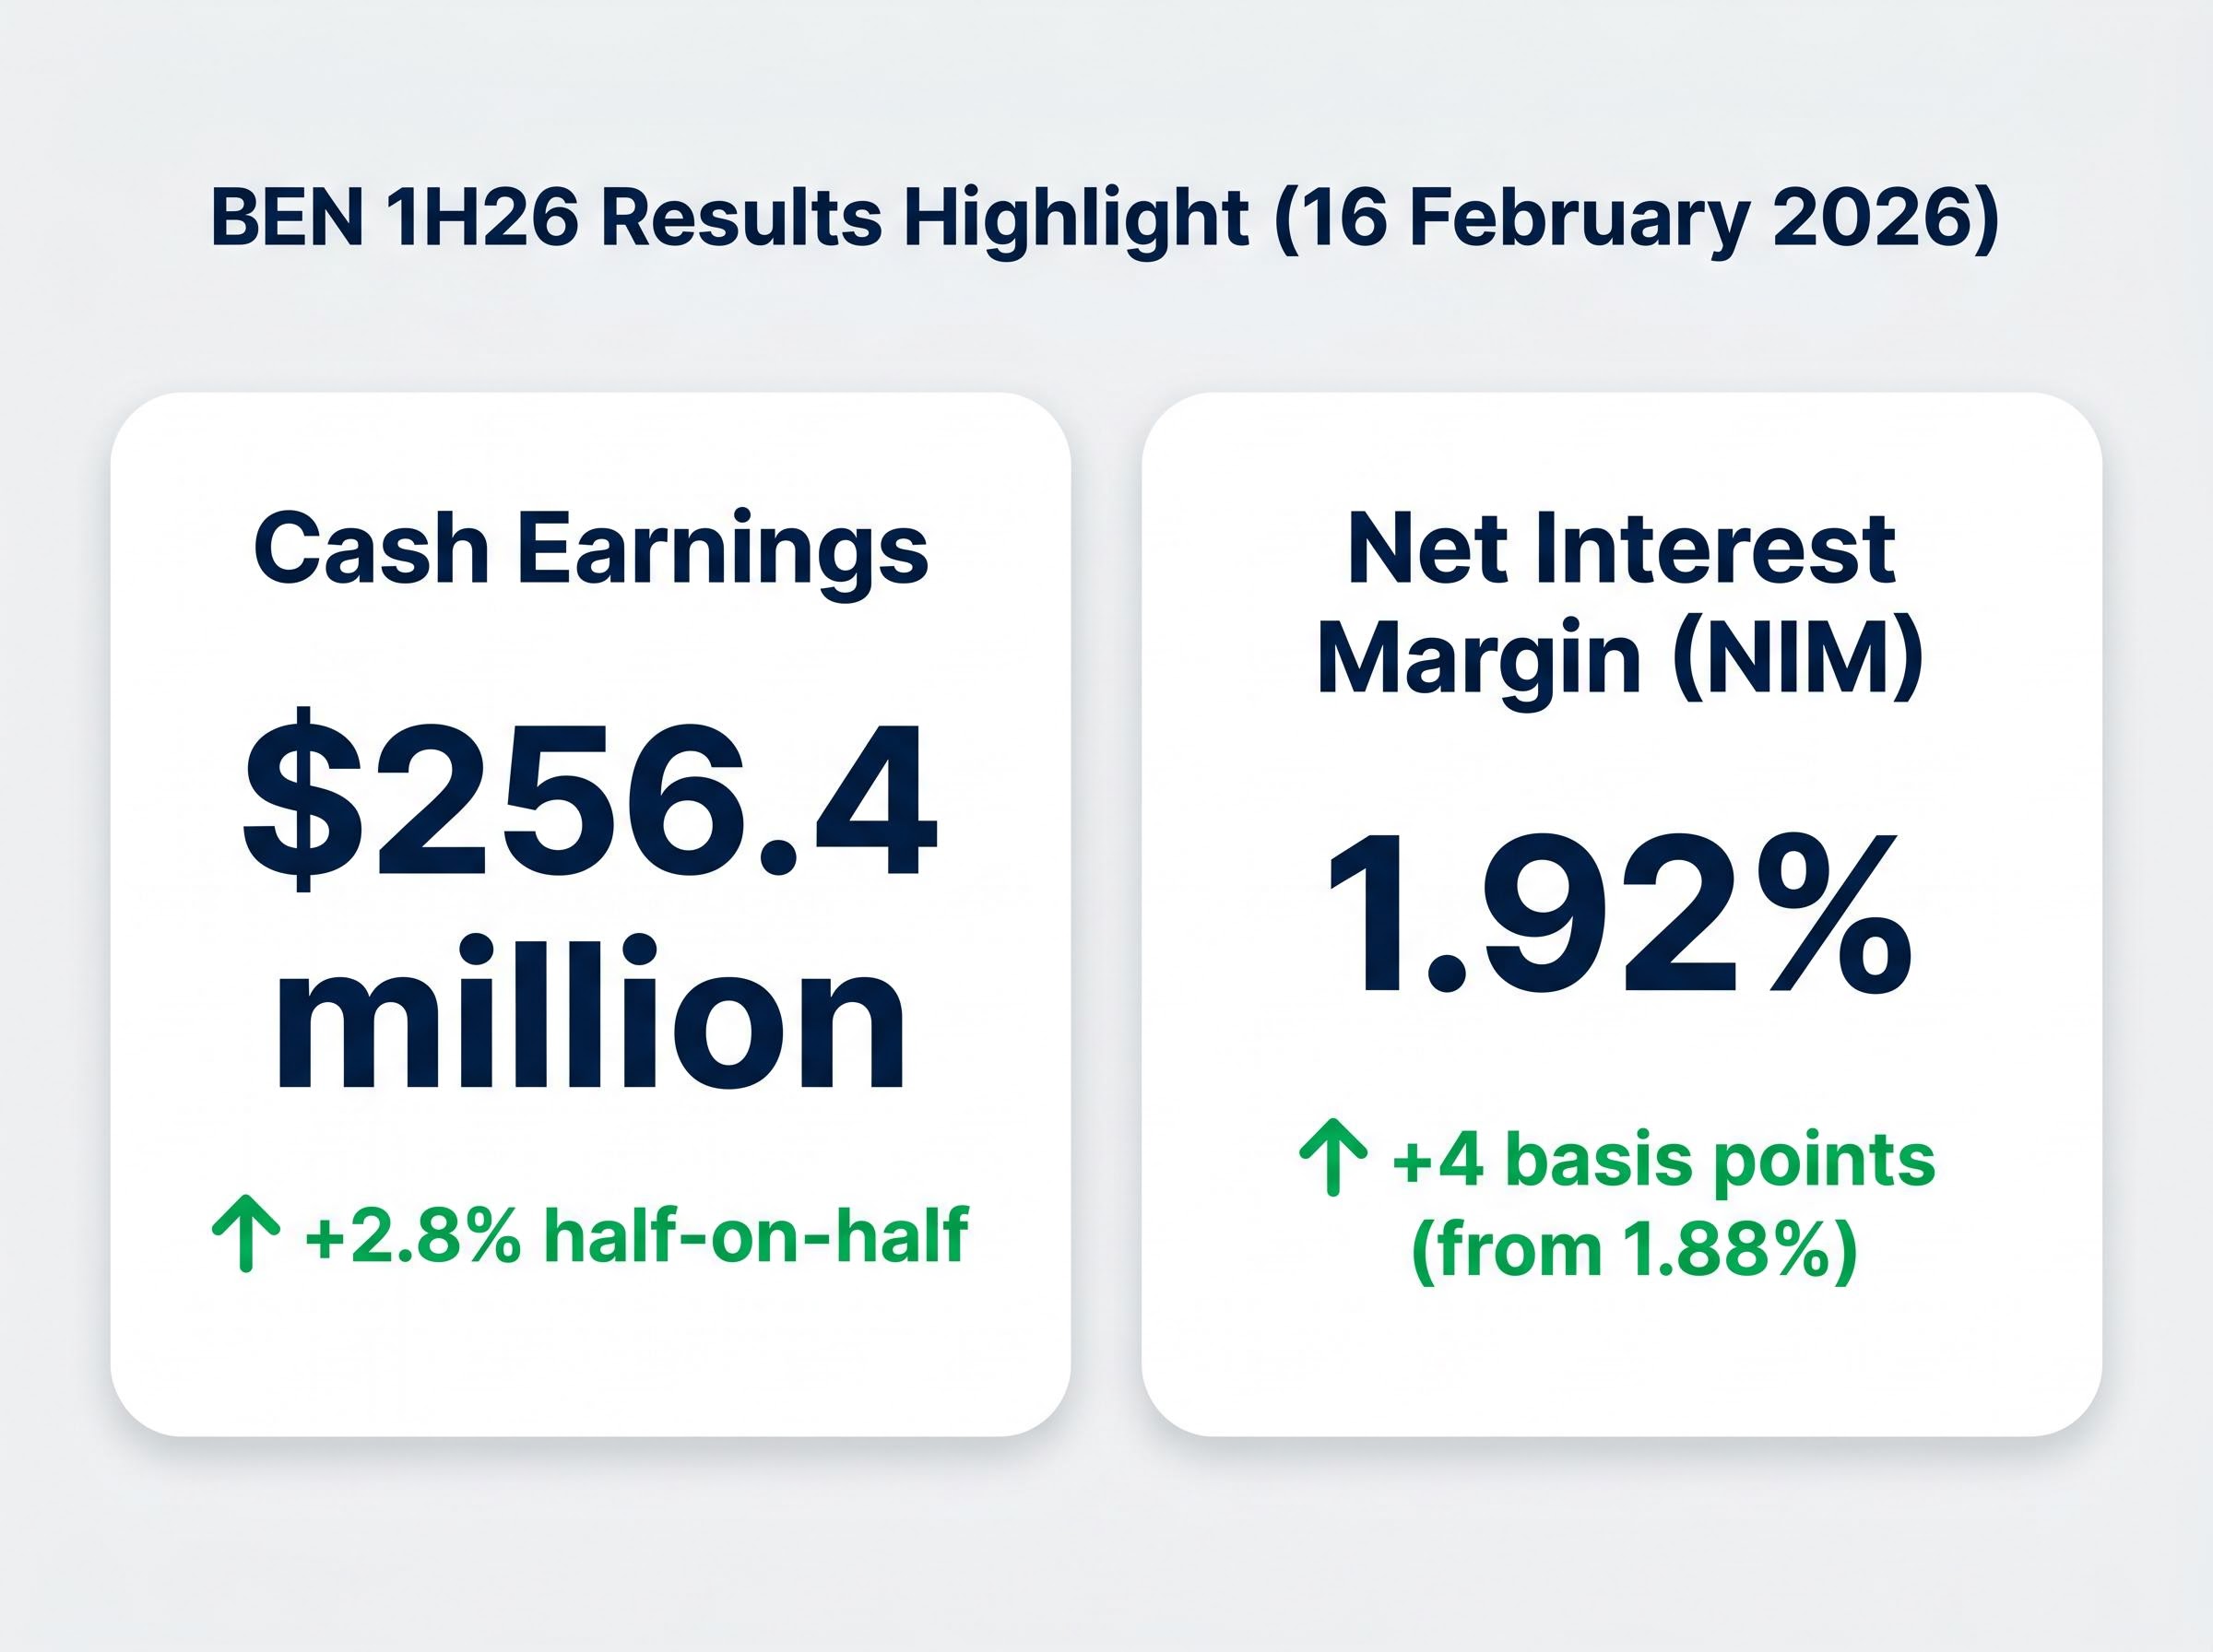
For a regional bank where lending margins drive the bulk of profitability, a 4 basis point NIM improvement is not trivial. It reverses the direction of the margin compression that weighed on Australian bank earnings across the prior period. Analysts have flagged continued NIM expansion as the single most important catalyst for a BEN earnings recovery.
The improvement is real. The question is whether it is durable.
What needs to stay true for the NIM recovery to hold
Three conditions need to persist for BEN to sustain a NIM at or above 1.92%:
- Easing funding costs: wholesale and retail funding costs must stabilise or decline, rather than rising in response to monetary policy shifts
- Repricing discipline: BEN must maintain its ability to reprice loans without losing market share to larger competitors with greater pricing flexibility
- Deposit market stability: competition for retail deposits, BEN’s core funding source given its community banking model, must not intensify to the point where deposit pricing erodes the margin gain
If any of these conditions breaks down, NIM compression resumes. That is not a speculative risk; analysts have explicitly flagged competitive deposit market dynamics as the primary downside scenario for BEN’s earnings trajectory.
Every valuation model referenced in the previous section depends on an earnings trajectory that, in turn, depends on these three conditions holding. Investors who cannot form a view on NIM sustainability are effectively accepting model outputs on faith.
Regulatory headwinds on non-interest income: the risk the models miss
Quantitative valuation models tend to capture what can be measured from historical financials. They are less effective at pricing regulatory shifts that have not yet fully flowed through to reported earnings. For BEN, this blind spot matters.
ASIC’s 2025 bank fee review, announced in February 2026 (ASIC REP 829), resulted in AU$161 million in refunds to low-income customers for excessive fees. The Delivering Better Financial Outcomes (DBFO) Act guidance, also issued in 2025, introduced ongoing fee disclosure and consent requirements that constrain how banks and their aligned advice businesses charge for and disclose services.
ASIC’s bank fee review findings established that multiple institutions had charged excessive fees to low-income customers, resulting in refund obligations that demonstrate the regulator’s willingness to impose direct financial consequences on banks whose fee structures do not meet community standards.
AU$161 million in fee refunds signals that regulatory pressure on bank fee structures is not theoretical; it is already generating material financial consequences.
Together, these regulatory developments create headwinds across three non-interest income categories:
- Fee income: increased scrutiny on fee structures, particularly those affecting lower-income customers
- Wealth management: ongoing advice fee requirements under DBFO reduce cross-selling flexibility for bank-aligned advice businesses
- Insurance distribution: continued post-Royal Commission supervision of bank-aligned insurance channels by ASIC
Non-interest income is the diversification lever regional banks use to offset NIM volatility. When that lever is constrained by regulation, the earnings profile becomes more NIM-dependent, and therefore more fragile. Neither the PE model nor the DDM outputs above adjust for this structural pressure.
Management quality, culture, and the variables that outlast any valuation model
For investors with a 10-plus year holding period, the question shifts from “what are the numbers today?” to “who is running this institution, and will they close the gap between price and value over a decade?”
Management quality and organisational culture are among the most consequential variables in a long-duration bank stock thesis. They are also the hardest to quantify. Research from the Rask Invest Research Team noted that BEN’s internal culture assessment did not achieve a perfect rating. That is not, on its own, disqualifying. But it warrants attention.
Analysts have flagged two specific execution risks: technology and digital transformation investment, where BEN must compete with the major four banks’ substantially larger IT budgets; and limited operating leverage, a structural constraint of BEN’s smaller scale relative to Commonwealth Bank, Westpac, ANZ, and NAB.
A practical checklist for assessing management and culture in a regional bank
Investors evaluating whether BEN’s leadership can close the valuation gap over time should be able to answer the following questions using publicly available sources:
- Capital allocation track record: Has management consistently allocated capital to its highest-return opportunities, or has spending been reactive? Annual reports and investor presentations provide the trail.
- Technology roadmap credibility: Does the stated digital transformation plan have specific milestones and budgets, or is it expressed in generalities? ASX announcements and strategy day presentations are the primary sources.
- Executive-level turnover: Has the senior leadership team been stable, or has there been frequent change at the C-suite level? This is verifiable through ASX announcements and annual report disclosures.
- Community banking mission versus product decisions: Does BEN’s stated community focus translate into actual product and pricing decisions, or does product design prioritise margin extraction? Branch-level product pricing and customer complaint data offer insight.
- Board composition and independence: Does the board include directors with direct banking operations experience, and is there genuine independence from management? The annual report’s corporate governance statement provides this detail.
A bank trading below intrinsic value that lacks the management capability to close the gap will remain discounted indefinitely. The spreadsheet identifies the opportunity; management determines whether it is captured.
A five-factor checklist for bank assessment that covers income structure, property exposure, unemployment trajectory, management discipline, and arrears trends provides a repeatable quarterly review structure, which matters particularly in an environment where unemployment has reached 4.3% and Sydney and Melbourne property prices are declining.
The ETF alternative: what VAS actually gives you and what it does not
Vanguard Australian Shares Index ETF (ASX: VAS) tracks the S&P/ASX 300 Index, providing exposure to approximately 300 Australian securities at a management fee of 0.10% per annum (Vanguard PDS, 27 March 2026). It is not a fallback for the undecided. It is a structurally different investment decision with specific trade-offs.
VAS provides diversified exposure to Australia’s banking sector at market-cap weights. The major four banks alone represent a substantial share of the ASX, with bank stocks accounting for approximately 30% of Australia’s total share market by market capitalisation. An investor holding VAS receives meaningful bank sector exposure without concentration in any single institution.
What VAS does not provide is the potential for alpha from a BEN-specific re-rating, direct exposure to BEN’s fully franked dividend (the most recent full-year payment was $0.63 per share, or $0.93 gross including franking credits), or any ability to time entry around a specific catalyst such as NIM expansion.
Historical evidence suggests that active individual stock selection underperforms low-cost index strategies over long time horizons for most retail investors. The analytical burden of monitoring NIM trajectories, regulatory developments, and management execution on a quarterly basis carries a real opportunity cost that 0.10% per annum eliminates entirely.
| Dimension | BEN (Individual Stock) | VAS (ETF) |
|---|---|---|
| Diversification | Single-stock concentration | ~300 securities |
| Cost | Brokerage + analytical time | 0.10% p.a. |
| Bank sector exposure | BEN only (~$10.48) | Big Four + regionals at market-cap weights |
| Alpha potential | Re-rating upside if gap closes | Market return only |
| Ongoing monitoring | Quarterly NIM, regulatory, management | Minimal |
The next major ASX story will hit our subscribers first
The decision framework for Australian investors sitting on the fence in May 2026
The preceding sections have tested the BEN investment case across four dimensions: valuation, NIM trajectory, regulatory risk, and management quality. The question that remains is not whether BEN is cheap. The models confirm it trades below estimated intrinsic value. The question is whether the specific investor considering this purchase can hold through the uncertainty required to capture that cheapness, or whether VAS offers a better risk-adjusted path to ASX bank exposure.
“Is BEN cheap enough to justify what you need to believe and monitor for the next decade?”
A four-step framework structures the decision:
- Time horizon test: Is the intended holding period 10-plus years? Individual bank stock theses require long time horizons to allow valuation gaps to close. Shorter horizons increase the probability that NIM cycles, regulatory shifts, or management changes disrupt the thesis before it plays out.
- Monitoring capacity test: Is there genuine willingness to review BEN’s results, NIM trajectory, and ASIC regulatory developments on a quarterly basis? If not, the analytical edge required to own an individual bank stock over an index fund does not exist.
- NIM conviction test: Is there a formed, evidence-based view on whether BEN can sustain a NIM at or above 1.92%? The analyst target range of AU$9.75-$11.90 reflects disagreement on this point. Without a view, the investor is accepting model outputs passively.
- Regulatory risk tolerance test: Is the investor comfortable with unresolved uncertainty around non-interest income, given ASIC’s active stance on fee structures and DBFO’s constraints on wealth management revenue?
A qualitative bank valuation framework that covers management credibility, loan-book discipline, NIM durability, and governance signals provides the structure for forming that evidence-based view, and applying a comparable framework to BEN requires sourcing and weighing the strongest bearish analyst thesis before acting on model outputs.
Investors who answer “no” to two or more of these questions may find VAS at 0.10% per annum a more honest expression of their investment strategy than an individual bank stock selected on valuation alone.
The valuation discount is real, but so is the work required to earn it
The signals from BEN’s valuation models are genuine. A DDM range of $13.32-$19.64 and a PE-adjusted estimate of $15.68 against a $10.48 share price represent a material discount, not noise. The 4 basis point NIM recovery in 1H26 adds credibility to the earnings trajectory that underpins those models.
None of that, on its own, constitutes a buy thesis. The decision to own BEN over VAS is a bet on the investor’s capacity to assess and monitor qualitative factors: management execution, regulatory developments, deposit market competition, and digital transformation progress. It is a bet on skill and patience, not just a bet on a discount closing.
Investors who lack the time or inclination to track NIM trajectories quarterly, to read ASIC enforcement updates, and to evaluate management decisions against stated strategy may find the 0.10% annual fee for VAS a small price for simplicity. The valuation gap is the starting point. The work required to earn it is the investment.
This article is for informational purposes only and should not be considered financial advice. Investors should conduct their own research and consult with financial professionals before making investment decisions. Past performance does not guarantee future results. Financial projections are subject to market conditions and various risk factors.