Commonwealth Bank of Australia (CBA) reported a Common Equity Tier 1 (CET1) ratio of 11.6% in its Q3 FY2026 Basel III Pillar 3 disclosure, published on 13 May 2026. According to the disclosure, the figure covers the quarter ended 31 March 2026 and sits approximately 110 basis points above the Australian Prudential Regulation Authority’s (APRA) minimum threshold for domestically systemically important banks. For most retail investors, however, the number arrives without a measuring stick. What follows unpacks the key ratios from the quarterly filing, explains the regulatory framework behind them, traces what CBA’s rising risk-weighted assets reveal about its lending activity, and places the bank’s capital position alongside its share price performance and major bank peers.
CBA’s capital position in plain numbers: the headline ratios explained
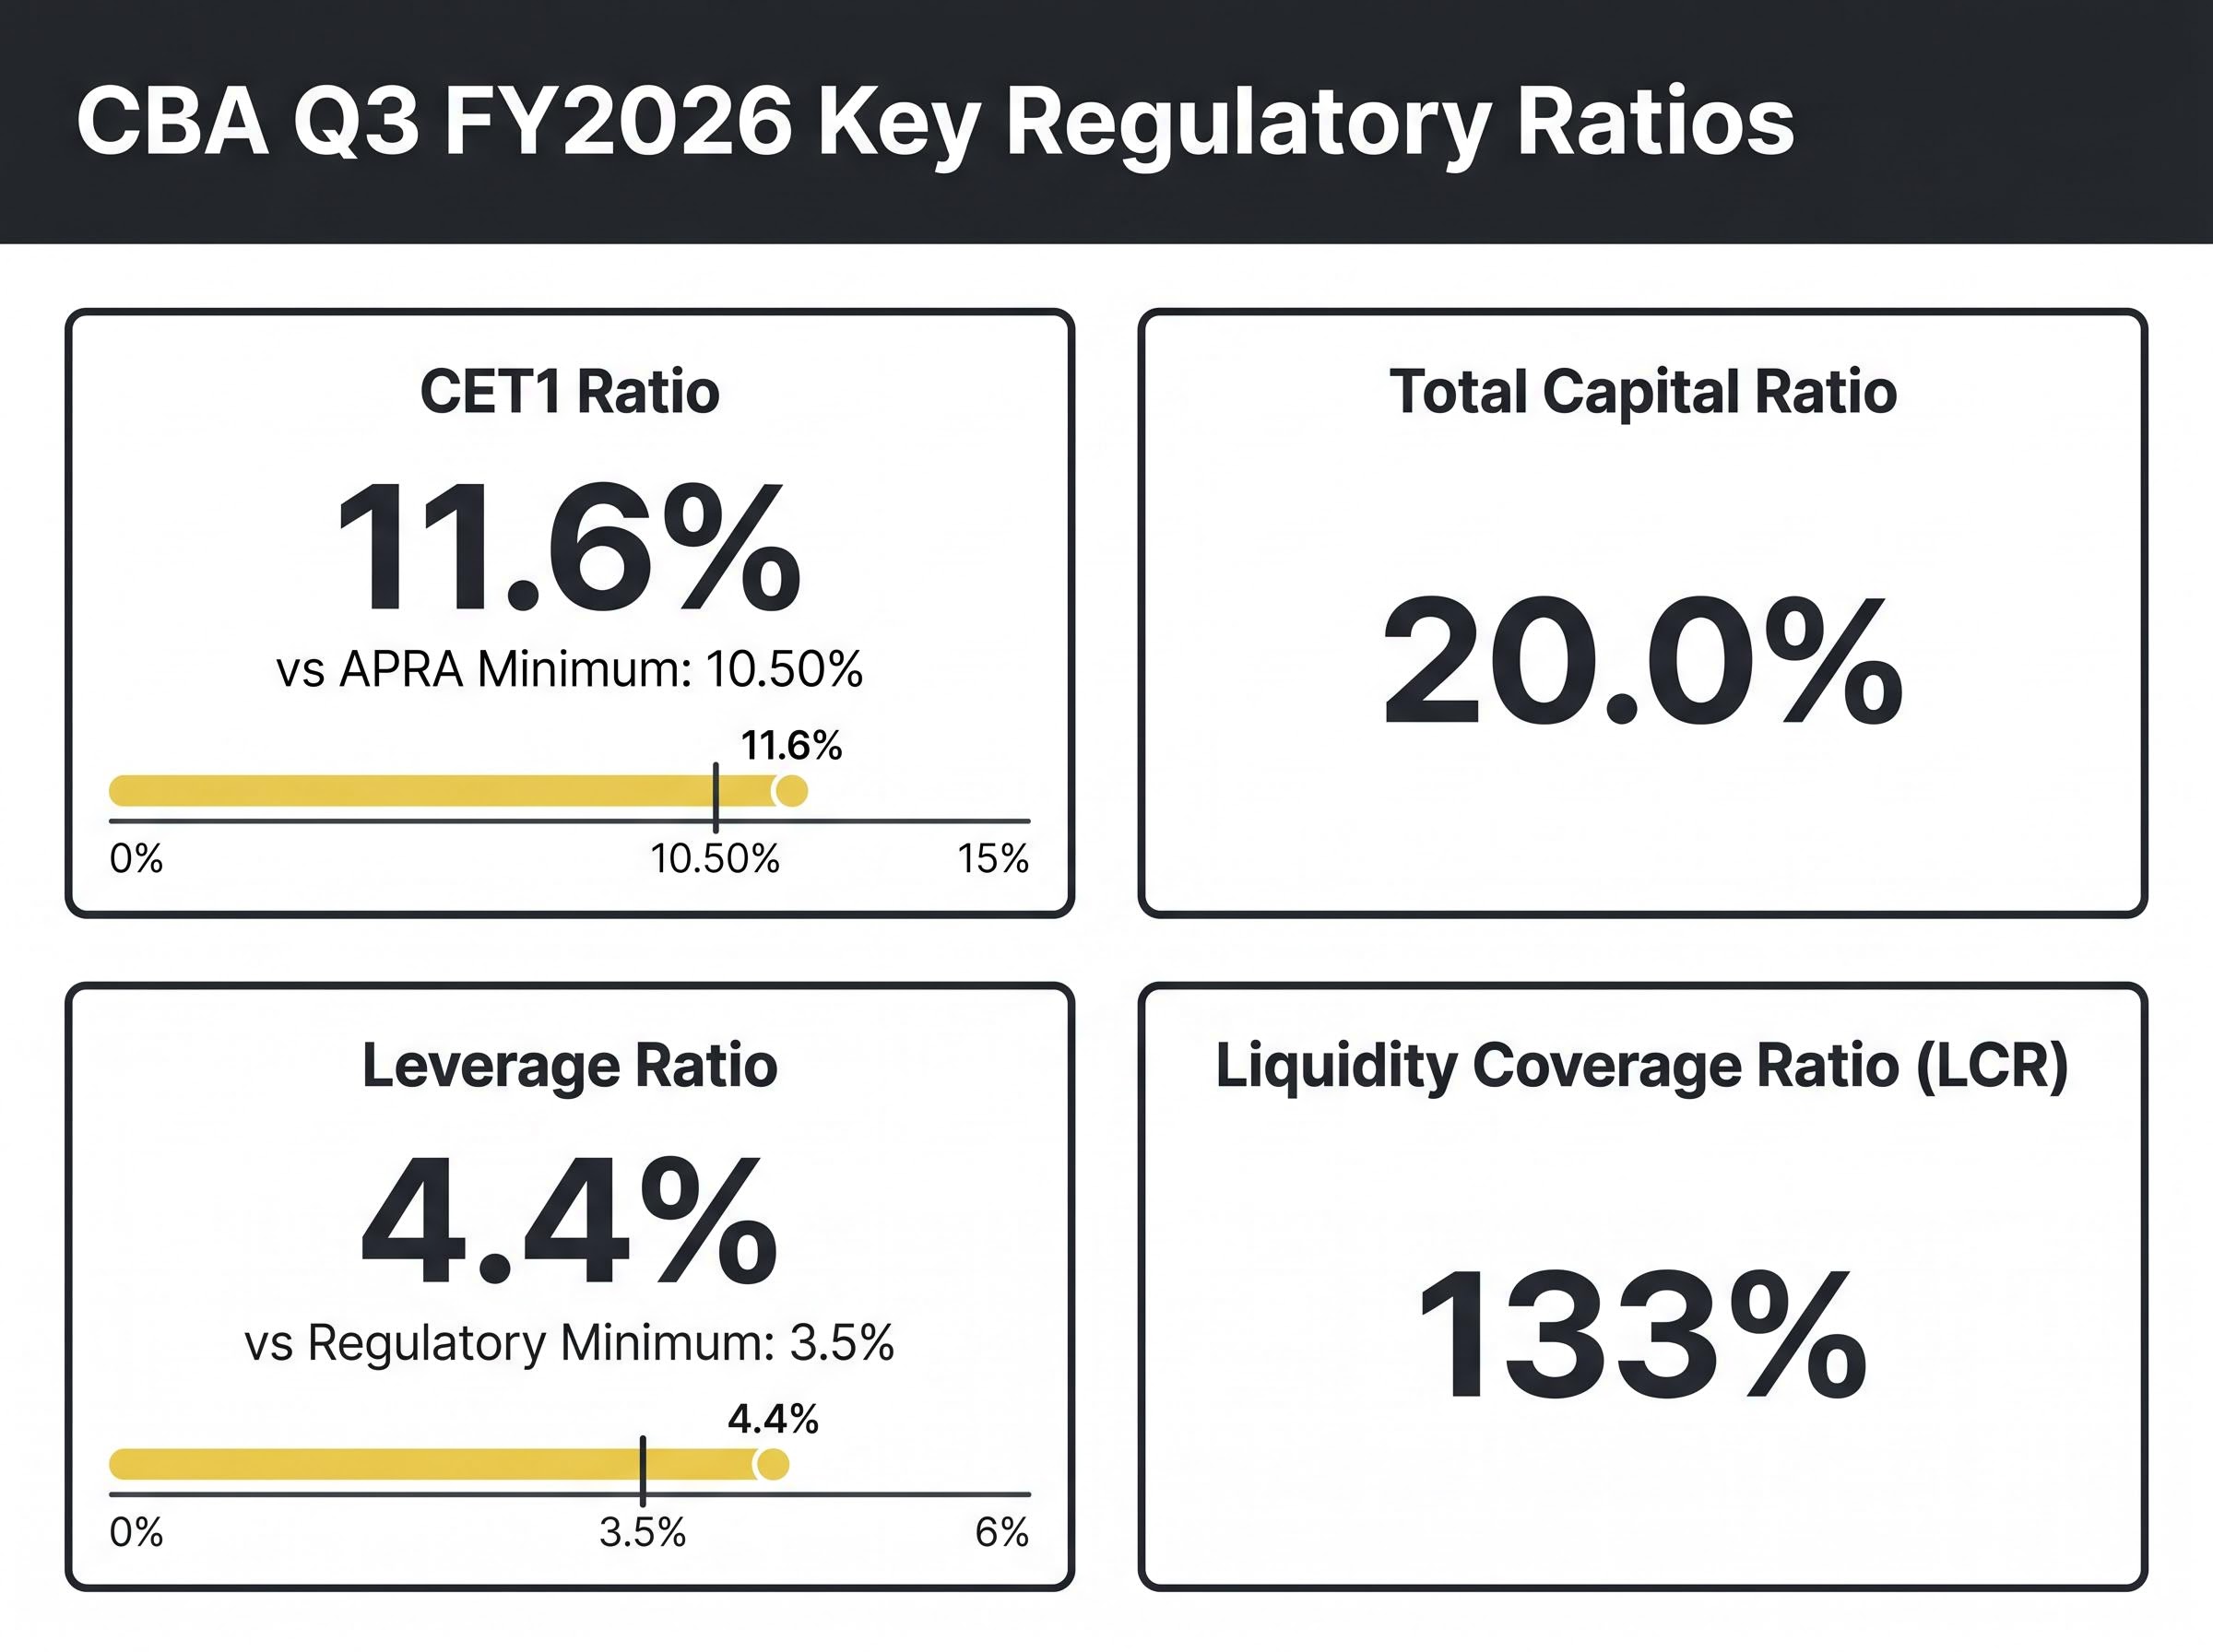
According to the disclosure, the two headline outputs from CBA’s Q3 FY2026 Pillar 3 disclosure are the CET1 ratio of 11.6% and a total capital ratio of 20.0%. According to the disclosure, the CET1 figure improved 7 basis points from the prior quarter ended 31 December 2025, reflecting modest organic capital generation. According to the disclosure, the total capital ratio, by contrast, declined from 20.6%, a movement driven by growth in risk-weighted assets outpacing new capital instruments during the period.
APRA’s D-SIB minimum CET1 requirement: 10.50% This threshold includes the capital conservation buffer and the surcharge applied to Australia’s domestically systemically important banks, effective 2026.
CBA’s 110 basis point buffer above that floor provides headroom, though it sits at the lower end of the major bank peer range. The four ratios investors should track from each quarterly filing:
CET1 is one of three metrics at the centre of ASX bank valuation, alongside net interest margin and return on equity; professional analysts typically read these three figures together to assess whether a bank’s capital position supports or constrains its earnings growth and dividend sustainability.
APRA’s capital adequacy framework for D-SIBs specifies that the 10.5% CET1 minimum incorporates both the capital conservation buffer and the additional surcharge applied to institutions whose failure would carry systemic consequences for the Australian financial system.
- CET1 ratio: 11.6% (the highest-quality, loss-absorbing equity capital measure)
- Total capital ratio: 20.0% (includes Tier 2 subordinated debt instruments)
- Leverage ratio: According to the disclosure, 4.4% (against a regulatory minimum of 3.5%)
- Liquidity Coverage Ratio (LCR): According to the disclosure, averaged 133% during the quarter
When big ASX news breaks, our subscribers know first
What Basel III Pillar 3 disclosures actually are and why banks publish them
Pillar 3 disclosures are mandatory quarterly publications required by APRA under the Basel III international banking framework. Their purpose is market transparency: giving investors, analysts, and counterparties a standardised view of a bank’s capital adequacy and risk exposure.
APRA’s regulatory framework for capital adequacy is not static; in May 2026 APRA temporarily withdrew its ECAI recognition guidelines for periodic review, a move that leaves APS 112 operative but signals the regulator is actively refreshing the broader Basel III implementation architecture that banks like CBA must navigate.
Basel III operates through three pillars:
- Pillar 1 (Minimum capital requirements): Sets the quantitative floors banks must hold against credit, market, and operational risk.
- Pillar 2 (Supervisory review): Gives regulators the authority to require additional capital buffers based on institution-specific risk profiles.
- Pillar 3 (Market disclosure): Requires banks to publish standardised capital and risk data so that external parties can assess financial health independently.
Investors interact primarily with Pillar 3 outputs. CBA publishes these reports quarterly, aligned to each quarter-end (September, December, March, June). The March 2026 quarter report appeared in May 2026. For comparison, the September 2025 quarter disclosure showed a CET1 of 11.8%, indicating a modest decline over two quarters.
How to read CBA’s quarterly Pillar 3 report
The line items that matter most to shareholders are the CET1 ratio, total capital ratio, total risk-weighted assets, and liquidity ratios (LCR and Net Stable Funding Ratio). These four metrics capture the bank’s loss-absorbing capacity, balance sheet resilience, and lending exposure in a single quarterly snapshot.
One distinction worth noting: the Pillar 3 report does not contain earnings figures, dividend declarations, or forward guidance. It is a regulatory health check, not a profit announcement. Investors who treat it as such will extract more useful signals from each filing.
Risk-weighted asset growth signals where CBA is lending
According to the disclosure, total RWA grew 2.4% to $517.5 billion during Q3 FY2026.
That single figure carries more information about CBA’s lending trajectory than any headline ratio. Risk-weighted assets (RWA) measure the total value of a bank’s assets adjusted for how risky each category is; the higher the figure, the more lending activity or risk the bank is carrying on its books.
| RWA Category | Q3 FY2026 | Quarter-on-Quarter Change |
|---|---|---|
| Credit Risk RWA | $414.6B | +1.3% |
| Other RWA (market, operational, IRRBB) | $102.9B | Includes elevated interest rate risk in the banking book |
| Total RWA | $517.5B | +2.4% |
According to the disclosure, credit risk RWA rose 1.3% to $414.6 billion, driven by growth across commercial lending and residential mortgage portfolios in both Australia and New Zealand. Elevated interest rate risk in the banking book contributed additional pressure to the total.
This is where the tension between growth and capital efficiency becomes visible. Higher RWA mechanically dilutes capital ratios, even when underlying capital remains stable. CBA’s CET1 ratio held at 11.6% partly because lending growth consumed some of the buffer that organic capital generation would otherwise have widened. For investors tracking loan book expansion between earnings seasons, this RWA line is the leading indicator to watch.
The $1.85 billion Tier 2 issuance and what it means for CBA’s capital stack
According to the disclosure, CBA completed a $1.85 billion subordinated notes issuance during Q3 FY2026.
This was not a sign of financial strain. It was a deliberate capital structure decision, part of CBA’s ongoing management of its regulatory capital hierarchy.
A bank’s capital stack has three layers:
- CET1 (Common Equity Tier 1): The highest-quality capital, consisting of ordinary shares and retained earnings. It absorbs losses first.
- Additional Tier 1 (AT1): Hybrid instruments such as convertible notes that can be written down or converted to equity under stress.
- Tier 2: Subordinated debt that provides an additional loss-absorbing buffer below equity. It ranks behind depositors and senior creditors in a wind-up scenario.
This layered structure explains why CBA’s total capital ratio of 20.0% is substantially higher than its 11.6% CET1 ratio. The Tier 2 issuance added to the lower layer while leaving the equity layer unchanged.
The total capital ratio still declined from 20.6% to 20.0% despite the new issuance, because the 2.4% growth in risk-weighted assets diluted the ratio faster than the fresh capital could offset. CBA also completed an on-market share buyback during the quarter to satisfy Dividend Reinvestment Plan obligations. Supporting liquidity metrics remained firm: the Liquidity Coverage Ratio averaged 133% and, according to the disclosure, the Net Stable Funding Ratio stood at 116%.
The next major ASX story will hit our subscribers first
CBA shares up 3% over the past year, but the ASX 200 gained twice that
According to company data, CBA shares rose approximately 3% over the 12 months to 13 May 2026, while the S&P/ASX 200 advanced roughly 6% over the same period.
The gap is worth examining. CBA closed at $171.57 on 12 May 2026, and the bank’s capital position by most measures is sound. A 110 basis point CET1 buffer above APRA’s floor is meaningful headroom.
One interpretation centres on capital efficiency. A CET1 ratio that sits comfortably above minimums reduces credit risk but can also signal to analysts that capital is being retained rather than deployed into higher-return lending or returned to shareholders through buybacks and dividends. Whether that conservatism is a strength or a drag depends on where the credit cycle heads next.
Morgans issued sell ratings on CBA and all three of its major bank peers in late April 2026, citing a projected 12-month total return of approximately negative 24% for CBA and forecasting Big Four provisions rising from roughly $2.4 billion in FY25 to approximately $5.5 billion by FY27, a bearish provisioning outlook that frames how analysts are reading the bank’s comfortable CET1 buffer.
| Bank | CET1 Ratio | Reference Period |
|---|---|---|
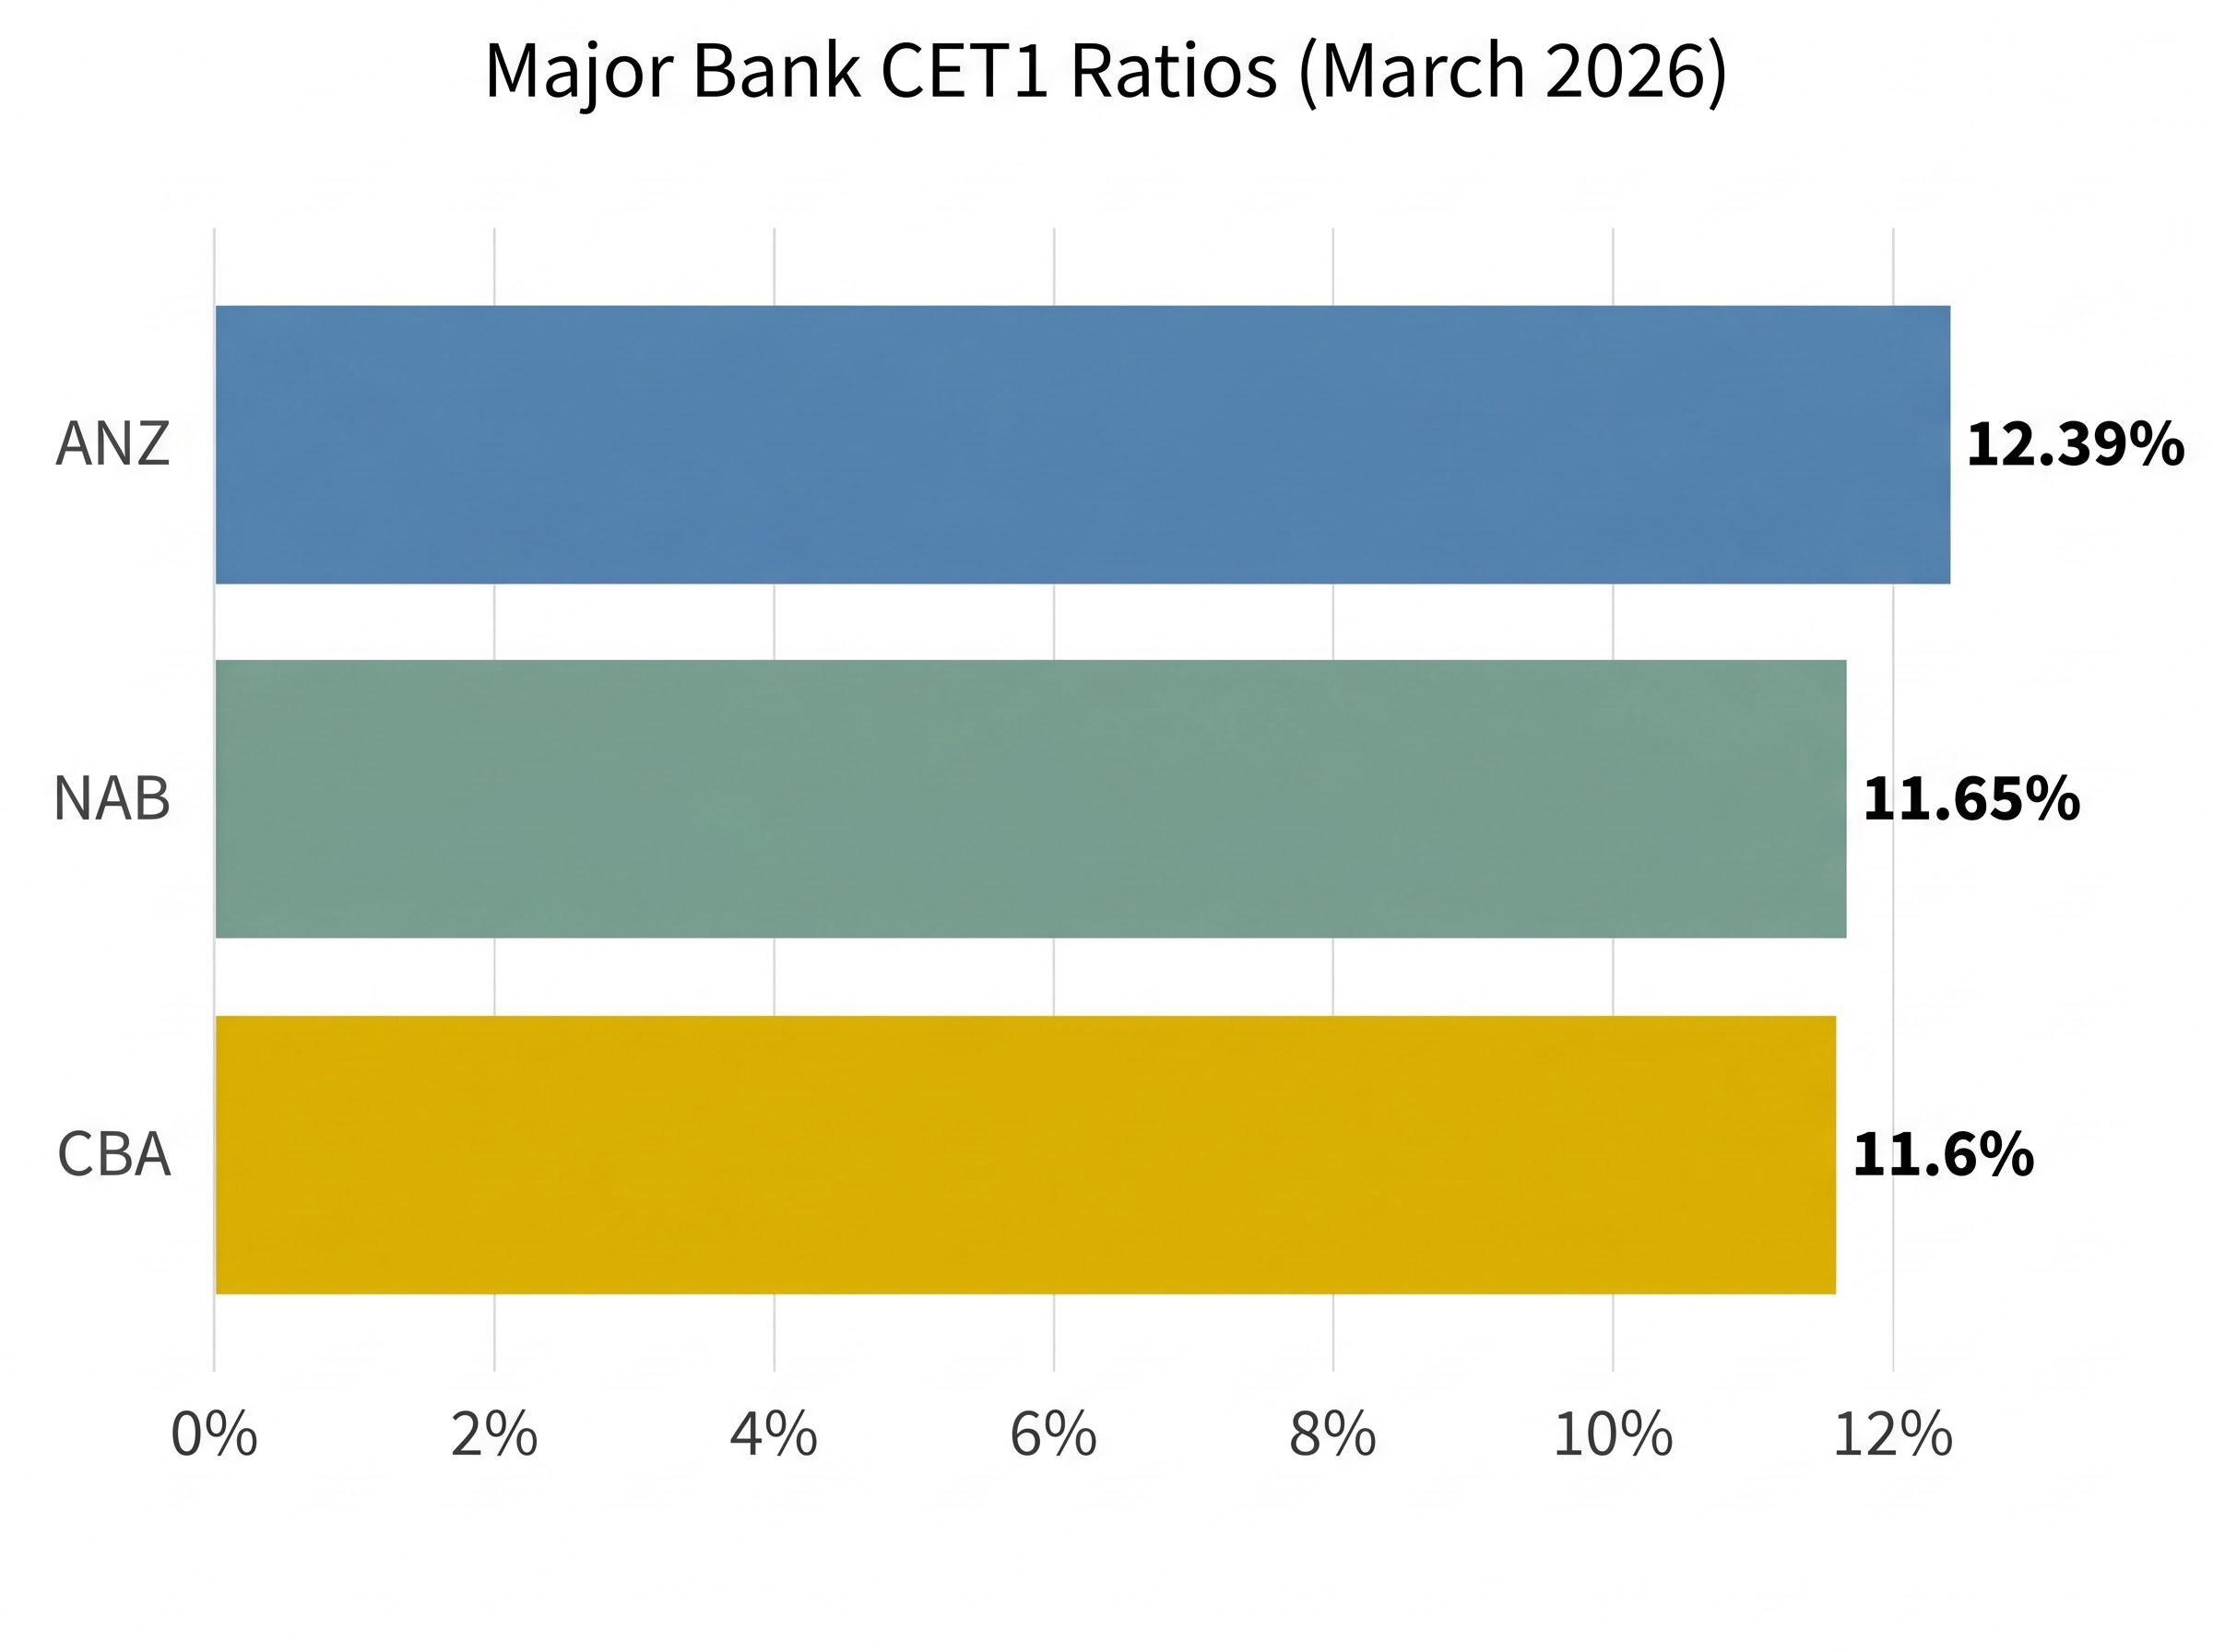
| ANZ | 12.39% | March 2026 |
| NAB | 11.65% | March 2026 |
| CBA | 11.6% | March 2026 |
| Westpac | Increased ~11 bps in quarter; absolute level unconfirmed | March 2026 |
CBA sits at the lower end of the major bank peer group. ANZ leads at 12.39%, while NAB at 11.65% is only marginally above CBA’s level. The peer comparison provides a concrete frame for assessing whether CBA’s capital efficiency is a competitive advantage or a constraint on shareholder returns.
Reading CET1 relative to operating targets, rather than just regulatory minimums, is how analysts assess whether a bank is running capital conservatively or efficiently; NAB’s reported CET1 of 11.65% sits 40 basis points above its self-imposed operating target, a framing that sharpens the peer comparison with CBA’s 11.6% and reveals different management preferences within a similar absolute range.
Capital adequacy is a floor, not a forecast
CBA’s Q3 FY2026 Pillar 3 disclosure paints a bank operating comfortably above APRA’s regulatory minimums, actively managing its capital stack through Tier 2 issuance, and expanding its loan book at a pace that puts upward pressure on risk-weighted assets. The share price underperformance relative to the ASX 200 reflects market sentiment about capital efficiency and growth velocity rather than a deterioration in the bank’s underlying financial position.
The four metrics to carry forward:
- CET1 ratio: 11.6%
- Total capital ratio: 20.0%
- Liquidity Coverage Ratio: 133%
- Net Stable Funding Ratio: 116%
The next CBA Pillar 3 disclosure, covering the June 2026 quarter, will be the logical next data point. Reports are published on the CBA investor relations Pillar 3 capital disclosures page.
This article is for informational purposes only and should not be considered financial advice. Investors should conduct their own research and consult with financial professionals before making investment decisions.