SpaceX IPO: Is SPCX Worth Buying at 95x Revenue?
24 mins ago

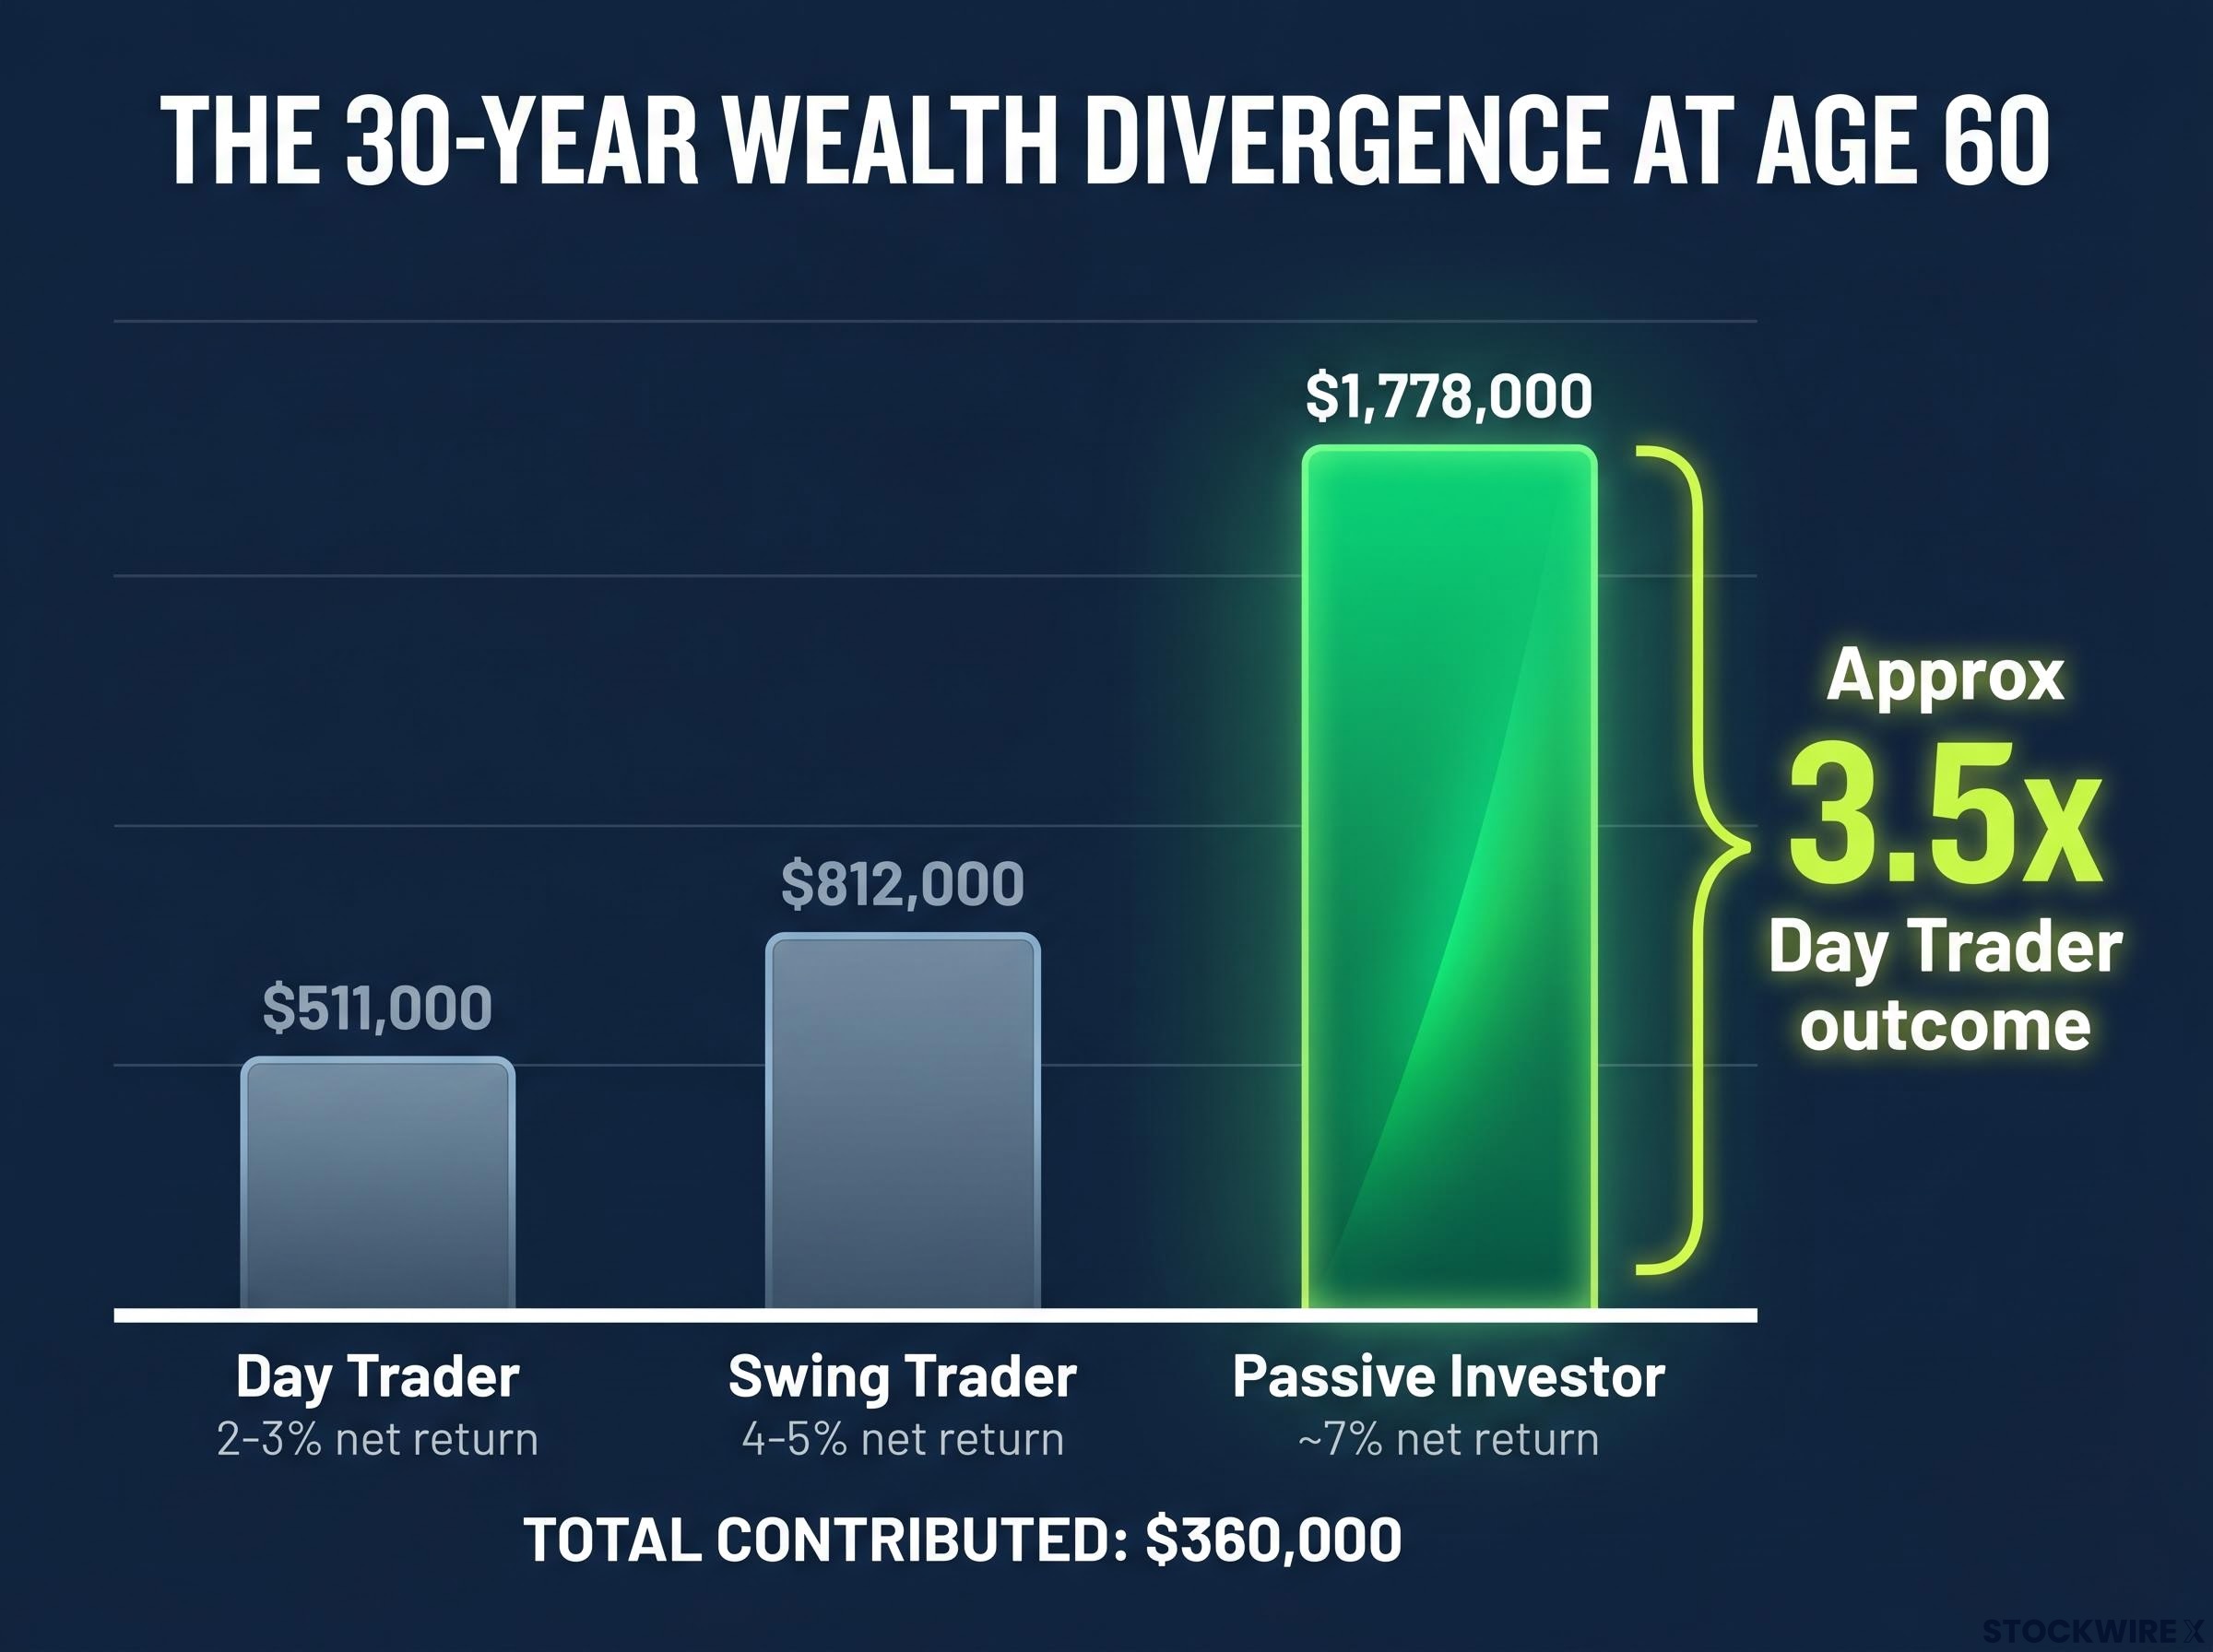
Three investors start at age 30. Each earns $75,000 a year. Each contributes $1,000 a month to a taxable brokerage account and keeps it up for 30 years. At age 60, one finishes with roughly $1.78 million. Another finishes with $812,000. The third, despite outperforming the vast majority of active traders, finishes with $511,000. The only variable that changed was how often they traded. The comparison between day trading, swing trading, and long-term index investing is one of the most searched topics in personal finance, yet most treatments stay at the level of generalisation. What follows is a controlled, three-investor scenario with five-year portfolio milestones, a structural cost breakdown covering taxes, friction, and timing, and a decision framework built on the numbers rather than around them.
The three investors share identical starting conditions: age 30, annual income of $75,000, a $1,000 monthly contribution, and a 30-year horizon to age 60. Total capital contributed across all three is $360,000. The only difference is strategy.
Assumed net annual returns are stated for transparency: passive investor approximately 7%; swing trader 4-5%; day trader 2-3%. No leverage is assumed for the day trader, which is itself a simplification; many real-world day traders use margin, which would amplify losses in adverse conditions.
| Investor | Strategy | Avg. Holding Period | Primary Vehicle |
|---|---|---|---|
| Day trader | Intraday technical trading | Minutes to hours | Individual equities |
| Swing trader | Short-term price swing capture | Days to weeks | Individual equities |
| Passive investor | Buy-and-hold indexing | Years to decades | Low-cost S&P 500 index fund |
Any terminal wealth difference that emerges from this framework reflects strategy performance alone, not savings behaviour, income, or contribution discipline.
At year 5, the portfolios are close enough to seem interchangeable. The passive investor has roughly $75,000. The swing trader sits at approximately $68,000. The day trader trails slightly at $63,000. The gaps are modest, barely worth remarking on.
By year 15, compounding begins to pull the paths apart. The passive investor reaches approximately $373,000; the swing trader, $264,000; the day trader, $213,000. The absolute gap between passive and day trading has grown to $160,000.
The passive investor in this scenario crosses the portfolio crossover point somewhere around year 17, when annual market gains begin to permanently exceed the $12,000 yearly contribution, at which stage the portfolio becomes largely self-sustaining regardless of whether the investor continues contributing.
From year 20 onward, the divergence accelerates sharply. The passive portfolio crosses $656,000, then $1,095,000 at year 25, and reaches approximately $1,778,000 at year 30. The day trader, meanwhile, finishes at roughly $511,000. The swing trader lands near $812,000.
| Year | Day Trader | Swing Trader | Passive Investor |
|---|---|---|---|
| 5 | ~$63,000 | ~$68,000 | ~$75,000 |
| 10 | ~$134,000 | ~$154,000 | ~$192,000 |
| 15 | ~$213,000 | ~$264,000 | ~$373,000 |
| 20 | ~$302,000 | ~$499,000 | ~$656,000 |
| 25 | ~$400,000 | — | ~$1,095,000 |
| 30 | ~$511,000 | ~$812,000 | ~$1,778,000 |
One detail matters more than any row in this table: the day trader scenario assumes the investor outperforms approximately 80% of all active traders. A landmark study by Barber, Lee, Liu, and Odean, examining tens of thousands of Taiwanese day trading accounts, found that over 80% lost money net of fees, and only a small fraction achieved persistent excess returns. The $511,000 outcome is not a cautionary tale about a bad trader. It is an optimistic scenario.
The passive investor finishes with approximately 3.5 times the day trader’s terminal balance, despite contributing the same $360,000 over 30 years.
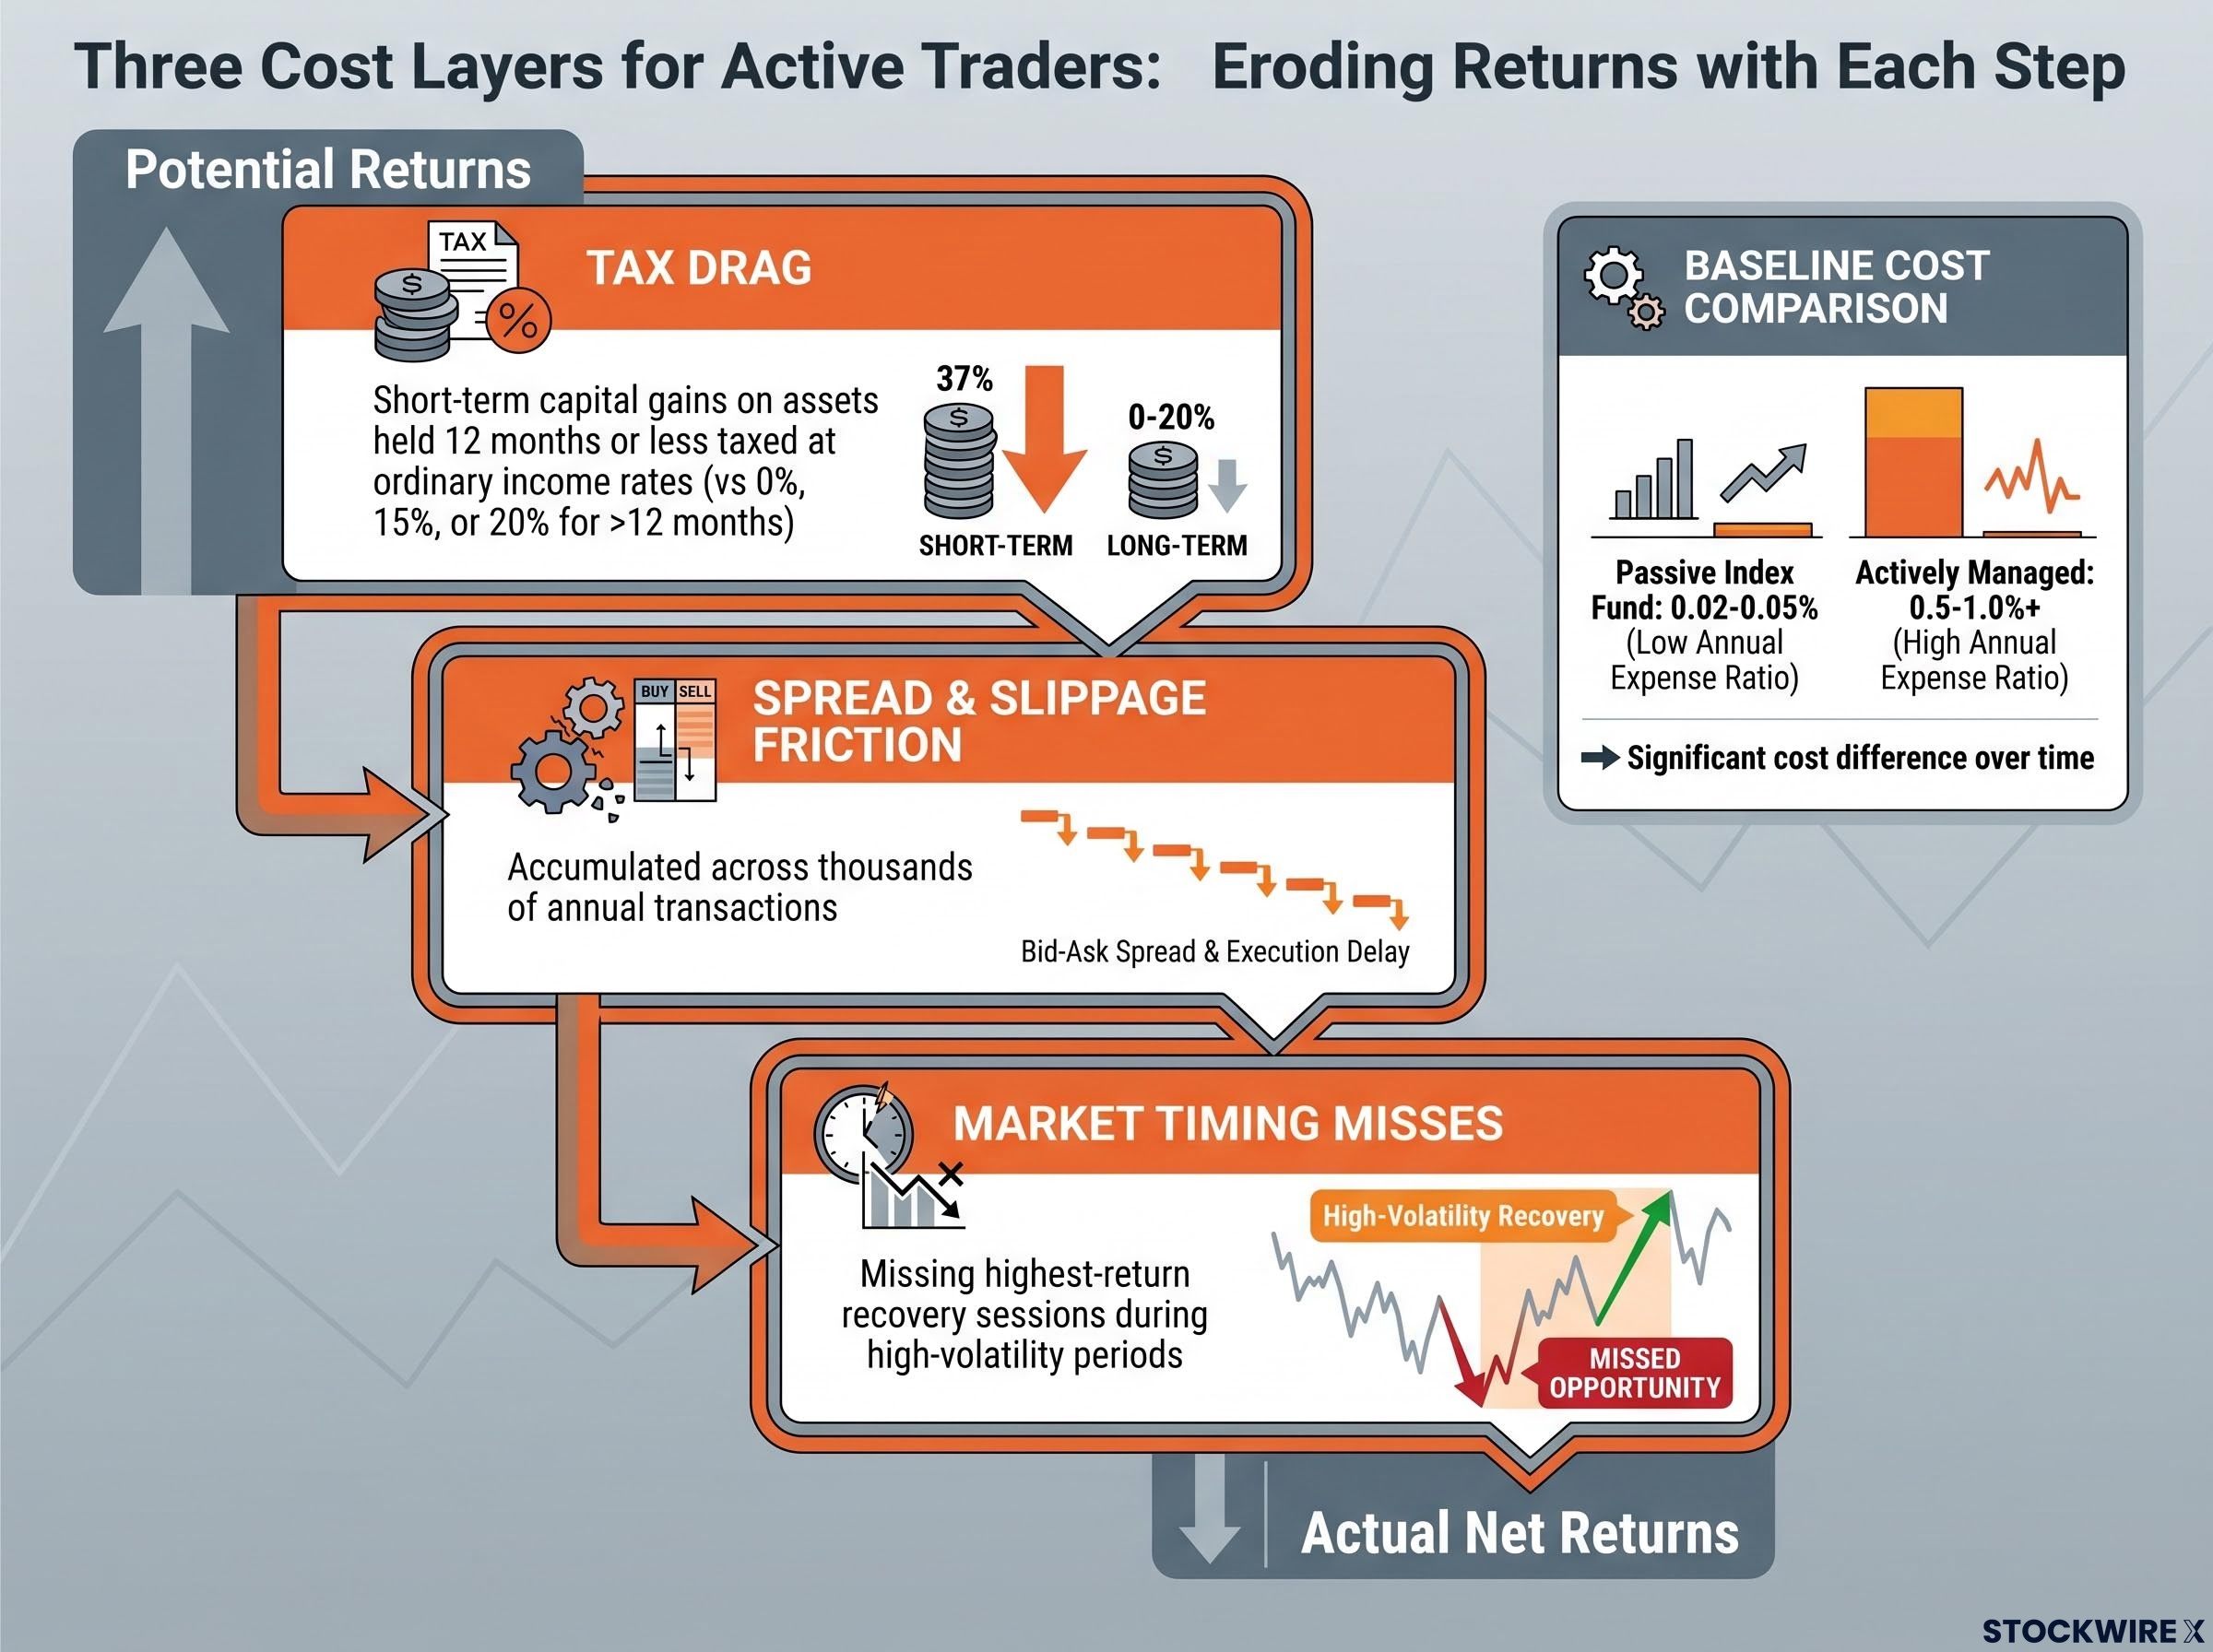
Three structural mechanisms explain why the gap opens so relentlessly. Taxes are the first and most underappreciated.
U.S. capital gains tax distinguishes between short-term and long-term treatment. Assets held for 12 months or less are taxed at ordinary income rates, the same rates applied to salary and wages. Assets held for more than 12 months qualify for preferential federal rates of 0%, 15%, or 20%, depending on taxable income.
Day traders realise gains within hours. The short-term rate applies to virtually every transaction. Swing traders hold for days to weeks, but “days to weeks” is still well inside the 12-month window. Qualifying for long-term treatment requires holding past the one-year mark, a requirement structurally incompatible with an active rotation strategy.
The IRS capital gains tax treatment distinguishes between short-term gains taxed at ordinary income rates and long-term gains qualifying for preferential rates of 0%, 15%, or 20%, with the one-year holding threshold being the structural dividing line that active traders almost never cross.
The passive investor controls when taxable events occur and typically defers realisation for years or decades. This deferral has a compounding effect that accumulates over the full investment horizon:
The tax advantage is not incidental. It is structural, and it widens with every passing year.
The passive investor’s tax deferral advantage assumes current law remains stable, but unrealized capital gains tax proposals at the federal level, including constitutional questions left open by Moore v. United States in 2024, represent a tail risk that long-term investors and their advisers should monitor when stress-testing 30-year projections.
Taxes remove capital from the compounding base annually. Transaction friction and timing failures compound the damage.
Even with near-zero commissions, bid-ask spreads and slippage apply to every trade. These costs do not appear on brokerage statements, but they erode returns as reliably as any explicit fee. A day trader executing thousands of transactions per year accumulates friction that, over a 30-year period, consumes a meaningful share of gross returns.
The third drag is market timing. Research on S&P 500 returns over multi-decade periods consistently shows that missing just a handful of the best trading days dramatically reduces total returns. Those best days tend to cluster during high-volatility periods, precisely when cautious or active traders are most likely to be defensively positioned or sitting in cash.
Research consistently shows the best days in U.S. equity markets cluster during the most volatile periods, when cautious or active traders are least likely to be fully invested.
The passive investor sidesteps all three mechanisms. A low-cost index fund carries expense ratios as low as 0.02-0.05% annually, compared with 0.5-1.0% or more for actively managed funds. There are no spreads on monthly contributions, no slippage, and full participation in every recovery rally. Ranked by typical magnitude for an active day trader, the three cost layers are:
Swing trading’s appeal is understandable. It demands less screen time than day trading. It involves fewer transactions. It reduces direct friction costs.
Lower transaction frequency does reduce friction costs relative to day trading. There is no requirement for full-time market monitoring, making it compatible with salaried employment. For time-constrained investors who feel drawn to active strategies, swing trading appears to offer the best of both worlds.
The two most structurally damaging drags remain fully intact:
The swing trader in this scenario finishes at approximately $812,000. The passive investor finishes at approximately $1,778,000. The gap is roughly $966,000, representing an effective annual return of 4-5% net versus the passive investor’s approximately 7%. “Less bad than day trading” is a real advantage, but it still compounds into nearly a million dollars of foregone retirement wealth.
The data points toward a clear baseline: passive index investing in a low-cost S&P 500 fund is the appropriate primary retirement vehicle for most American investors. The $1.78 million terminal value from identical contributions is the benchmark against which any alternative strategy should be measured.
The passive strategy only delivers its full compounding advantage when the investor stays consistently invested: research on index fund investing shows that approximately 60% of new investors exit the market around year six, forfeiting compounding gains that accelerate most sharply in years 10 through 30.
For investors who want to trade actively, a tiered framework grounds the decision:
The Barber et al. finding bears repeating: the $511,000 day trader outcome represents a top-20% performer. A typical day trader’s result would be substantially worse.
Day trading also carries an opportunity cost that rarely enters the calculation. The screen time required to trade actively, often several hours per day, represents time that could be spent earning income, building skills, or simply living. The passive strategy that produced the highest terminal wealth required near-zero ongoing attention.
| Strategy | Recommended Role in Portfolio | Key Condition |
|---|---|---|
| Passive indexing | Primary retirement vehicle | Low-cost S&P 500 fund, held for decades |
| Swing trading | Small discretionary allocation only | Funded with capital the investor can afford to lose entirely |
| Day trading | Small discretionary allocation only | Same as swing trading, with realistic assessment of time costs |
Over 30 years, $360,000 in identical contributions produced $1,778,000 for the passive investor, $812,000 for the swing trader, and $511,000 for the day trader. Those figures are the only scorecard that matters for retirement outcomes.
The passive strategy’s greatest advantage may be its simplicity. There are no timing decisions to second-guess, no tax-optimisation errors to correct, no discipline failures during volatile sessions. It simply compounds, year after year, on the full pre-tax base.
The variables that matter most are the ones every investor controls directly: time horizon, contribution rate, and whether the capital stays invested long enough for compounding to do its work.
For investors ready to move from this comparison to concrete implementation, our dedicated guide to long-term investment strategies covers dividend investing, index ETFs, bonds, and buy-and-hold methods with portfolio construction guidance grounded in 150 years of S&P 500 return data.
This article is for informational purposes only and should not be considered financial advice. Investors should conduct their own research and consult with financial professionals before making investment decisions. Past performance does not guarantee future results. Financial projections are subject to market conditions and various risk factors.
Day trading involves closing all positions within a single session using technical analysis; swing trading holds positions for days to weeks targeting short-term price movements; long-term investing means buying and holding a diversified fund for years or decades, typically an index fund tracking the S&P 500.
In a controlled scenario with identical $1,000 monthly contributions over 30 years, a top-performing day trader finishes with approximately $511,000 while a passive index investor finishes with approximately $1,778,000, a gap of over $1.26 million from the same $360,000 total contributed.
Three structural drags reduce day trading returns: short-term capital gains tax (applied at ordinary income rates because positions are held under 12 months), bid-ask spread and slippage friction from thousands of annual transactions, and missing the market's best recovery days by being out of position during volatile periods.
Swing trading reduces transaction friction relative to day trading but does not close the wealth gap, because most swing trade gains still fall within the 12-month window and attract ordinary income tax rates, and every entry and exit decision risks missing high-return recovery sessions; the swing trader in the scenario finishes at $812,000 versus $1,778,000 for the passive investor.
The article recommends establishing a passive low-cost S&P 500 index fund as the primary retirement core first, then funding any active trading (day or swing) only from a small, ring-fenced discretionary allocation that the investor can afford to lose entirely, keeping retirement capital separate from speculative activity.