KOSPI Drops 10% as Crowded AI Trade Unwinds Across Global Markets
3 hrs ago

Australia’s Big Four banks, Commonwealth Bank of Australia (CBA), Westpac, NAB, and ANZ, collectively account for roughly 25% of the S&P/ASX 200 by market capitalisation. What happens to these four stocks does not stay within the banking sector; it shapes the index itself. Through the first four months of 2026, these banks have been pulled in competing directions: a market correction that dragged the ASX 200 down 10.2% from its February peak, a rate hike to 4.10% in March, a rotation back into financials, and an analyst consensus that ranges from neutral on ANZ to aggressively bearish on CBA. The ASX 200 Financials sector is nonetheless up 8.87% year to date as of late April. This analysis unpacks what each of the Big Four has actually delivered in 2026, why the divergence in analyst sentiment matters, and where the sector stands for retail investors making allocation decisions heading into the May 5 RBA meeting.
The ASX 200 hit an all-time high of 9,202.9 in late February 2026. Within a month, it had fallen to 8,262 on 23 March 2026, a decline of 10.2% and the sharpest correction the index had absorbed since the pandemic recovery.
The ASX 200 fell 10.2% from its February peak to its March trough, shedding roughly 940 points in less than four weeks.
By 16 April, the index had climbed back to 8,955.00, recovering much of the lost ground but leaving investors with a question the rally had not answered: whether the conditions that produced the correction had actually changed, or whether the recovery was running on rotation momentum alone.
Four macro factors shaped the environment for ASX bank shares during this period:
The RBA’s March 2026 monetary policy decision cited persistent inflation and a resilient labour market as the primary justifications for the 25 basis point increase, signalling that the board was not yet satisfied that inflation was on a sufficiently reliable path back to the 2-3% target band.
That 8.87% headline, achieved against the backdrop of a 10% drawdown and a rate hike, looks more fragile than the number alone suggests.
Index concentration risk is particularly acute in this cycle: the ASX 200’s year-to-date gain is almost entirely dependent on bank stock performance, meaning passive investors in domestic index funds are running a concentrated bet on four banks and their shared macro exposures rather than the diversified position the index label implies.
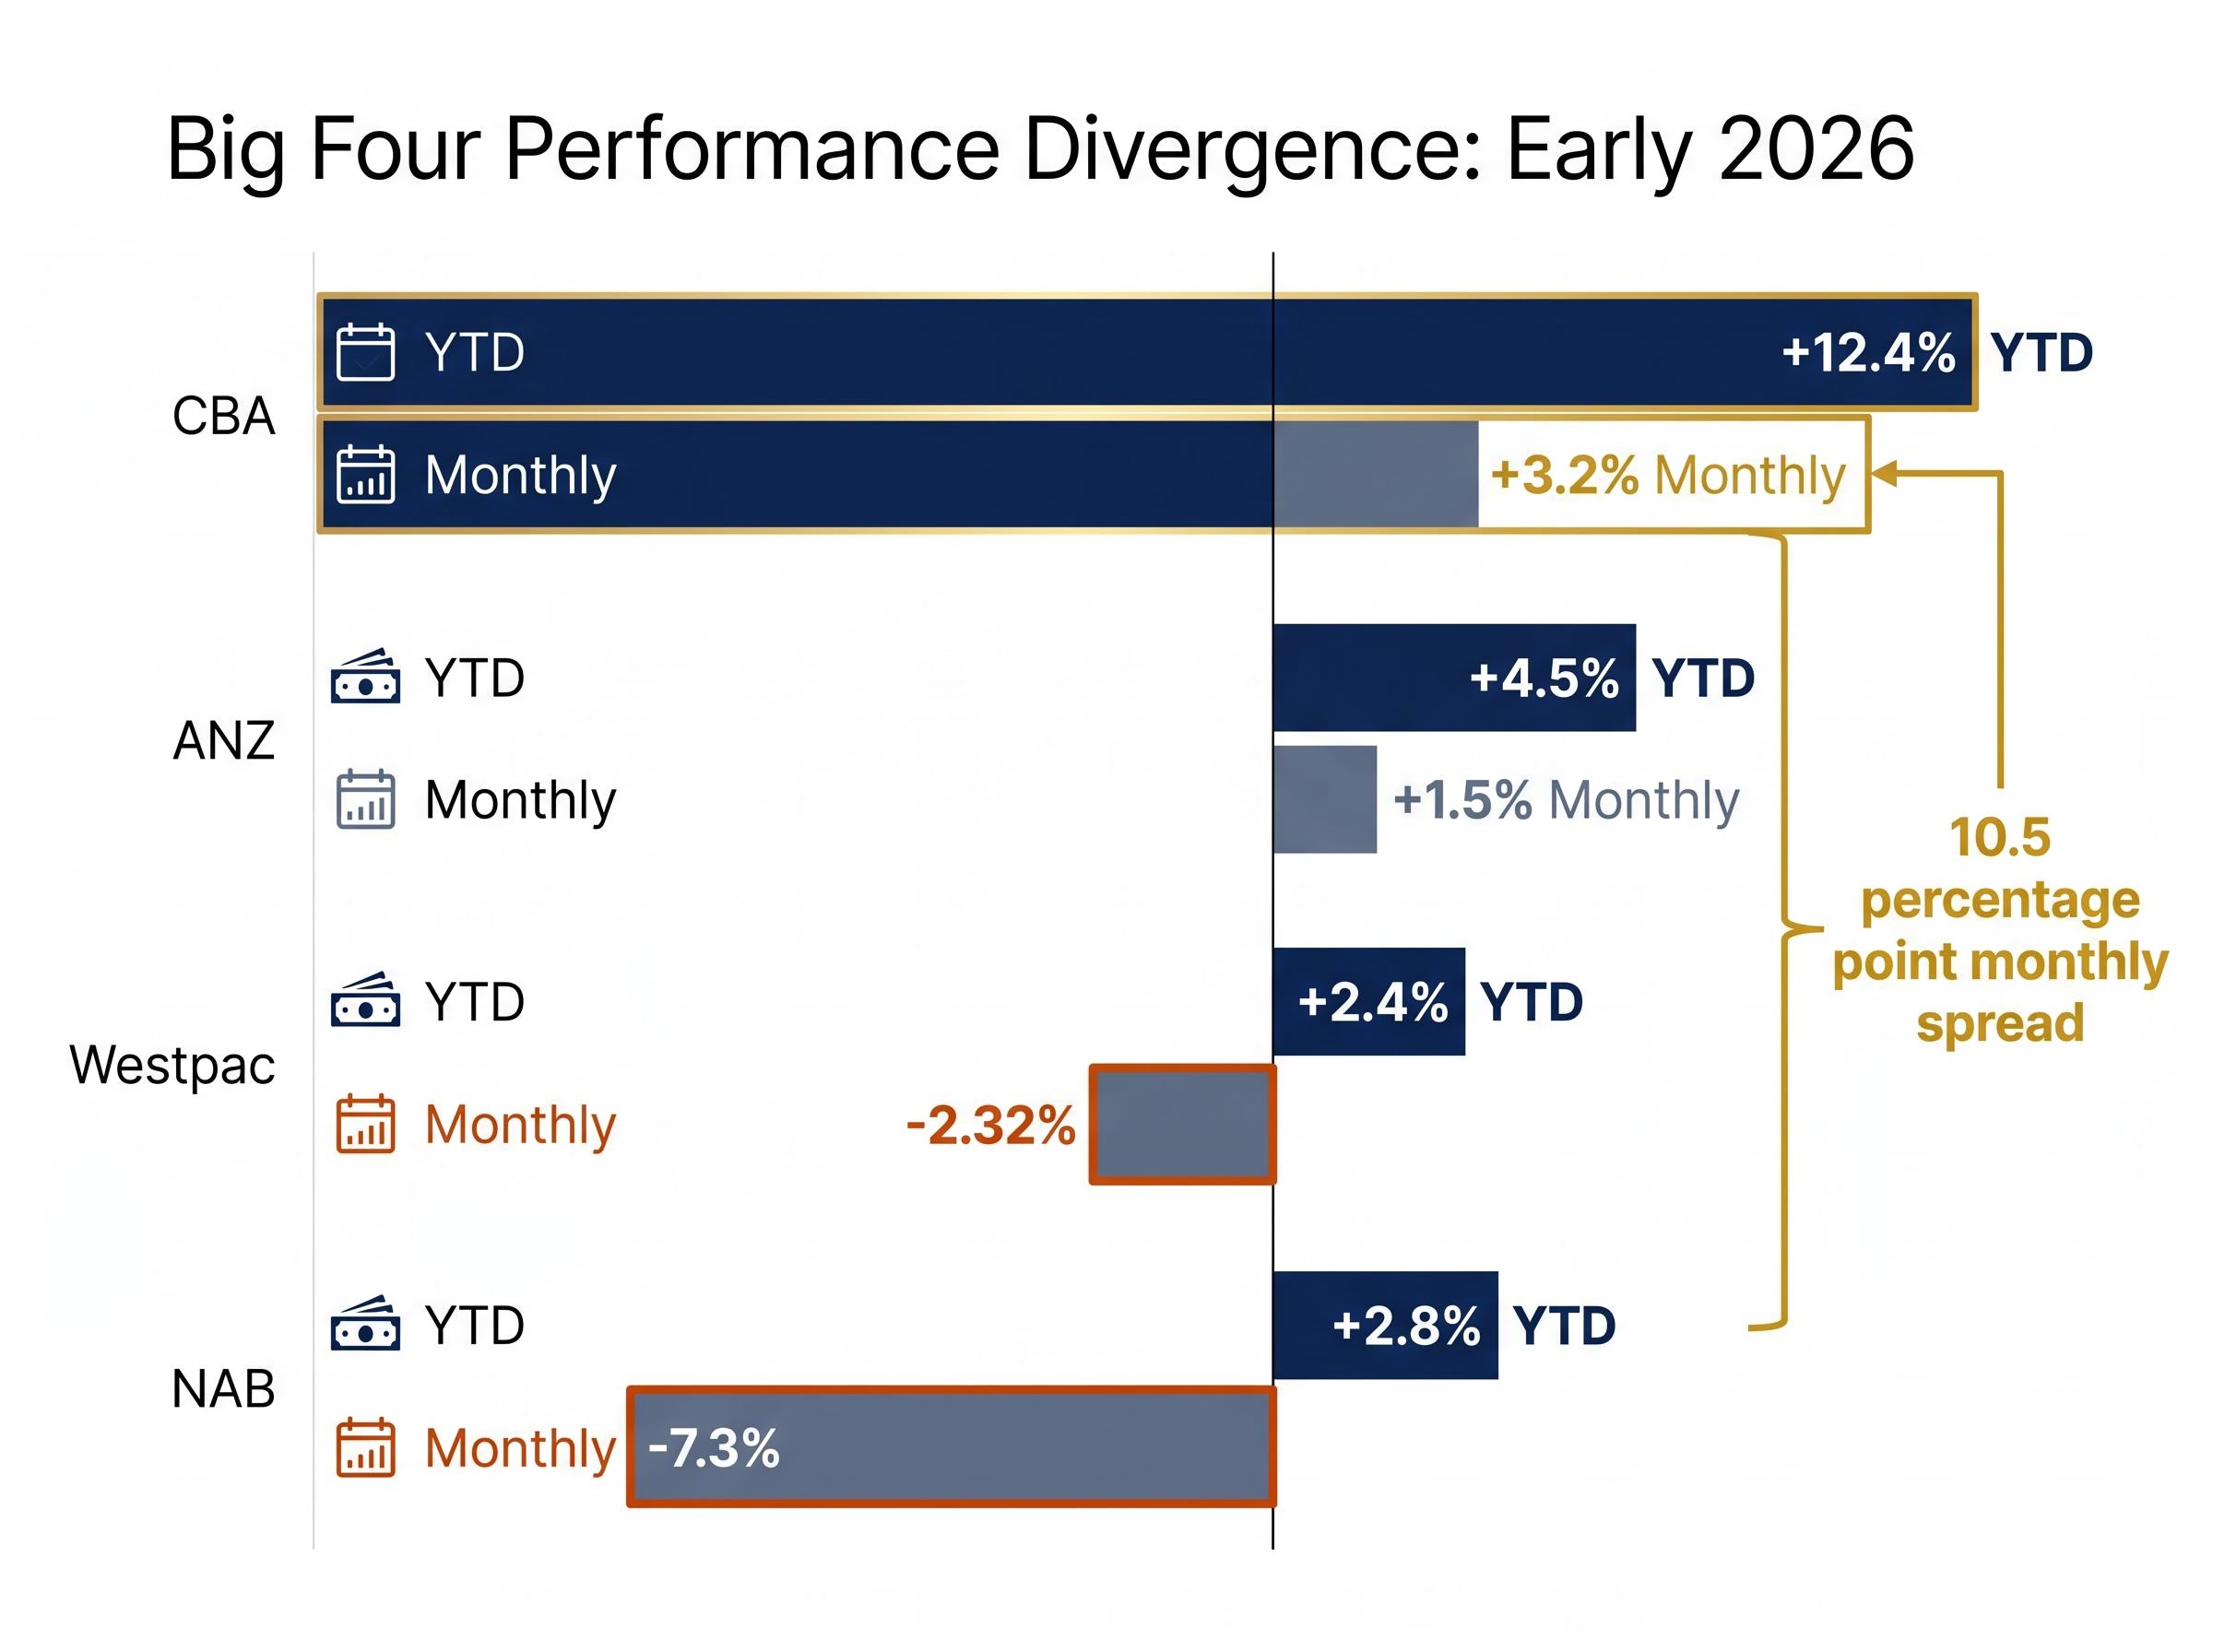
The four banks moved at meaningfully different speeds through 2026. CBA extended its multi-year run with a 12.4% year-to-date gain. NAB, over the same period, posted only 2.8% and suffered a 7.3% monthly decline. The gap between the best and worst performer in a single month reached 10.5 percentage points, a spread wide enough to make stock selection within the sector more consequential than sector allocation itself.
| Bank | Monthly Return | YTD Return | 16 April Close | 16 April Daily Change |
|---|---|---|---|---|
| CBA | +3.2% | +12.4% | ~$184.78 | -1.16% |
| ANZ | +1.5% | +4.5% | $37.89 | -0.85% |
| Westpac | -2.32% | +2.4% | $40.04 | -1.60% |
| NAB | -7.3% | +2.8% | $43.47 | -2.35% |
On 16 April alone, all four banks declined, led by NAB at -2.35%. Contributing headwinds on the day included a refinery outage, elevated rate expectations, and mixed offshore signals. The simultaneous sell-off reflected a cluster of short-term pressures rather than a structural sector breakdown.
The 10.5 percentage point spread between CBA’s monthly gain and NAB’s monthly decline indicates that treating the Big Four as interchangeable has carried a measurable cost in 2026.
The bearish wall across the Big Four is broad, but it is not uniform.
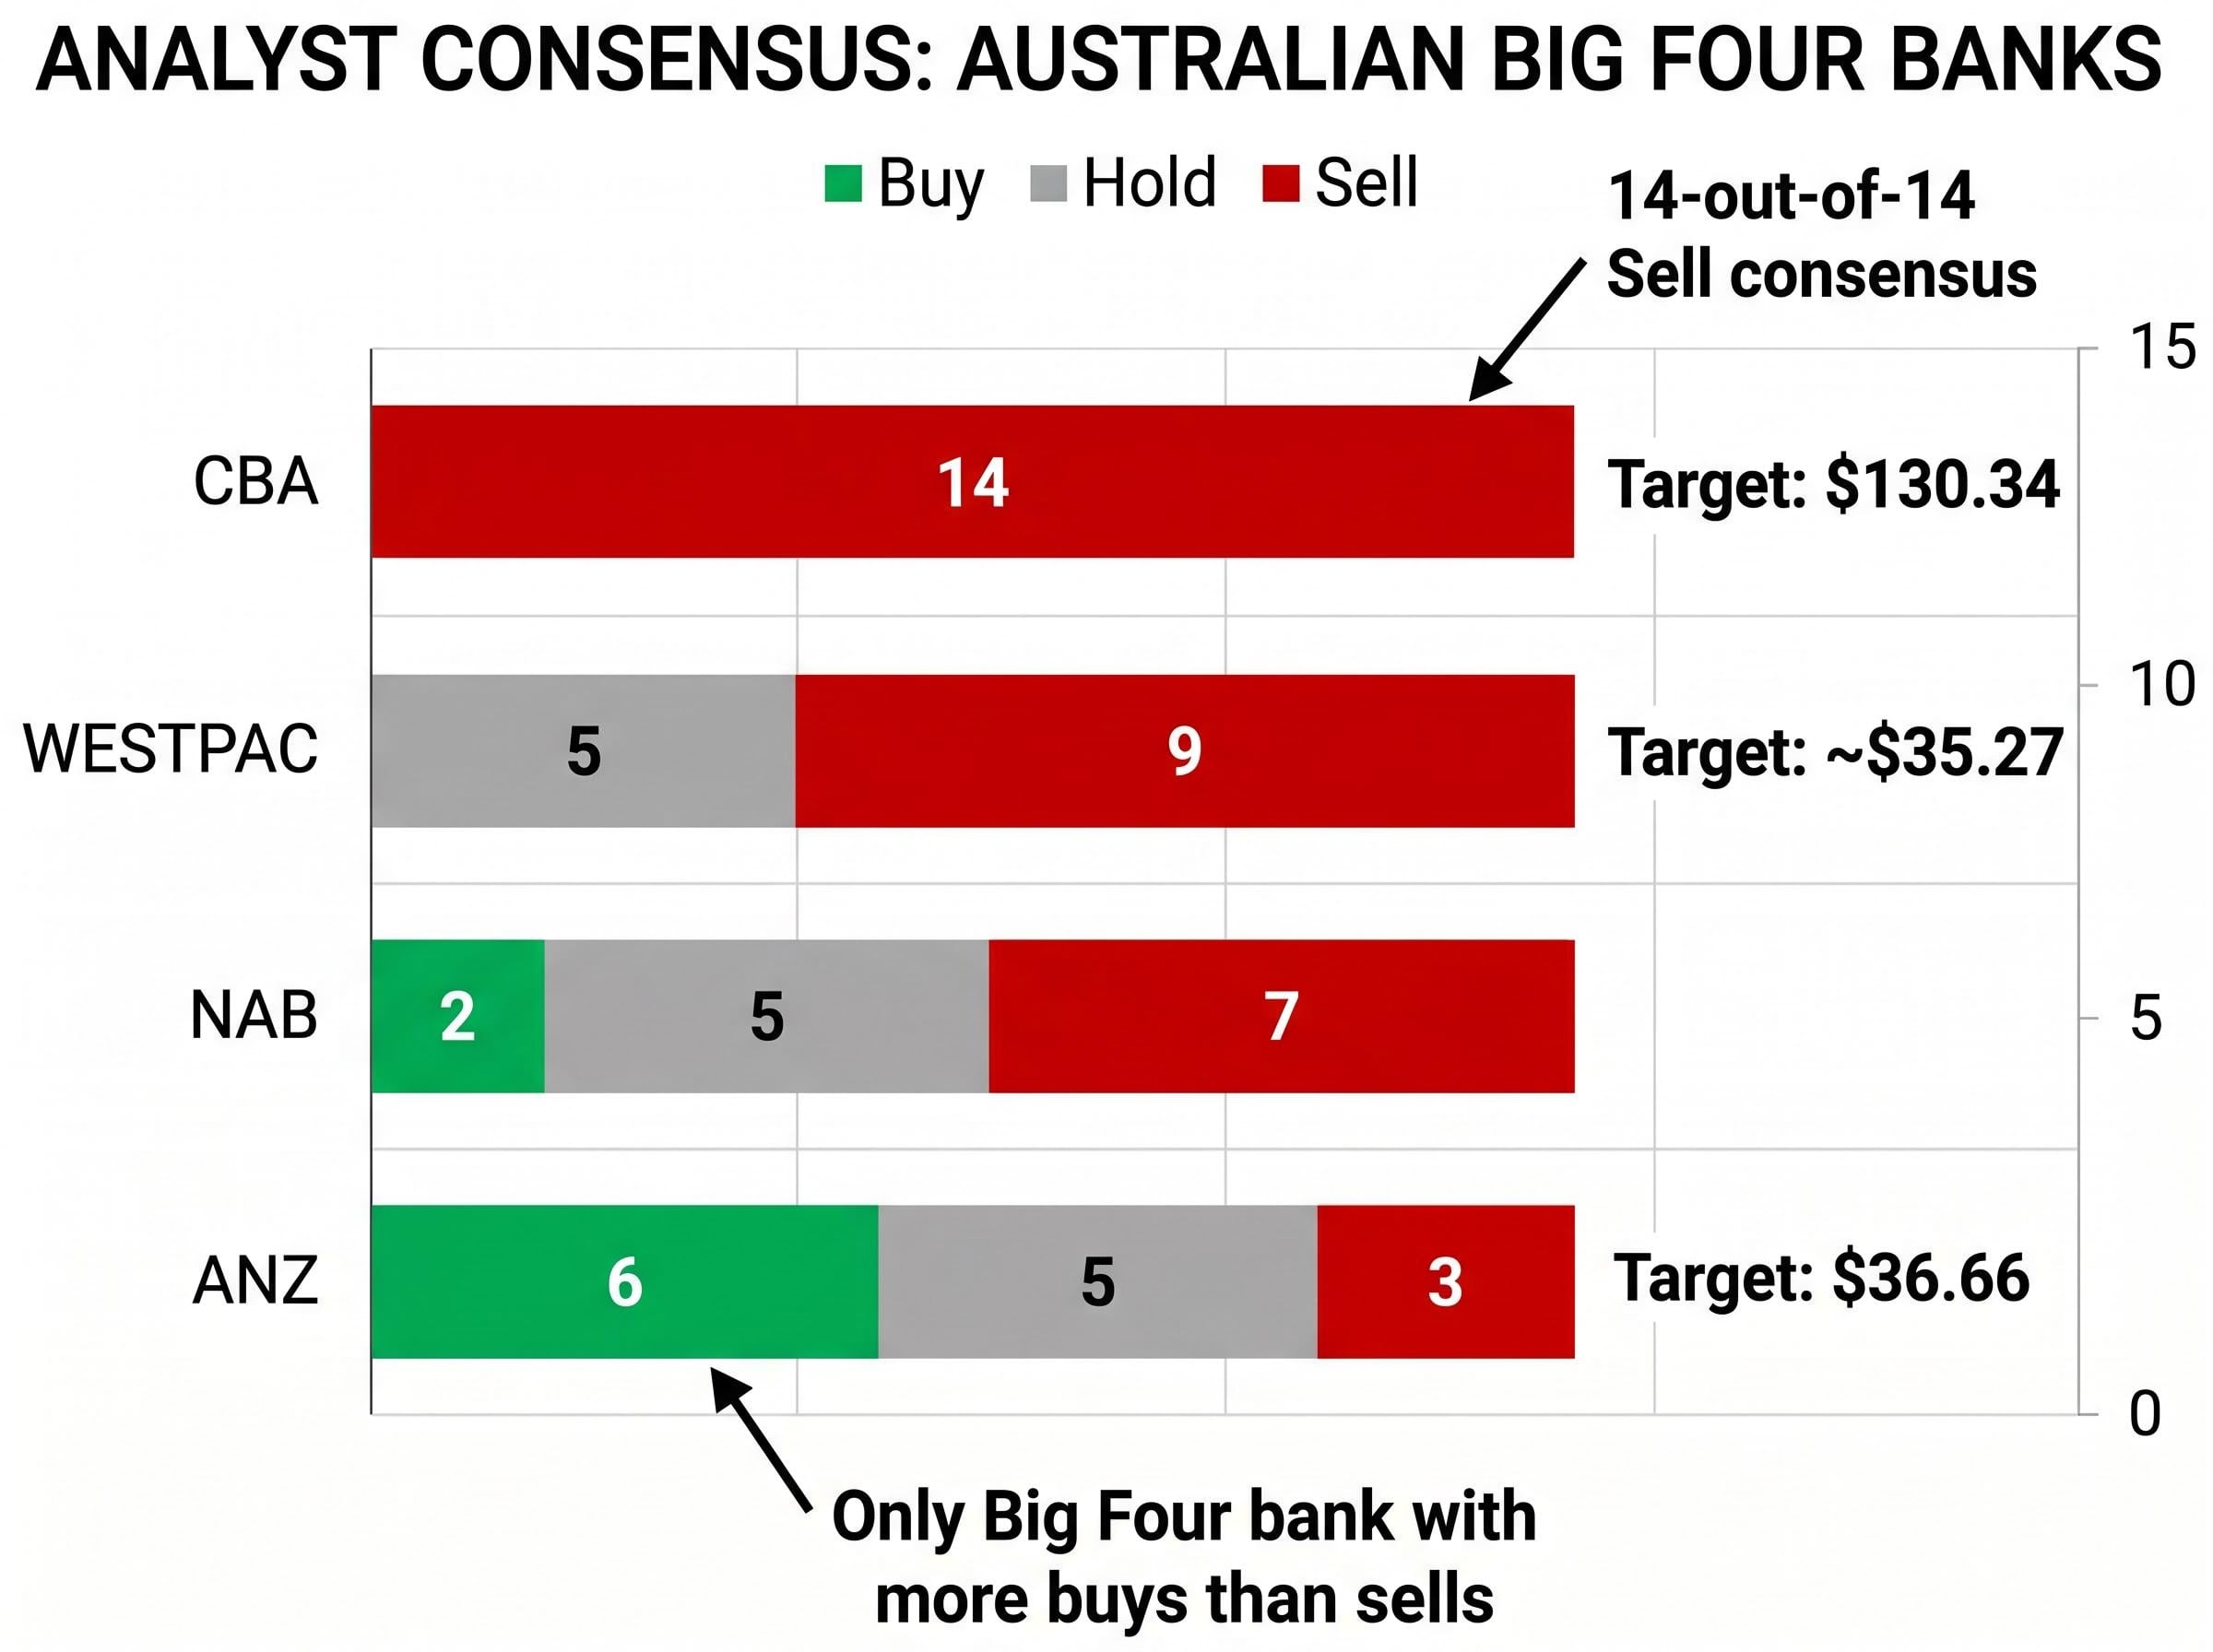
CBA carries the most striking consensus. Of 14 analysts covering the stock, zero rate it a buy and 14 rate it a sell, with an average price target of $130.34. Against CBA’s 27 April closing price of approximately $173.08, that target implies downside of roughly 25.5%. Some forecasts project falls toward $90, representing nearly 50% downside from current levels.
Of 14 analysts covering CBA, not one rates the stock a buy. The unanimous sell consensus is the most striking data point in the current Big Four analyst landscape.
Westpac draws a similar, if less extreme, picture: 0 buy ratings, 9 sell, 5 hold, and an average price target of approximately $35.27, implying roughly 9.6% downside from its late April price of approximately $39.01. NAB’s consensus skews sell as well, with 2 buy, 7 sell, and 5 hold ratings across 14 analysts, though a confirmed average price target was not available in current data.
Then there is ANZ. Its distribution reads 6 buy, 3 sell, 5 hold. It is the only Big Four bank where buy ratings outnumber sell ratings, and the only one where the analyst community is genuinely split rather than aligned on one side of the trade.
| Bank | Buy | Hold | Sell | Avg. Price Target |
|---|---|---|---|---|
| CBA | 0 | 0 | 14 | $130.34 |
| Westpac | 0 | 5 | 9 | ~$35.27 |
| NAB | 2 | 5 | 7 | N/A |
| ANZ | 6 | 5 | 3 | $36.66 |
These targets embed assumptions about rate cuts, earnings trajectories, and macroeconomic conditions that may or may not materialise. A 12-month price target is a modelled scenario, not a guarantee. Still, the breadth of bearish sentiment on CBA, from a full panel of coverage analysts, is not easily dismissed.
CBA’s valuation risk is not a consensus artefact produced by one or two outlier analysts; Morgans has set a price target of $124.26, approximately 28% below the current price, arguing that CBA’s competitive advantages are already fully embedded in a multiple that requires sustained earnings outperformance that current low single-digit EPS growth projections cannot deliver.
A bank stock rising in price is not the same as a bank stock becoming more attractive. CBA’s 12.4% year-to-date gain and its approximately 96% share price gain over five years have pushed its trailing price-to-earnings (P/E) ratio to approximately 28.10-28.65. That multiple sits well above the range typically associated with mature financial sector stocks.
A P/E ratio represents the number of years of current earnings an investor is paying for with today’s share price. A P/E of 28 means buyers are paying 28 years’ worth of current earnings for each share, a premium usually reserved for high-growth companies rather than regulated, dividend-paying banks. Mature financial sector stocks have historically traded in a range of roughly 12-18 times earnings. When a bank’s P/E stretches significantly beyond that range without a corresponding acceleration in earnings growth, the multiple itself becomes a risk factor.
Australia’s banking sector has long traded at P/E premiums relative to global peers. CBA’s current level, however, extends well past the sector’s own historical norms. With the ASX 200 Financials sector up 8.87% year to date, the temptation to chase price momentum is real, but momentum and valuation discipline pull in opposite directions at these levels.
Before buying any bank stock on the strength of its recent price performance, three questions are worth answering:
ANZ’s analyst profile is distinct. Six of 14 analysts rate it a buy, more than double the buy count for the other three banks combined.
ANZ is the only Big Four bank where buy ratings outnumber sell ratings, making it the clearest consensus outlier among Australia’s major banks.
Four factors underpin the relative optimism:
The average price target of $36.66, measured against ANZ’s 16 April closing price of $37.89, implies modest downside on a base case. The bullish scenario of $43 per share represents approximately 13% upside, a reasonable return but not a transformational one. For context, CBA’s bearish forecasts project up to 50% downside.
ANZ’s 4.5% year-to-date return trails CBA’s 12.4% but leads both Westpac and NAB. The case for ANZ is a relative one: for investors seeking to maintain bank sector exposure while reducing valuation risk, it offers the most balanced analyst profile among the four. Being the strongest name on a difficult street, however, is a relative positioning argument rather than an absolute conviction call. Any allocation decision should account for the 5 May RBA meeting as a near-term catalyst.
RBA rate decisions affect bank share prices through three direct channels. Higher rates tend to widen net interest margins (the gap between what banks earn on loans and pay on deposits), which supports short-term profitability. At the same time, elevated rates suppress loan demand and can deteriorate credit quality as borrowers face higher repayment costs, pressuring earnings further out.
The 5 May 2026 RBA meeting is the most immediate catalyst for re-rating any of the Big Four. Two scenarios frame the range of outcomes:
The March 2026 Australian inflation data tells a more complicated story than the headline figure alone: headline CPI surged to 4.6%, well above the RBA’s 2-3% target band, but trimmed mean CPI held at 3.3%, suggesting the acceleration reflects volatile energy prices rather than a broad deterioration in underlying price pressures.
Beyond the RBA, three broader variables will shape bank stock performance through the remainder of 2026:
This article is for informational purposes only and should not be considered financial advice. Investors should conduct their own research and consult with financial professionals before making investment decisions.
Past performance does not guarantee future results. Financial projections and analyst price targets are subject to market conditions and various risk factors.
The ASX 200 Financials sector’s 8.87% year-to-date gain tells one story. The underlying detail tells another. CBA’s 14-out-of-14 sell consensus and ANZ’s status as the only Big Four bank with more buy than sell ratings define the analytical contrast at the heart of this sector in late April 2026.
Sector-level exposure to Australian financials has rewarded investors this year. Stock-specific risk, however, is elevated and unevenly distributed. CBA’s five-year momentum has carried it to a valuation that the entire analyst community covering the stock considers unsustainable. ANZ offers the most balanced consensus profile, though even its bullish case implies modest upside.
For retail investors holding Big Four positions, the question is whether current allocations reflect a considered view of valuation risk or simply the inertia of long-held weightings. The 5 May RBA decision is the next material data point. How the board reads inflation, and what it signals about the rate path ahead, will determine whether the sector’s 2026 story remains one of resilient outperformance or begins to test the limits of what stretched valuations can sustain.
For retail investors who want to move beyond the bank sector question to the broader portfolio construction challenge, our dedicated guide to positioning an ASX portfolio during inflation covers how to allocate across cash ETFs, quality equity products, and fixed income instruments in a 4.10% rate environment, including the specific behavioural pitfalls that have historically locked in losses during tightening cycles.
—
The Big Four ASX bank shares are Commonwealth Bank of Australia (CBA), Westpac, NAB, and ANZ, which collectively account for roughly 25% of the S&P/ASX 200 by market capitalisation, meaning their performance significantly shapes the entire index.
All 14 analysts covering CBA rate it a sell, citing a price-to-earnings ratio of approximately 28 times earnings, well above the 12-18 range typical for mature banks, with an average price target of $130.34 implying around 25.5% downside from late April 2026 levels.
ANZ is the only Big Four bank where buy ratings outnumber sell ratings, with 6 buy, 5 hold, and 3 sell ratings among 14 analysts, making it the most balanced consensus profile in the group.
Higher RBA rates tend to widen bank net interest margins and support short-term profitability, but also suppress loan demand and can increase credit stress for borrowers; a rate cut would compress margins but could boost loan volumes and trigger a sector rally, particularly benefiting underperforming banks like NAB and Westpac.
Retail investors should assess each bank's current price-to-earnings ratio relative to its five-year average, whether the dividend yield remains competitive against the current 4.10% RBA cash rate, and whether consensus earnings per share estimates have actually risen or whether the share price has simply outrun static earnings.