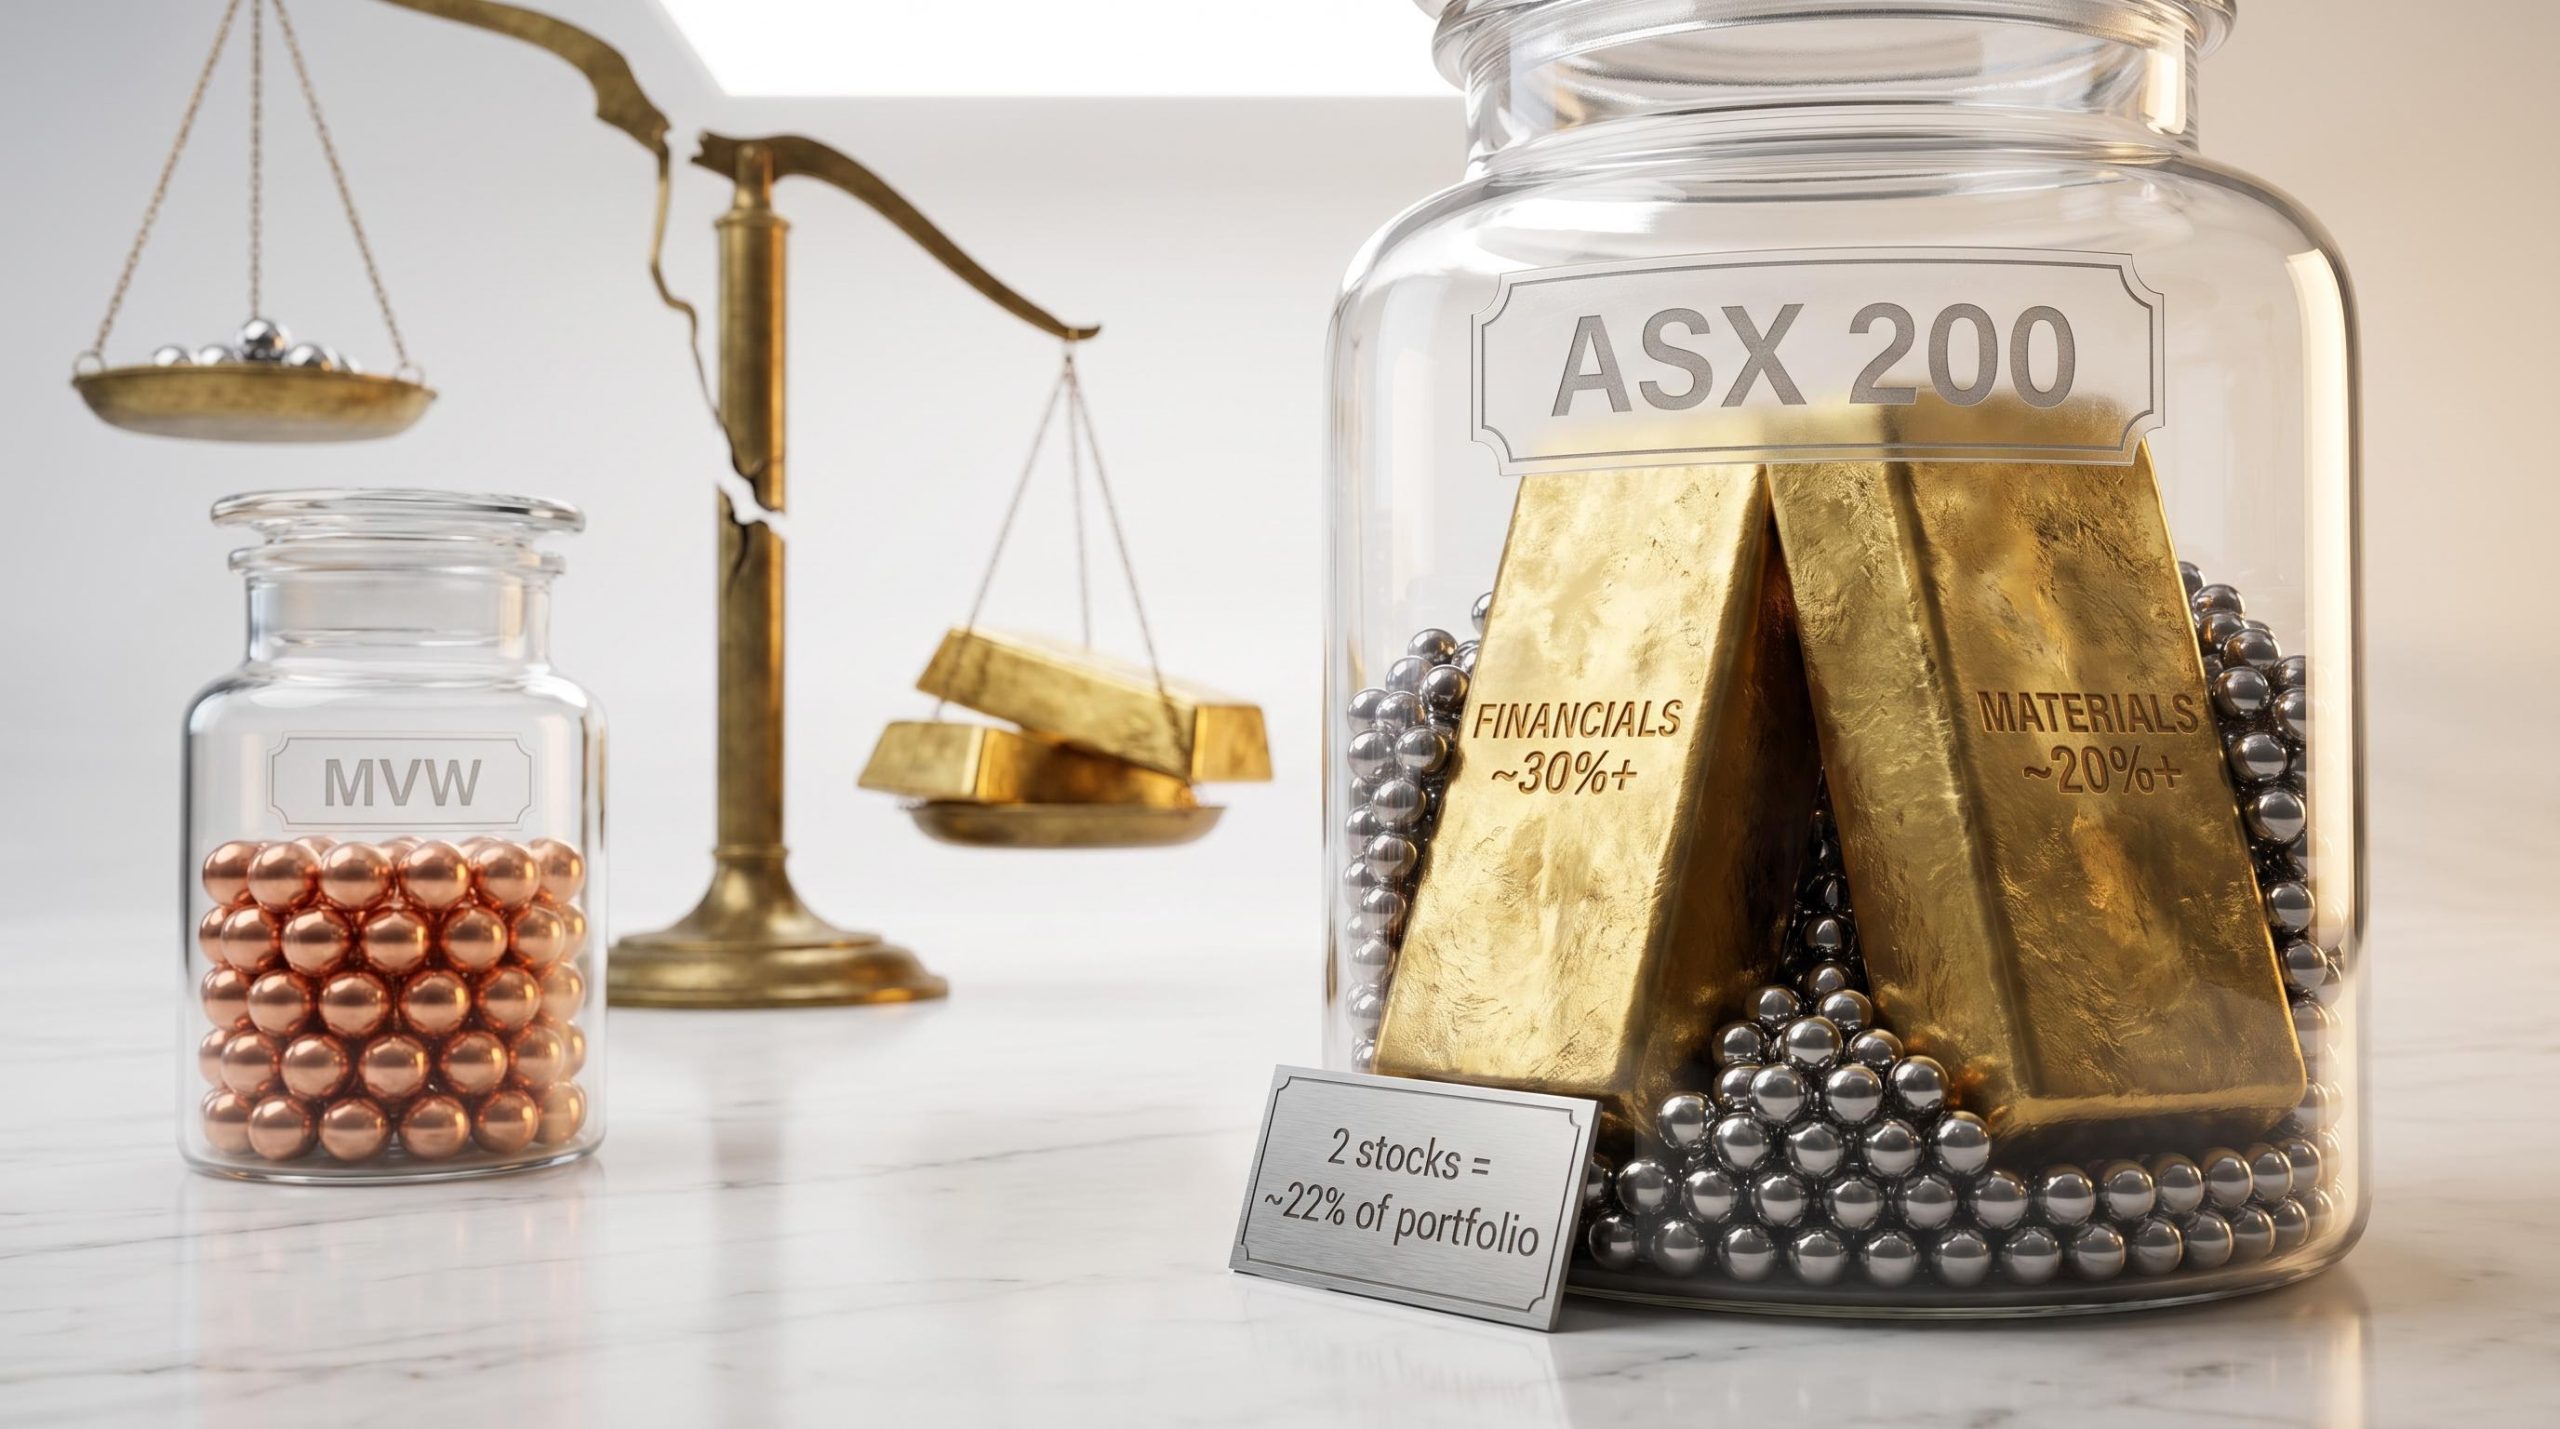
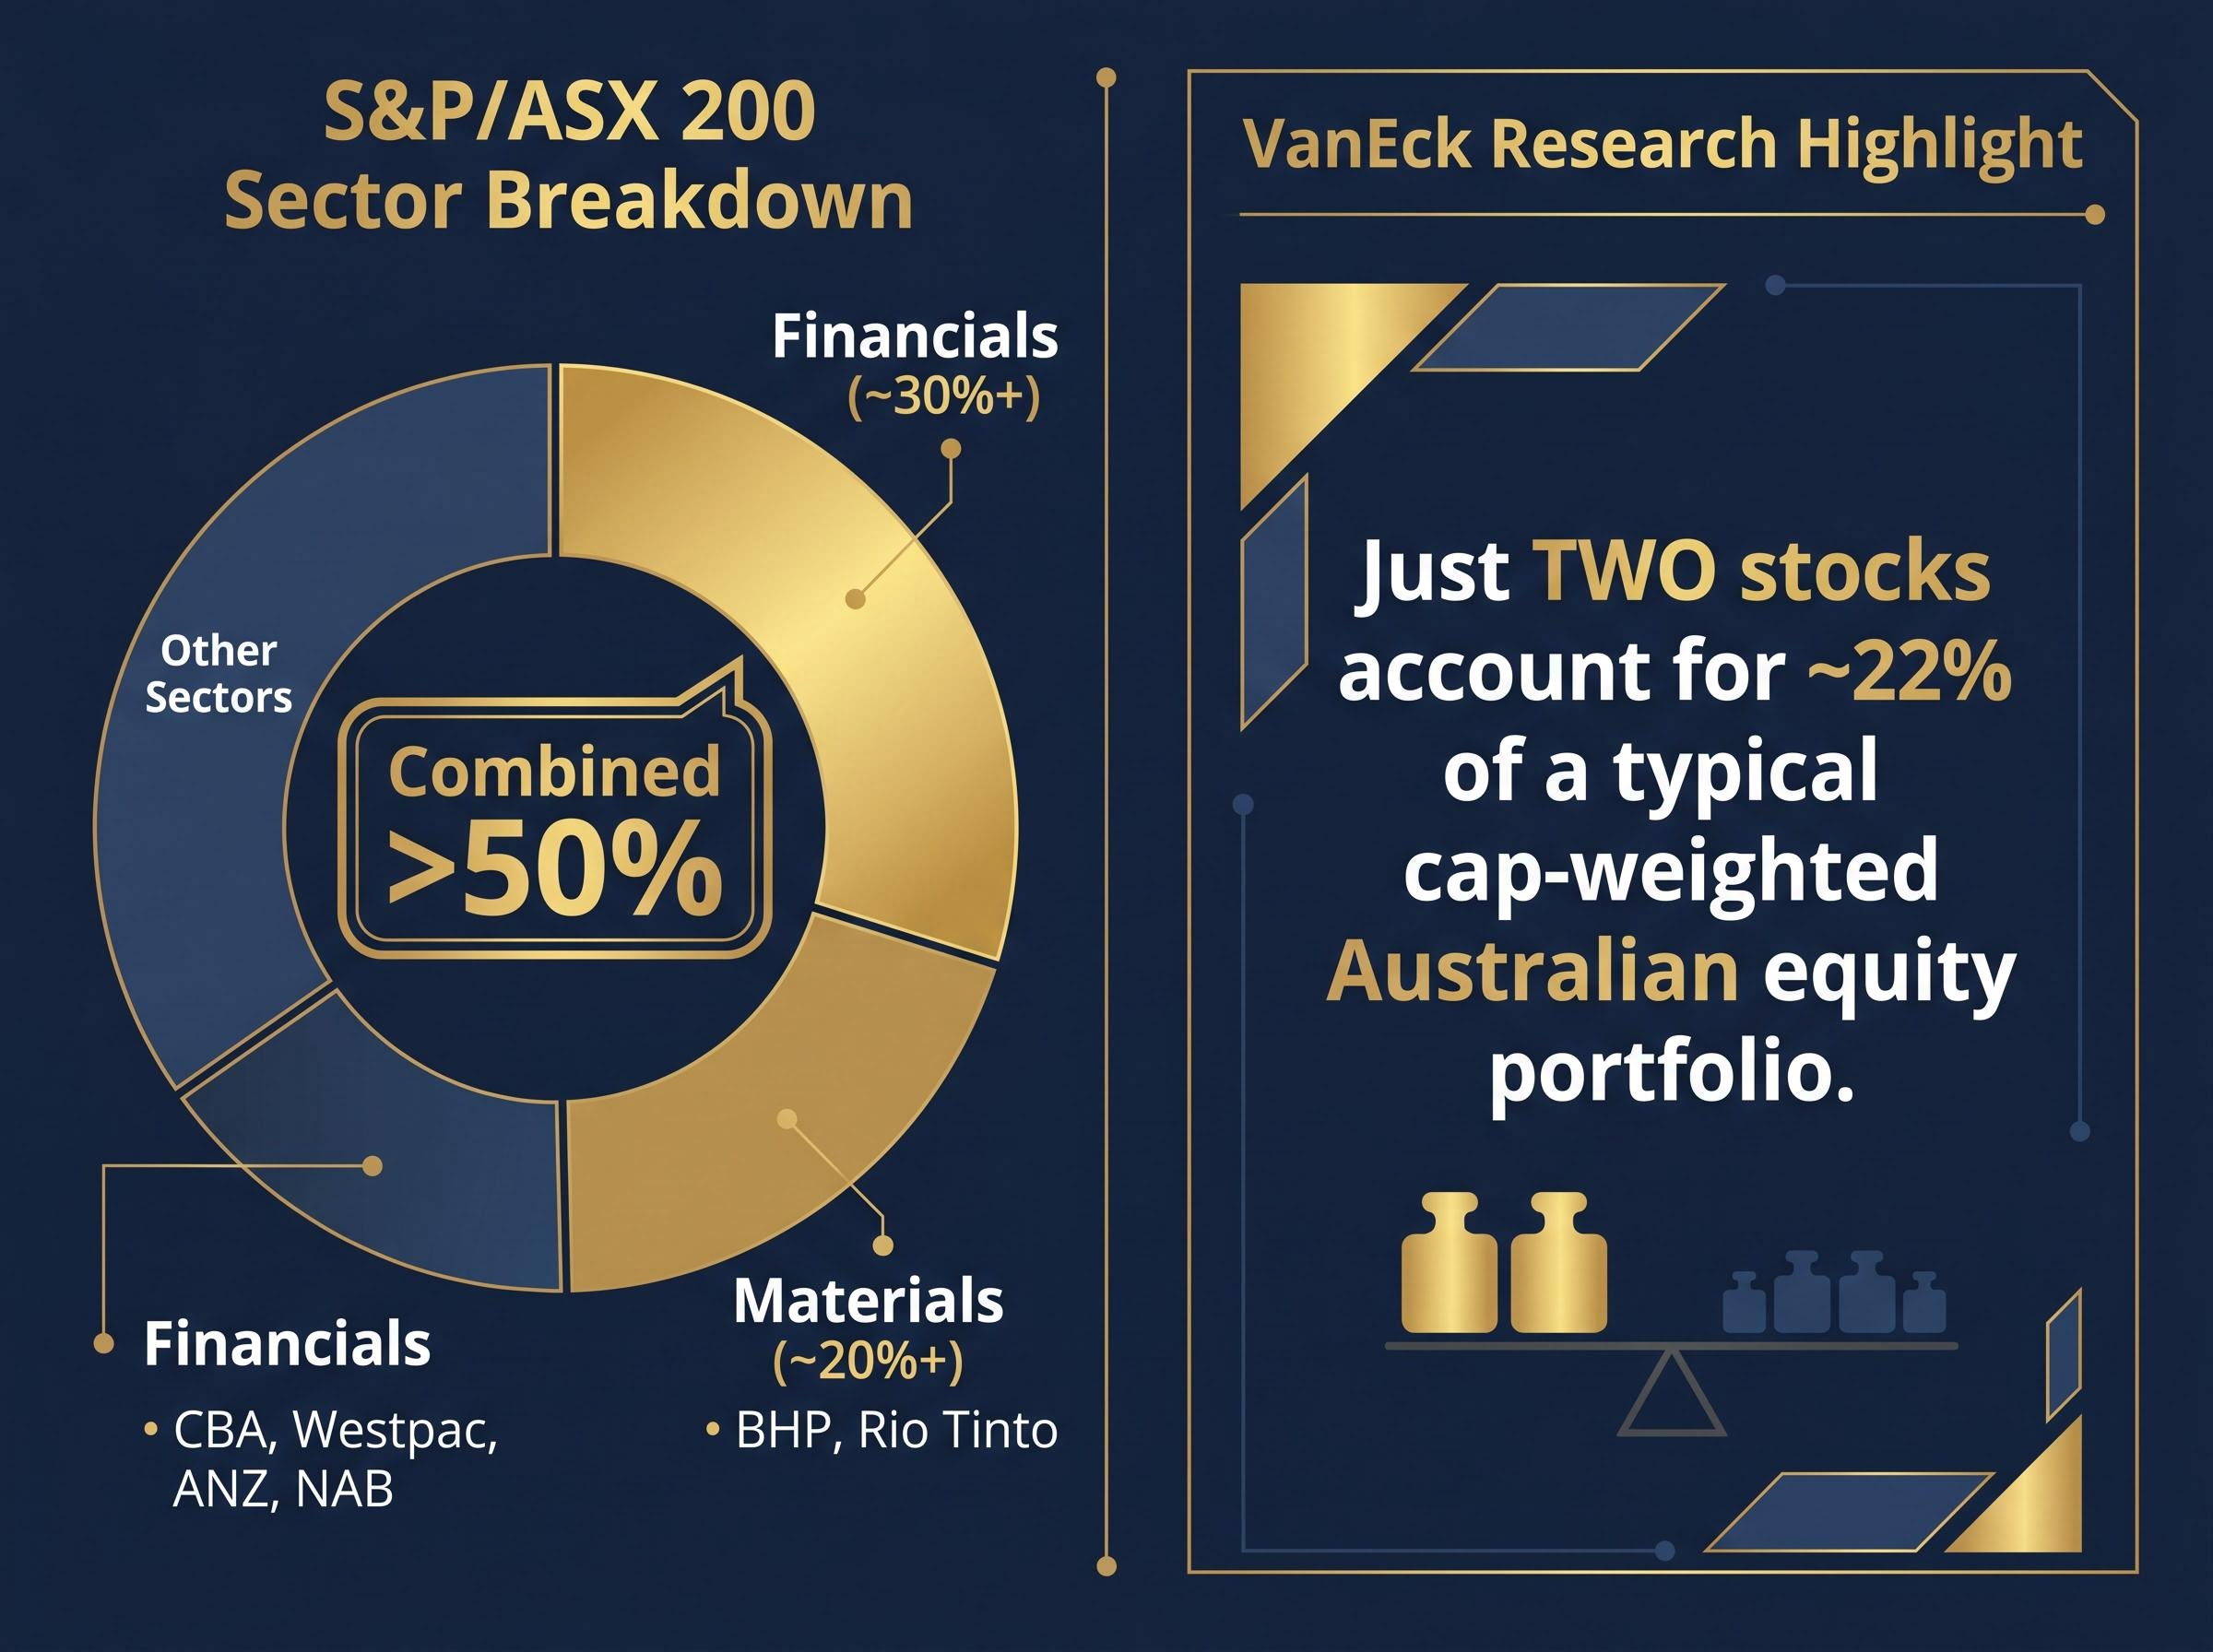
Most Australian retail investors who hold an ASX 200 ETF assume they own a balanced slice of 200 companies spread across the economy. The reality is structurally different. Two sectors, financials and materials, account for more than half the S&P/ASX 200 by market-capitalisation weight. Research from VanEck has found that two stocks alone have historically comprised roughly 22% of a typical cap-weighted Australian equity portfolio.
The S&P/ASX 200 is Australia’s benchmark equity index and the foundation of products that millions of retail investors treat as a default “set and forget” allocation. Those products are marketed on diversification, low cost, and simplicity. None of those claims are false, but none of them address the concentration embedded in the index’s design. In May 2026, a post-budget decline of more than 10% in Commonwealth Bank shares demonstrated how a single large-cap stock can visibly drag the entire index lower, turning a company-specific event into a portfolio-wide outcome.
This article explains how the ASX 200 is actually constructed, why that construction creates hidden concentration risk, what it means in practice when one of the biggest stocks moves sharply, and what options exist for investors who want diversification beyond the index’s top tier.
The index that feels diversified but is not
The logic sounds reasonable. Buy an ETF that tracks 200 of Australia’s largest listed companies, and the portfolio should be spread across the economy. For many retail investors, that reasoning is where the analysis stops. The number 200 does the persuading on its own.
What “market-cap weighted” actually means in practice
The S&P/ASX 200 is a free-float market-capitalisation weighted index. That means each company’s weight is proportional to its total market value (adjusted for shares available for public trading). The bigger the company, the more of each ETF dollar flows to it.
This is not a flaw. It is a designed structural feature, documented in the S&P Dow Jones Indices Australian Indices Methodology. Understanding it matters precisely because it is intentional.
The consequence is measurable:
- Financials and materials together represent more than 50% of the S&P/ASX 200 by market-cap weight.
- Two stocks alone have accounted for roughly 22% of a typical cap-weighted Australian equity portfolio, according to VanEck research.
So while the ETF holds 200 names, the weight distribution means roughly half of an investor’s exposure sits in two sectors, and nearly a quarter can sit in just two companies. The number on the label does not describe what is inside the box.
When big ASX news breaks, our subscribers know first
How index construction puts banks and miners in the driving seat
The concentration does not happen by accident. It follows directly from how the index selects and weights its constituents.
The S&P/ASX 200 uses free-float market-capitalisation weighting with liquidity and float screens. “Free-float” means only shares available for public trading are counted; shares held by founders, governments, or strategic investors are excluded. The resulting float-adjusted market capitalisation determines each stock’s index weight.
ASX 200 index inclusion operates under separate rules from the listing process itself, administered by S&P Dow Jones Indices rather than the ASX, with a float-adjusted market capitalisation threshold and a quarterly rebalance cycle that directly determines which companies enter the index and at what weight.
In Australia, the companies that pass these screens with the highest weights are the big four banks (Commonwealth Bank, Westpac, ANZ, NAB) and the major miners (BHP, Rio Tinto). These companies are both large and liquid, which means they consistently occupy the top of the index. Their dominance is self-reinforcing: as their share prices rise, their market caps grow, and their index weights increase further.
| Sector | Representative Companies | Approx. Index Weight | Why They Dominate |
|---|---|---|---|
| Financials | CBA, Westpac, ANZ, NAB | ~30%+ | Largest market caps; high free-float; deep liquidity |
| Materials | BHP, Rio Tinto | ~20%+ | Global-scale miners with high market caps and trading volumes |
| Combined | >50% | Two sectors drive more than half the index |
Why the methodology has not changed despite concentration concerns
As of 2026, no ASIC, APRA, or ASX rule has introduced concentration caps or equal-weight requirements on the S&P/ASX 200. The S&P Dow Jones methodology was unchanged in 2025-2026 regarding its weighting approach.
That means managing concentration risk remains entirely the investor’s responsibility. The index will not do it for them.
What happens to your portfolio when one mega-cap stumbles
The mechanics outlined above become visceral when a single large-cap stock falls sharply. May 2026 provided a live case study.
Following Australia’s budget announcement, Commonwealth Bank, the country’s second-largest company by market capitalisation, declined by more than 10%. For investors holding a standard ASX 200 ETF, the impact was not confined to one line item in a portfolio of 200. It rippled through the entire index.
CBA’s post-budget decline exceeded 10%, and at the stock’s typical index weight, a fall of that magnitude translates to roughly a 2%+ drag on the entire ASX 200, from a single holding.
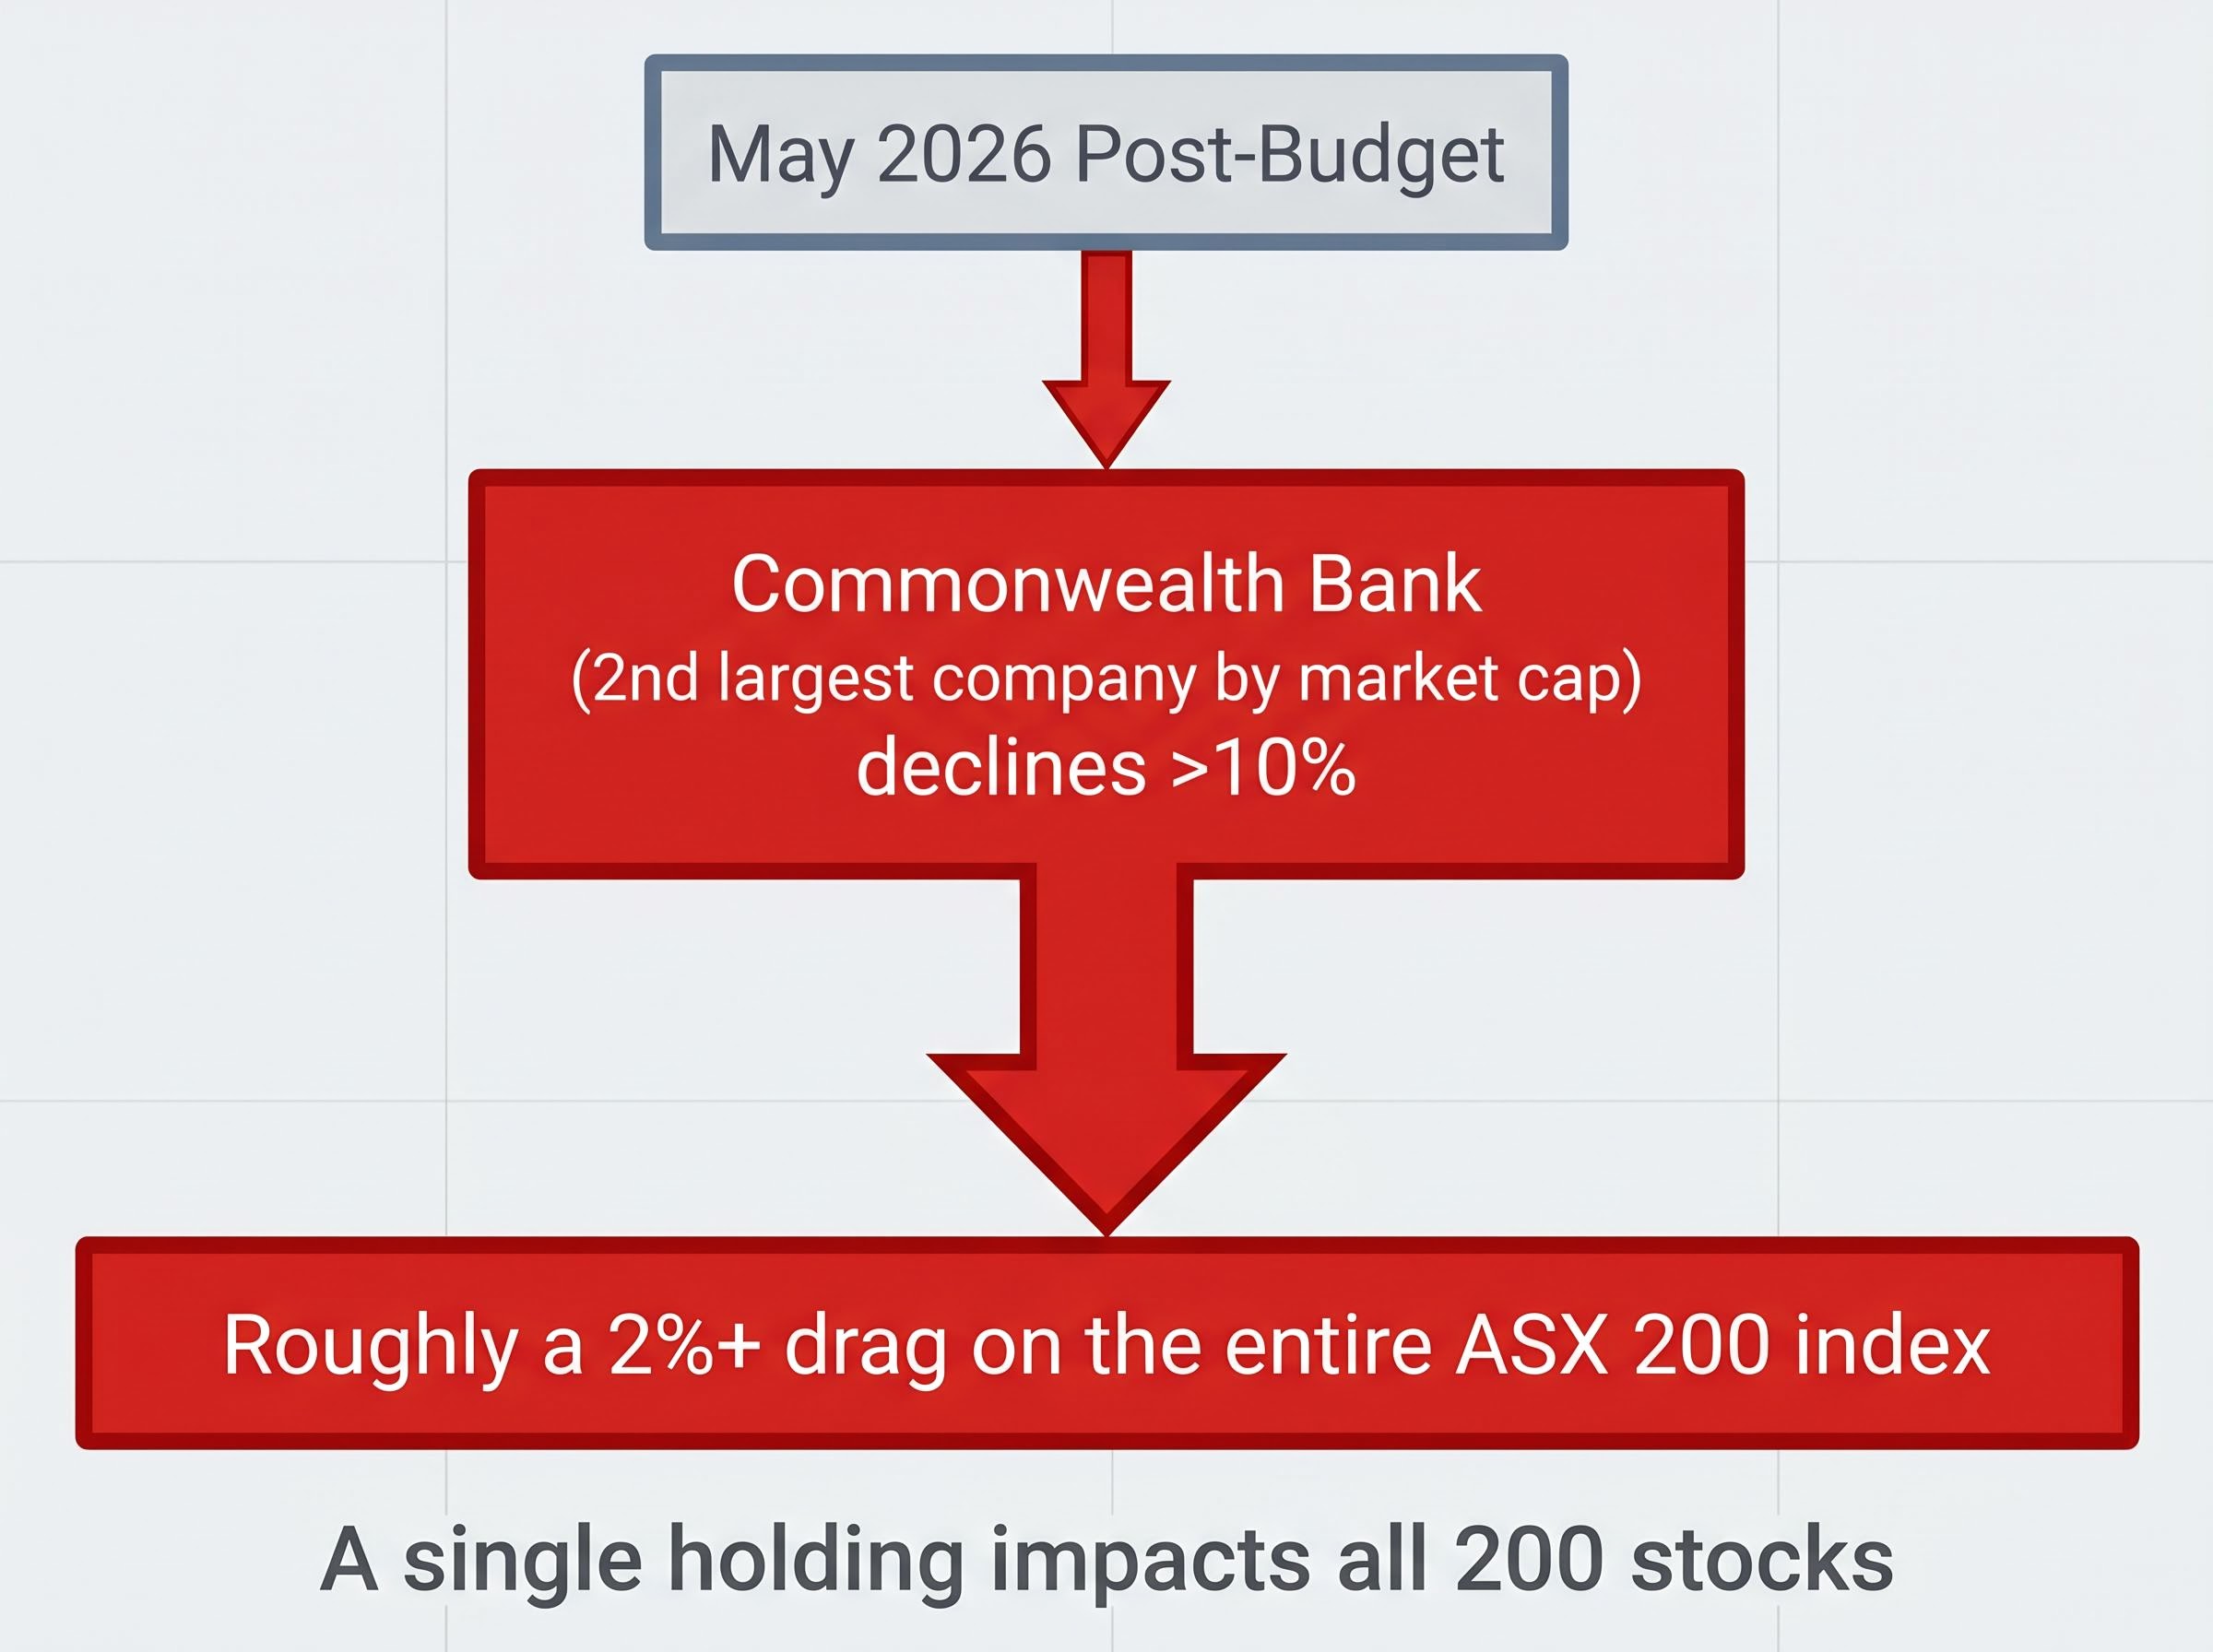
That arithmetic follows directly from the concentration figures. If two stocks account for approximately 22% of a cap-weighted Australian equity portfolio, a 10% fall in one of them produces a meaningful index-level loss, regardless of what the other 198 constituents do that day.
The same dynamic could recur through different triggers:
The ASX banks vs miners sector rotation playing out in May 2026 illustrates exactly why static cap-weighted exposure creates unintended consequences: as BHP overtook CBA as Australia’s largest listed company by market cap, passive portfolios benchmarked to the ASX 200 automatically increased their materials exposure and reduced their financials exposure without any investor decision.
- A major miner hit by a sharp commodity price decline
- A bank facing unexpected regulatory capital requirements
- A large-cap stock issuing a profit warning that resets its valuation
In each scenario, the cap-weighted structure ensures the impact is amplified rather than absorbed. A genuinely diversified portfolio would distribute such a shock across many roughly equal positions. The ASX 200 does not.
Why most investors do not know this, and why it matters
The information gap here is not the result of investor carelessness. It reflects the way ASX 200 ETFs are presented to the retail market.
ETF marketing emphasises cost efficiency, simplicity, and broad market exposure. All three claims are accurate. But none of them address what is happening inside the index at the weighting level.
The ASX Australian Investor Study 2023, the most recent broad survey of Australian investor behaviour, documents strong ETF adoption and a general desire for portfolio diversification. It does not, however, test whether investors understand how cap-weighting works or that the ASX 200 concentrates more than 50% of its weight in two sectors.
The gap between ETF marketing and index mechanics
The word “diversified” in an ASX 200 ETF prospectus refers to holding 200 stocks. It does not refer to balanced sector or stock-weight distribution. These are different things, and the distinction is rarely made explicit in the materials retail investors encounter.
The BetaShares Australian ETF Review (September 2025) noted continued heavy allocation to broad-market ASX 200 ETFs alongside growing interest in alternative-weight products. Money Management (March 2025) reported proliferation of equal-weight and factor ETFs across the Australian market. Both observations suggest the industry recognises concentration as a concern, even as most retail capital continues flowing into cap-weighted products.
The absence of publicly available survey data specifically measuring investor understanding of ASX 200 concentration is itself a signal. This is a well-documented structural feature that has not translated into mainstream investor awareness.
What genuine diversification away from the top tier looks like
Three product categories have emerged as direct responses to ASX 200 concentration. Each addresses a different dimension of the problem.
Equal-weight indexing (MVW): The VanEck Australian Equal Weight ETF tracks the S&P/ASX 200 Equal Weight Index. Rather than weighting by market cap, it gives each constituent the same starting weight and rebalances quarterly. MVW holds 76 equally weighted stocks; at the most recent rebalance, no individual holding exceeded 1.3% of the portfolio, according to VanEck. This is the most direct structural counter to single-stock concentration.
The cap-weight vs equal-weight ETF decision shapes real portfolio exposure in ways the fund label does not reveal: MVW lagged cap-weighted peers by approximately 2 percentage points per year in both 2024 and 2025, yet historical data shows equal-weight outperformed significantly in the five years following the 2013 concentration peak.
Fundamental indexing (QOZ): The BetaShares FTSE RAFI Australia 200 ETF weights companies by economic size metrics: sales, cash flow, dividends, and book value. By anchoring weights to business fundamentals rather than market valuation, QOZ reduces the distortion that inflated share prices create in a cap-weighted index.
Ex-top-20 exposure (EX20): The BetaShares Australian Ex-20 Portfolio Diversifier ETF tracks an index of the 180 largest ASX-listed stocks after removing the 20 biggest by market cap. This is a deliberate exclusion strategy for investors whose existing portfolios already carry heavy bank and miner exposure through superannuation or direct holdings.
| ETF Ticker | Weighting Methodology | Holdings | Max Single-Stock Weight | Concentration Problem Addressed |
|---|---|---|---|---|
| MVW | Equal weight, quarterly rebalance | 76 | ~1.3% | Single-stock and sector dominance |
| QOZ | Fundamental (sales, cash flow, dividends, book value) | ~200 | Varies by fundamental metrics | Valuation-driven weight inflation |
| EX20 | Cap-weighted, ex-top-20 | ~180 | Reduced (top 20 excluded) | Overlapping mega-cap exposure |
The right choice depends on the investor’s existing portfolio:
- Already heavy in banks and miners (through super or direct shares): EX20 avoids doubling up on the same mega-cap names.
- Starting fresh with Australian equities: MVW provides the most balanced single-product exposure across the index.
- Wanting a global diversification complement: QOZ pairs well with international ETFs by anchoring Australian exposure to business fundamentals rather than market sentiment.
Concentration risk is structural, not cyclical: what to do now
ASX 200 concentration is not a temporary market anomaly that will self-correct. It is a designed feature of market-cap weighting. The financials and materials sectors exceed 50% of the index because the biggest Australian companies happen to be banks and miners, and the methodology weights by size. That will not change unless the methodology changes, and no such change is pending.
The product landscape has responded. The BetaShares Australian ETF Review (September 2025) documented the growth of alternative-weight ETFs specifically aimed at investors seeking to manage top-end concentration. The tools now exist. Using them starts with a portfolio review.
- Check superannuation fund holdings. Many default super options hold ASX 200 exposure. If a personal ETF portfolio also tracks the ASX 200, the overlap doubles the concentration.
- Calculate sector exposure percentage. What proportion of total equity holdings sits in Australian financials and materials? If the answer is not known, the exposure is almost certainly unexamined.
- Research alternative-weight ETF options. MVW, QOZ, and EX20 each address a different aspect of concentration. The right fit depends on existing holdings and investment objectives.
- Consider a financial adviser conversation for complex situations involving multiple accounts, superannuation, and overlapping exposures.
For investors who have identified the concentration problem and want a structured approach to rebuilding their allocation, our comprehensive walkthrough of ETF portfolio construction for Australian investors covers asset allocation frameworks, the interaction between superannuation default options and personal ETF holdings, and how to size positions in MVW, QOZ, or EX20 relative to existing exposures.
The question worth answering is specific: what percentage of total equity exposure is in Australian financials and materials, and is that level of sector concentration intentional? If the answer is “I don’t know,” the concentration is the default, not the decision.
This article is for informational purposes only and should not be considered financial advice. Investors should conduct their own research and consult with financial professionals before making investment decisions.