How to Choose Between VAS and A200 for Your Portfolio
3 hrs ago

The top 10 stocks in the S&P/ASX 200 account for roughly half the entire index. This means a standard Australian exchange-traded fund can quietly concentrate half your money in a handful of banks and miners before you make a single active choice.
Investors now have more than 350 exchange-traded products to choose from, with combined assets approaching $190 billion on the ASX.
The ASX Investment Products Monthly Report is the primary official source for tracking total assets under management, fund flows, and product counts across the Australian ETF market, providing the market-level data that underpins any assessment of how the industry is growing.
The abundance of choice creates a new problem. People spend enormous energy selecting individual funds while paying far less attention to the decisions that actually drive long-term outcomes.
The true drivers of portfolio performance are how money is split across asset classes and how the underlying index weighting works.
This guide explains how asset allocation and weighting structures work for an ETF portfolio in Australia. It covers why these mechanics matter more than fund selection and how to build a straightforward, resilient investment strategy.
Investors often fixate on picking the most popular fund, but the proportional split between asset classes does the heavy lifting. The allocation between growth assets, like equities, and defensive assets, like bonds, determines the majority of long-term returns.
Setting this split requires matching your target exposure to your specific goals and time horizon, rather than reacting to short-term market conditions.
For example, according to financial calculations, accumulating $1 million outside superannuation with a $1,500 monthly contribution requires an annualised return of approximately 7.1%.
According to Morningstar, both Australian and international equities could deliver returns annually over the next 20 years.
To capture this kind of return, an aggressive multi-asset strategy might run approximately 90% growth assets and 10% defensive assets. Within the growth sleeve, this typically breaks down to roughly 60% international shares and 30% Australian shares.
According to Morningstar, the asset allocation strategy is considered more important than the specific products chosen.
There are three practical approaches an investor can use to set their allocation: Buying a single multi-asset fund that handles the proportional split internally. Mirroring the strategic allocations published by professional multi-asset managers. * Using capital market assumption models provided by major issuers like Vanguard and BlackRock.
Understanding this reorients the entire decision-making process. The focus shifts from hunting for the perfect individual stock or fund to maintaining a disciplined asset class split.
Market-capitalisation weighting assigns larger companies proportionally larger allocations. The index weights constituents by their total market size rather than giving each company an equal share.
On the ASX, this creates highly skewed portfolios where a small number of massive corporations dominate the returns.
The practical implications of cap-weight vs equal-weight are starker than the methodology labels suggest: as of May 2026, the top 10 ASX 200 constituents hold 48.6% of a cap-weighted domestic ETF, meaning a default broad-market purchase concentrates nearly half of local equity exposure in banks and miners before any active decision is made.
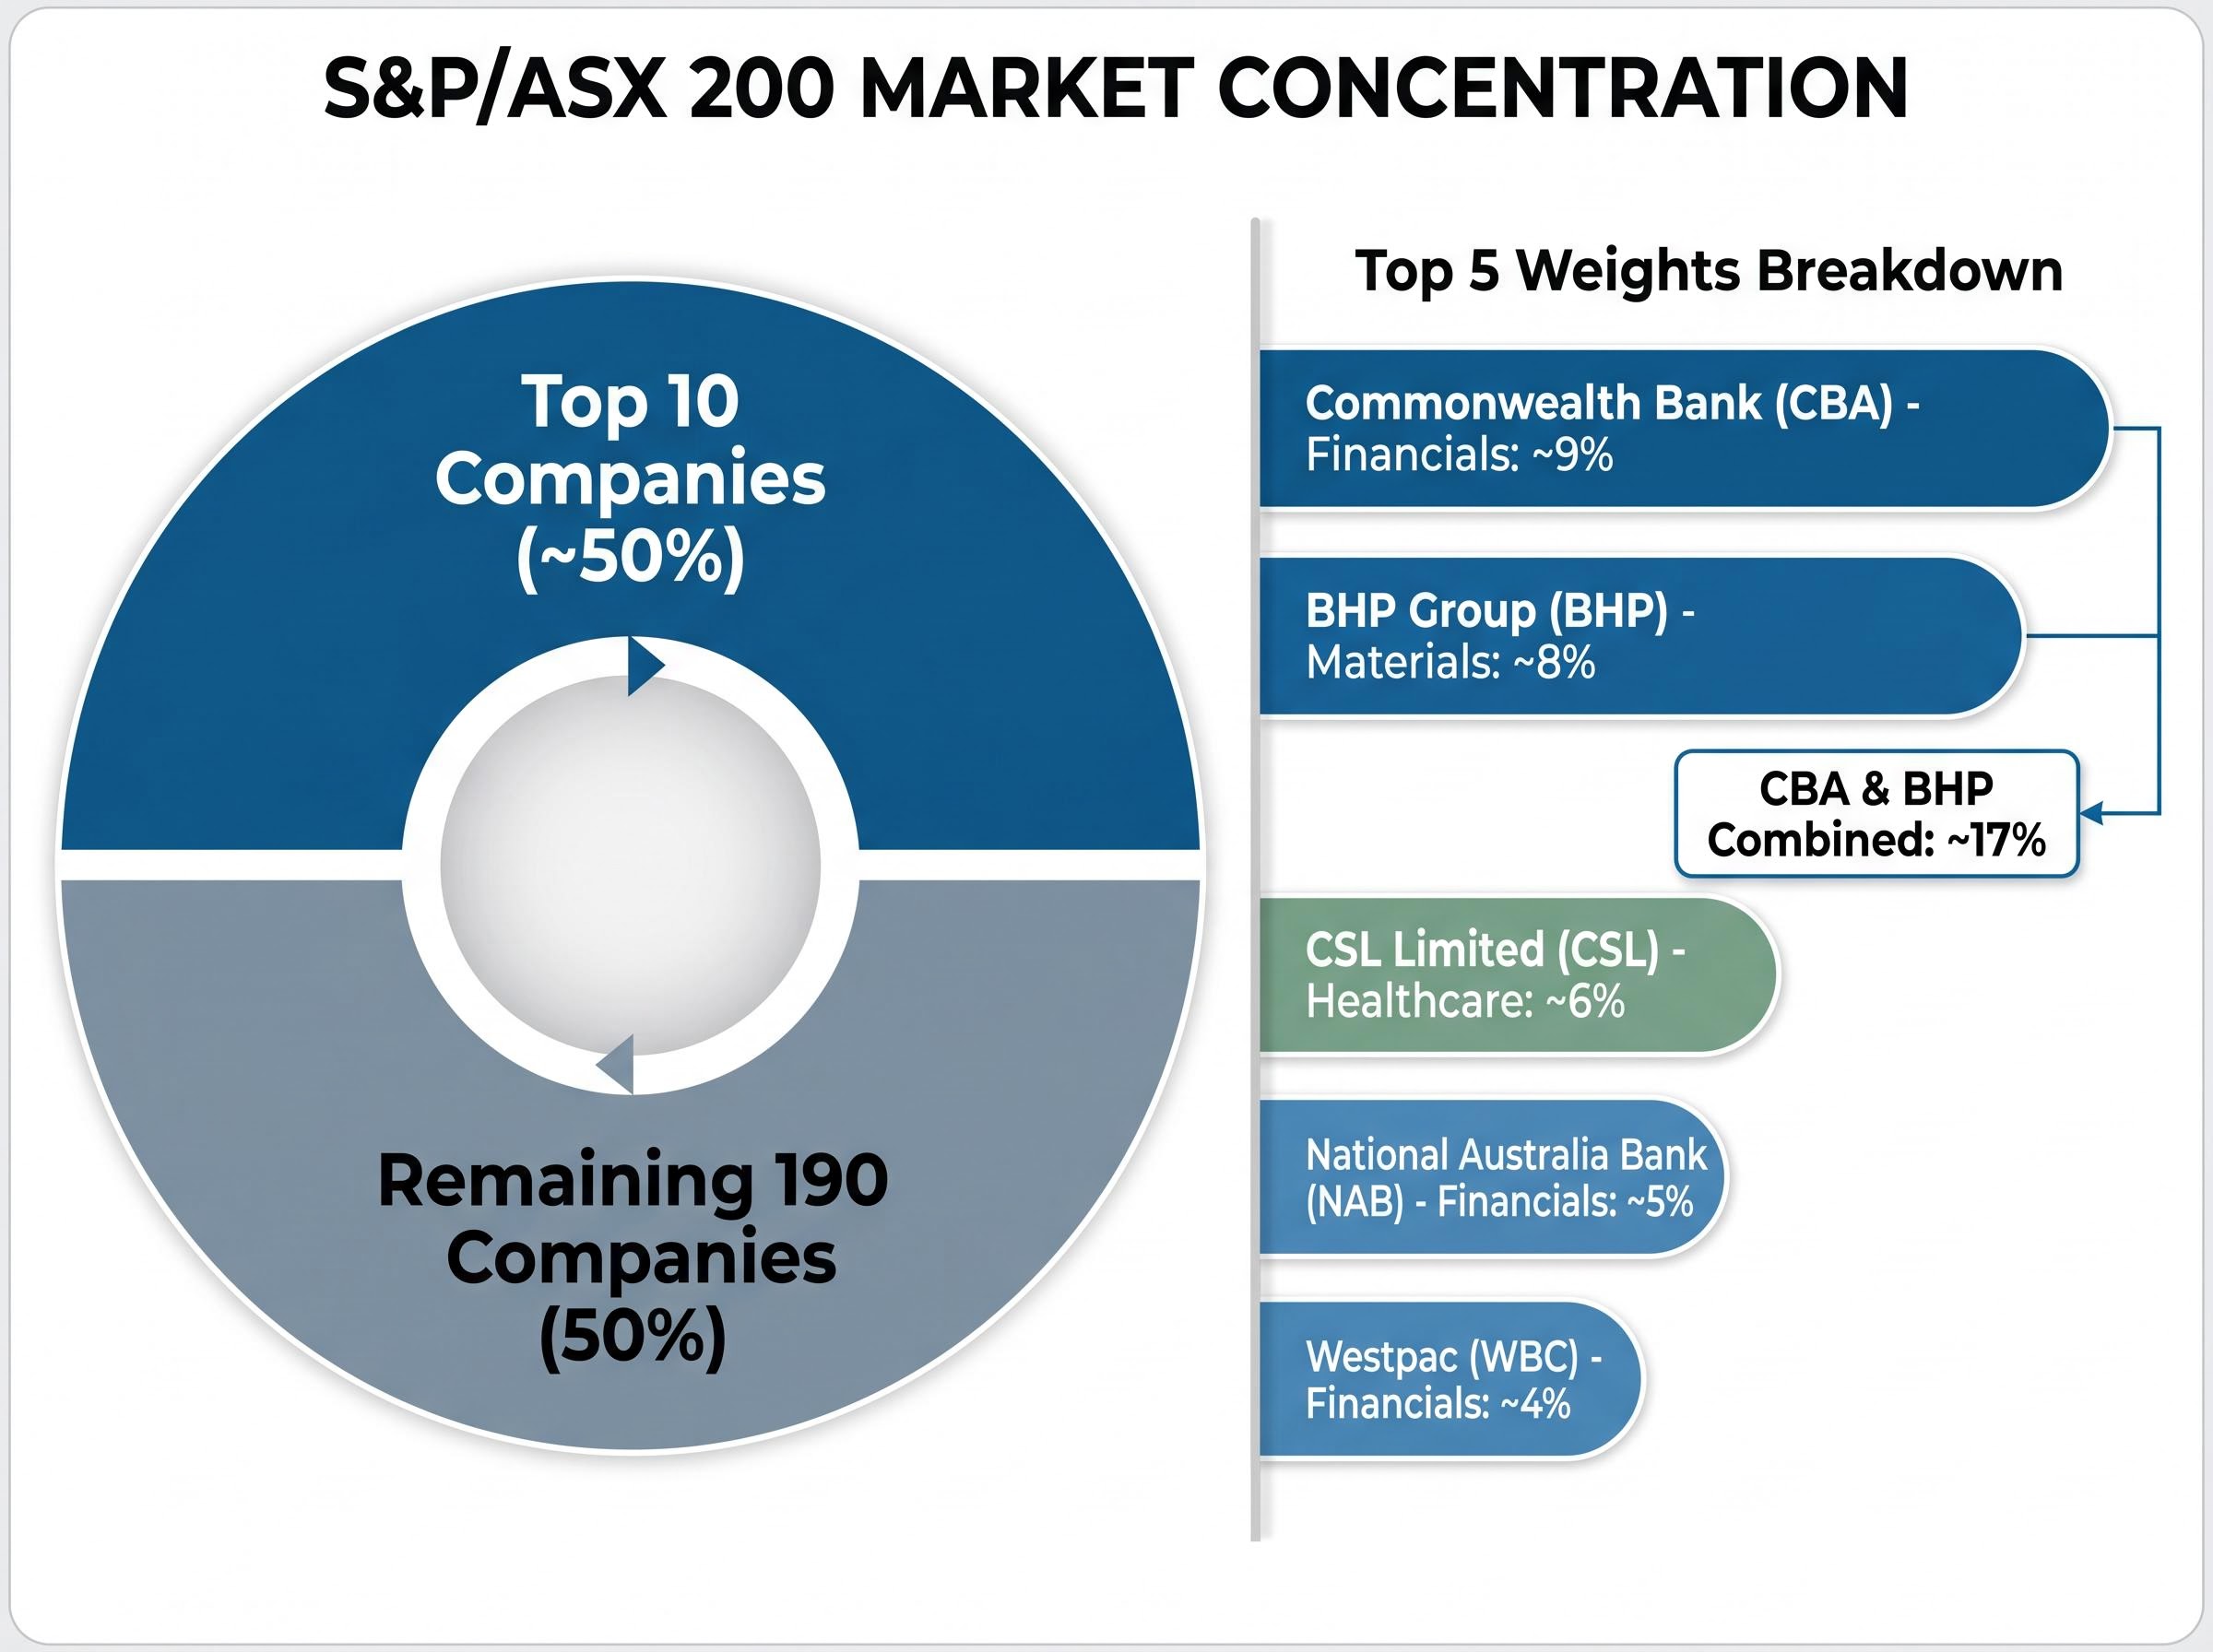
According to market data, Commonwealth Bank of Australia (CBA) and BHP together represent approximately 17% of the S&P/ASX 200. The top 10 companies collectively account for close to 50% of the total index weight.
The remaining 190 companies make up the other half. Regular top-10 constituents consistently include CBA, BHP, CSL, National Australia Bank (NAB), ANZ, Westpac (WBC), Wesfarmers (WES), Woolworths (WOW), and Macquarie Group (MQG).
| Company | Sector | Approximate Index Weight |
|---|---|---|
| Commonwealth Bank (CBA) | Financials | According to market data, ~9% |
| BHP Group (BHP) | Materials | ~8% |
| CSL Limited (CSL) | Healthcare | ~6% |
| National Australia Bank (NAB) | Financials | ~5% |
| Westpac (WBC) | Financials | ~4% |
Owning broad market funds means accepting this heavy allocation to financials and materials. The Vanguard Australian Shares Index ETF (VAS) tracks the S&P/ASX 300, while the BetaShares Australia 200 ETF (A200) tracks the Solactive Australia 200 Index with a management fee of 0.04%.
Despite tracking slightly different indexes, both deliver heavy sector exposure due to their shared cap-weighted structure.
Because market-capitalisation index trackers automatically allocate more capital to companies whose share prices have risen, they inherently buy more of what has already gone up. This creates a momentum effect where large successful companies become an ever-larger portion of the portfolio.
This concentration is a structural feature of the Australian market, not a recent anomaly. A significant portion of every dollar invested in these funds becomes highly sensitive to the performance of local banks and miners.
Investors concerned by this structural tilt have an alternative in equal-weighted structures. Equal-weighted funds assign an identical portfolio weight to every constituent company, regardless of its market size.
This means a smaller mid-cap company receives the exact same allocation slice as CBA or BHP.
The equal-weight methodology requires periodic rebalancing to maintain identical proportions. The fund manager must routinely sell portions of the companies that have grown and redirect that capital into the companies that have shrunk.
This acts as a systematic rebalancing mechanism, naturally forcing the fund to take profits on strong performers while accumulating cheaper shares.
The VanEck Australian Equal Weight ETF (MVW) serves as the primary domestic example. MVW assigns an equal weight to each ASX constituent, unlike VAS or A200.
This structure deliberately reduces single-stock and sector concentration risk within the domestic equity sleeve.
However, there is a clear trade-off with this approach. Equal-weighted structures can underperform cap-weighted indexes during periods when the largest companies are driving overall market returns, and they typically carry higher management fees.
This concentration issue is not exclusively an Australian problem. According to fund data, the BetaShares Global Shares ETF (BGBL) allocates more than 70% of its holdings to US equities, with over 30% concentrated in the US technology sector alone.
ASIC Regulatory Guide 282, updated in November 2025, requires ETF issuers to disclose index composition and diversification limits clearly, confirming that concentration is a known investor risk that regulators expect to be made explicit at the product level.
According to the Australian Securities and Investments Commission (ASIC) Regulatory Guide 282, updated in November 2025, issuers must disclose index composition and diversification limits clearly.
This regulatory requirement confirms that concentration is a known investor risk requiring explicit attention. Understanding the mechanical differences gives investors a genuine tool for managing exposure rather than accepting it by default.
| Weighting Method | Concentration Risk Profile | Australian Example |
|---|---|---|
| Market-Capitalisation | High exposure to largest stocks and sectors | VAS, A200 |
| Equal-Weighting | Balanced across all constituent companies | MVW |
Moving from mechanical theory to practical application requires a clear construction framework. The core-satellite approach is the dominant strategy recommended by issuers, advisers, and financial media platforms like Equity Mates and the Australian Finance Podcast.
This method prevents the common beginner error of assembling 10 to 15 overlapping products, which adds tax drag without meaningfully improving diversification.
Building a core ASX ETF portfolio around two or three broad index trackers, rather than assembling a dozen thematic positions, keeps both the fee drag and the annual tax administration burden at a level most investors can manage without specialist help.
Morningstar and financial planners commonly advocate 2-4 funds for beginners. Most industry experts suggest keeping the total count between 2-6 products.
The framework breaks portfolio construction into deliberate sequential choices.
The core should consist of broad index trackers. Examples include VAS or A200 for domestic shares, and the Vanguard MSCI International Shares ETF (VGS) or the iShares S&P 500 ETF (IVV) for global developed markets.
Bond exposure for risk management is typically handled through funds like the iShares Core Composite Bond ETF (IAF), the Vanguard Australian Fixed Interest ETF (VAF), or the BetaShares Australian Government Bond ETF (AGVT).
Satellite allocations are small, targeted positions in thematic or factor products. Examples include the BetaShares NASDAQ 100 ETF (NDQ), MVW, the VanEck MSCI World ex-Australia Quality ETF (QUAL), or the BetaShares Global Cybersecurity ETF (HACK).
Advisers strongly warn against letting satellite positions grow to dominate the overall balance, as this introduces unintended volatility.
Investors with heavy existing domestic exposure through employment, superannuation, or local real estate should consider tilting their core toward international equities for genuine diversification.
For those seeking maximum simplicity, single-product all-in-one solutions handle the modular balancing internally. The BetaShares Diversified All Growth ETF (DHHF) offers total global equity exposure for a 0.19% fee, while the Vanguard Diversified High Growth ETF (VDHG) includes a small fixed-income component.
A highly complex portfolio creates higher cumulative fees across multiple products and increases behavioural risk during market volatility. Investors who do not fully understand their holdings are statistically more likely to sell at the wrong time.
ASIC MoneySmart guidance consistently recommends keeping investment strategies simple and diversified by using low-cost index funds as core holdings.
The cost of complexity compounds dramatically over a long investment horizon. John Bogle, the originator of the three-fund portfolio concept, built an entire industry on the mathematical advantage of low fees.
The relationship between ETF fees and long-term returns is more mechanically direct than most investors appreciate: Morningstar research identifies the management expense ratio as a more reliable predictor of relative fund performance than past returns, fund size, or star ratings, because fees compound against the investor on every dollar, in every market condition, without exception.
Stockspot’s annual Fat Cat Funds reports consistently show persistent performance and cost advantages for low-fee index products over high-fee active funds. Morningstar research similarly finds that lower-cost funds demonstrate significantly higher rates of investment success across all performance quartiles.
Furthermore, the Australian Taxation Office treats most exchange-traded products as Attribution Managed Investment Trusts. Every additional fund creates distinct annual tax components, generating unnecessary administrative friction for investors attempting to calculate their cost base adjustments each year.
According to financial calculations, a 1% annual management fee applied to a $1 million target scenario costs approximately $125,000 in fees over the investment period, while a 0.1% fee costs approximately $13,000 under the exact same conditions.
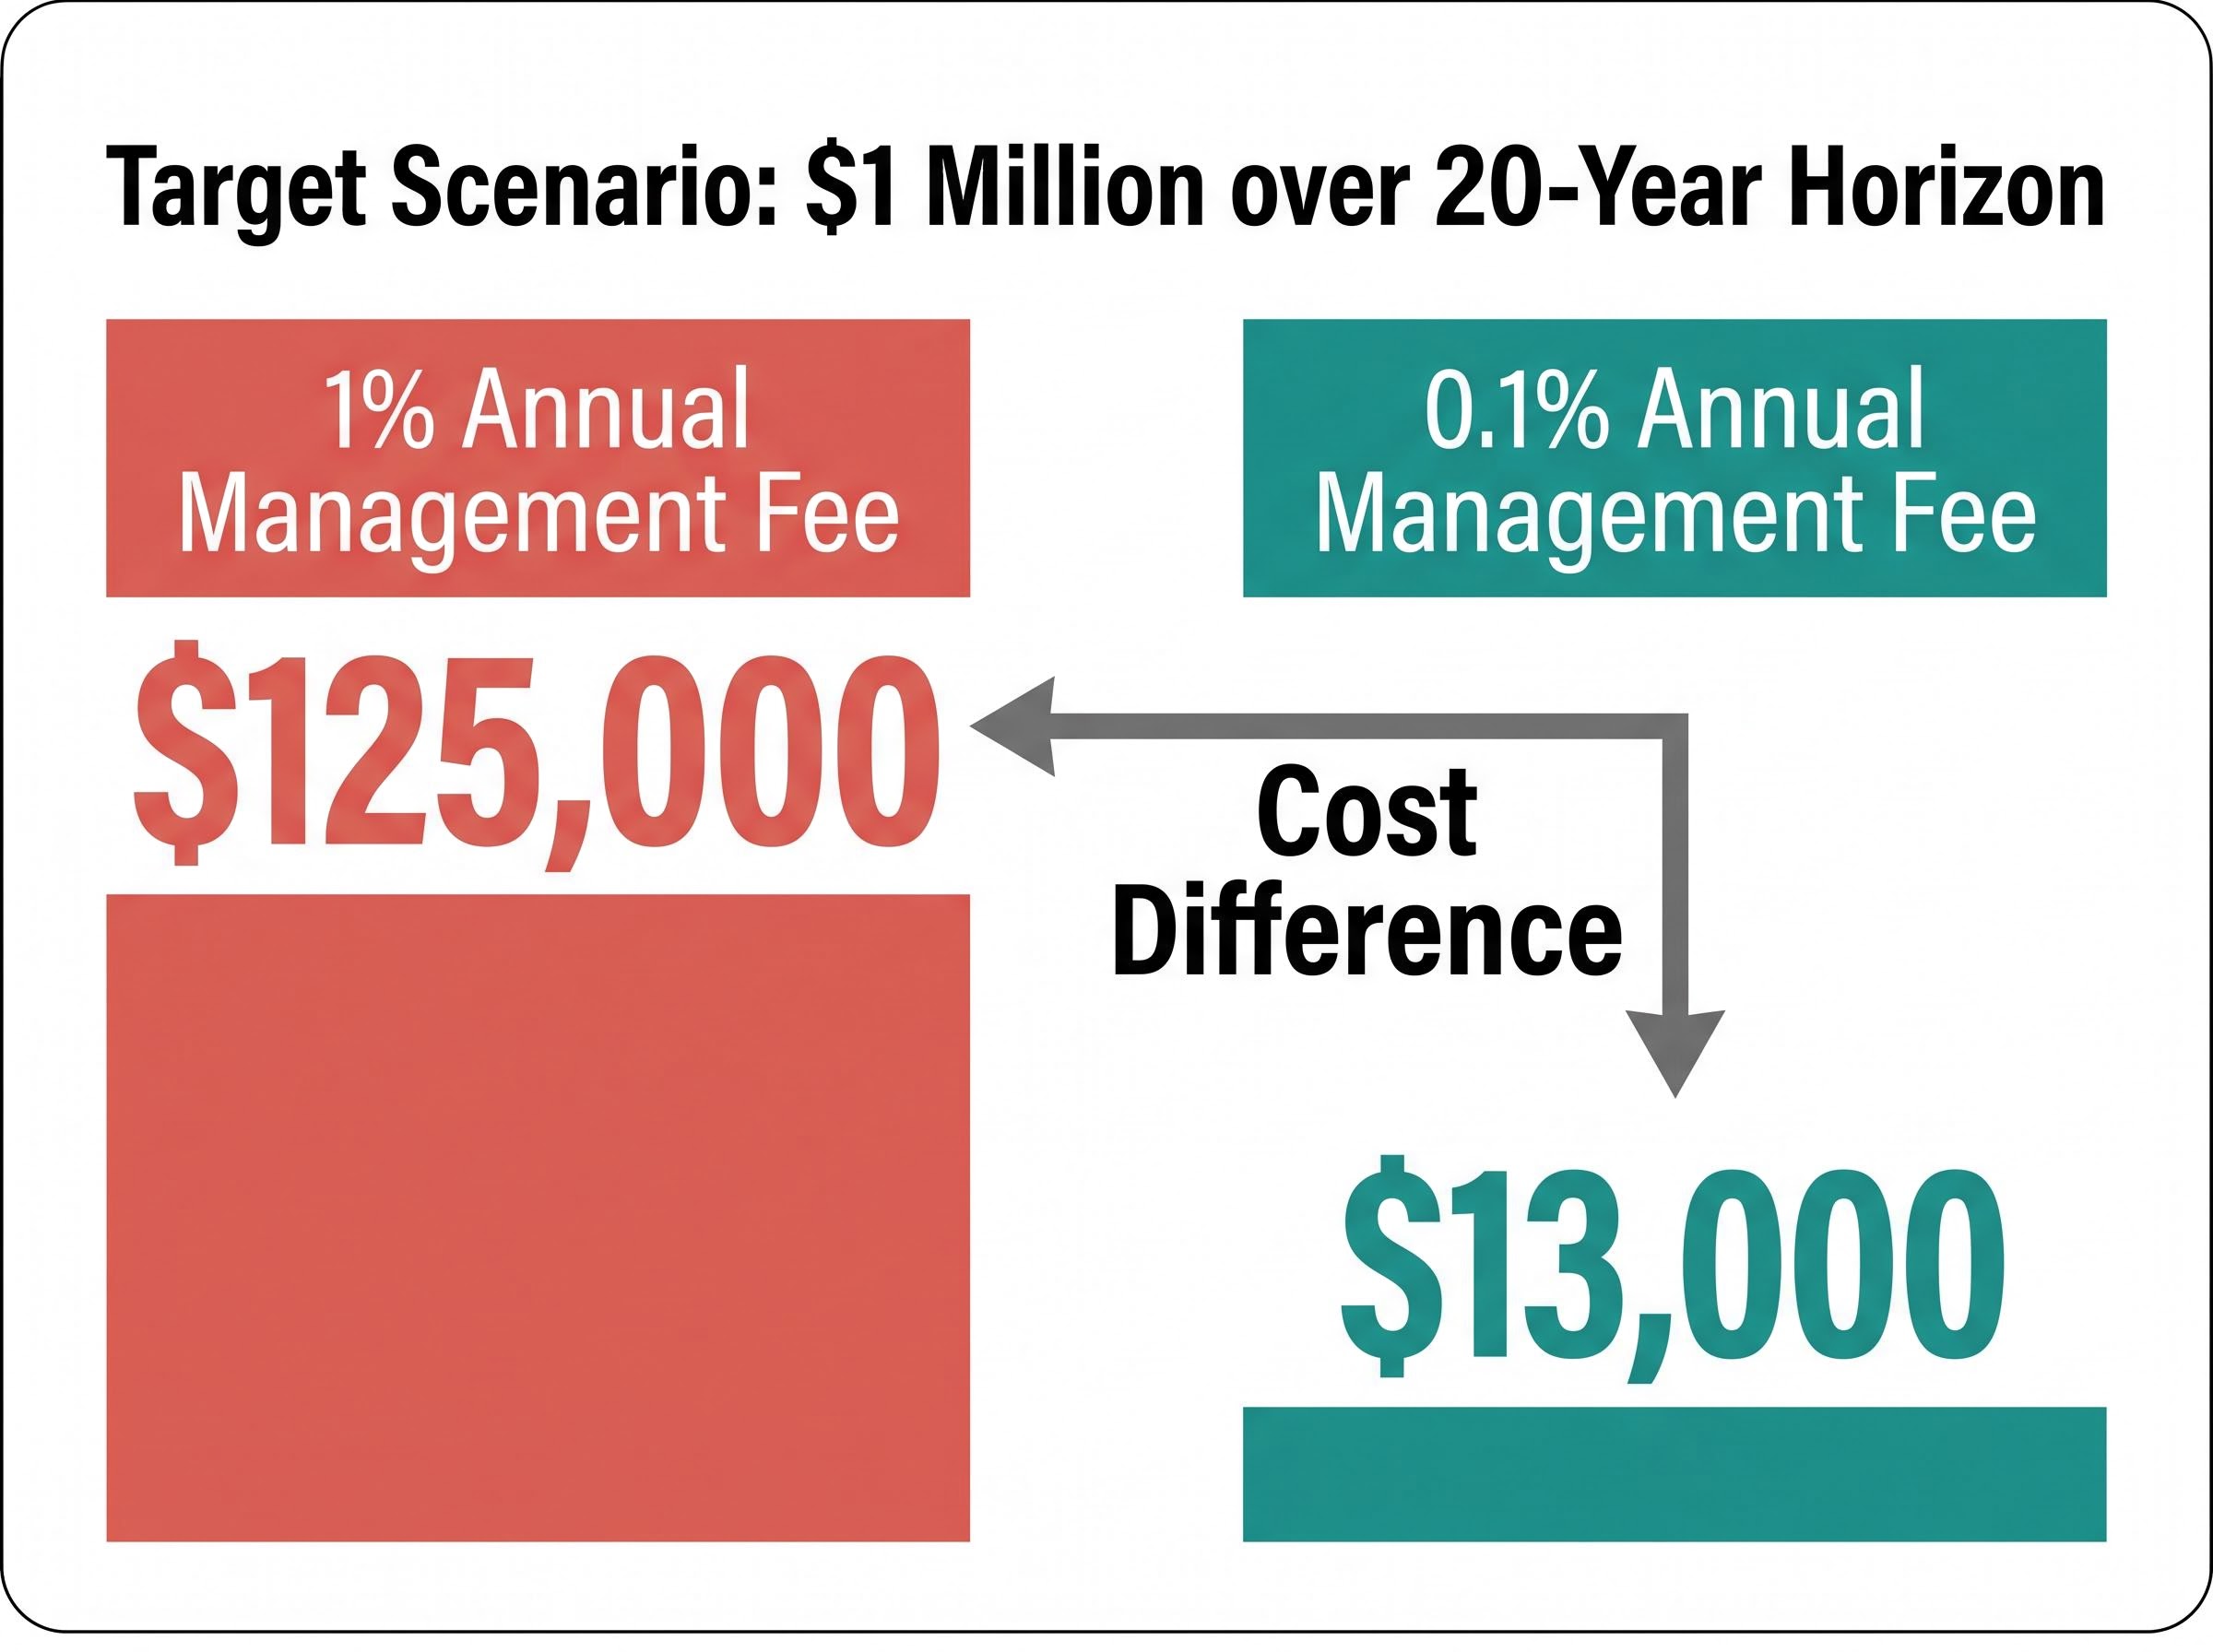
The fee differential between 1% and 0.1% may look trivial month-to-month, but across a 20-year horizon, the difference runs to six figures.
Real investor experiences, such as that of Equity Mates community member Cooper, validate the logic of starting with broad market funds and only adding deliberate international geographic tilts later.
Fee awareness is one of the highest-leverage decisions an investor can make, and a bloated strategy is often easy to spot.
Four key symptoms indicate an over-complicated portfolio: Holding too many overlapping funds that buy the exact same underlying companies. Placing highly concentrated thematic or leveraged products in the core allocation. An inability to explain exactly what each holding does during a market downturn. A high total annual fee drag that eats into compounding returns.
The three decisions examined in this guide work together as an integrated system rather than as isolated choices. The proportional asset split provides the engine for returns, the weighting structure dictates the concentration risk, and simplicity protects the capital from excessive fee drag.
Readers should regularly check the ASX Investment Products Monthly Report for current asset data and direct their attention to ASIC MoneySmart for baseline regulatory guidance.
Before adding another product to a brokerage account, take the time to review your current allocation split. Check whether your Australian equity exposure is cap-weighted or equal-weighted, and confirm your total fund count is manageable enough that you can explain the purpose of every single position.
For investors who have been accumulating index ETFs across a multi-year equity rally, our comprehensive walkthrough of portfolio rebalancing covers how to identify asset class drift, when a 5-percentage-point threshold should trigger action, and how to execute the adjustment tax-efficiently by sequencing new contributions before any taxable account sales.
This article is for informational purposes only and should not be considered financial advice. Investors should conduct their own research and consult with financial professionals before making investment decisions. Past performance does not guarantee future results. Financial projections are subject to market conditions and various risk factors.
Asset allocation is the proportional split of your investments across asset classes such as equities and bonds. According to Morningstar, this split is considered more important than the specific products chosen, as it determines the majority of long-term portfolio returns.
Market-capitalisation weighting assigns larger companies proportionally larger allocations within an index. In Australia, this means the top 10 ASX 200 companies account for nearly 50% of a broad-market ETF, concentrating nearly half of domestic equity exposure in banks and miners by default.
Morningstar and financial planners commonly advocate 2-4 funds for beginners, with most industry experts suggesting a total of 2-6 products to avoid tax drag, fee complexity, and overlapping holdings that do not meaningfully improve diversification.
Cap-weighted ETFs allocate more to the largest companies, creating heavy concentration in a few stocks, while equal-weighted ETFs like the VanEck Australian Equal Weight ETF (MVW) assign an identical allocation to every constituent, reducing single-stock and sector concentration risk.
According to financial calculations in the article, a 1% annual management fee applied to a $1 million target scenario costs approximately $125,000 in fees over the investment period, compared to approximately $13,000 for a 0.1% fee under the exact same conditions.