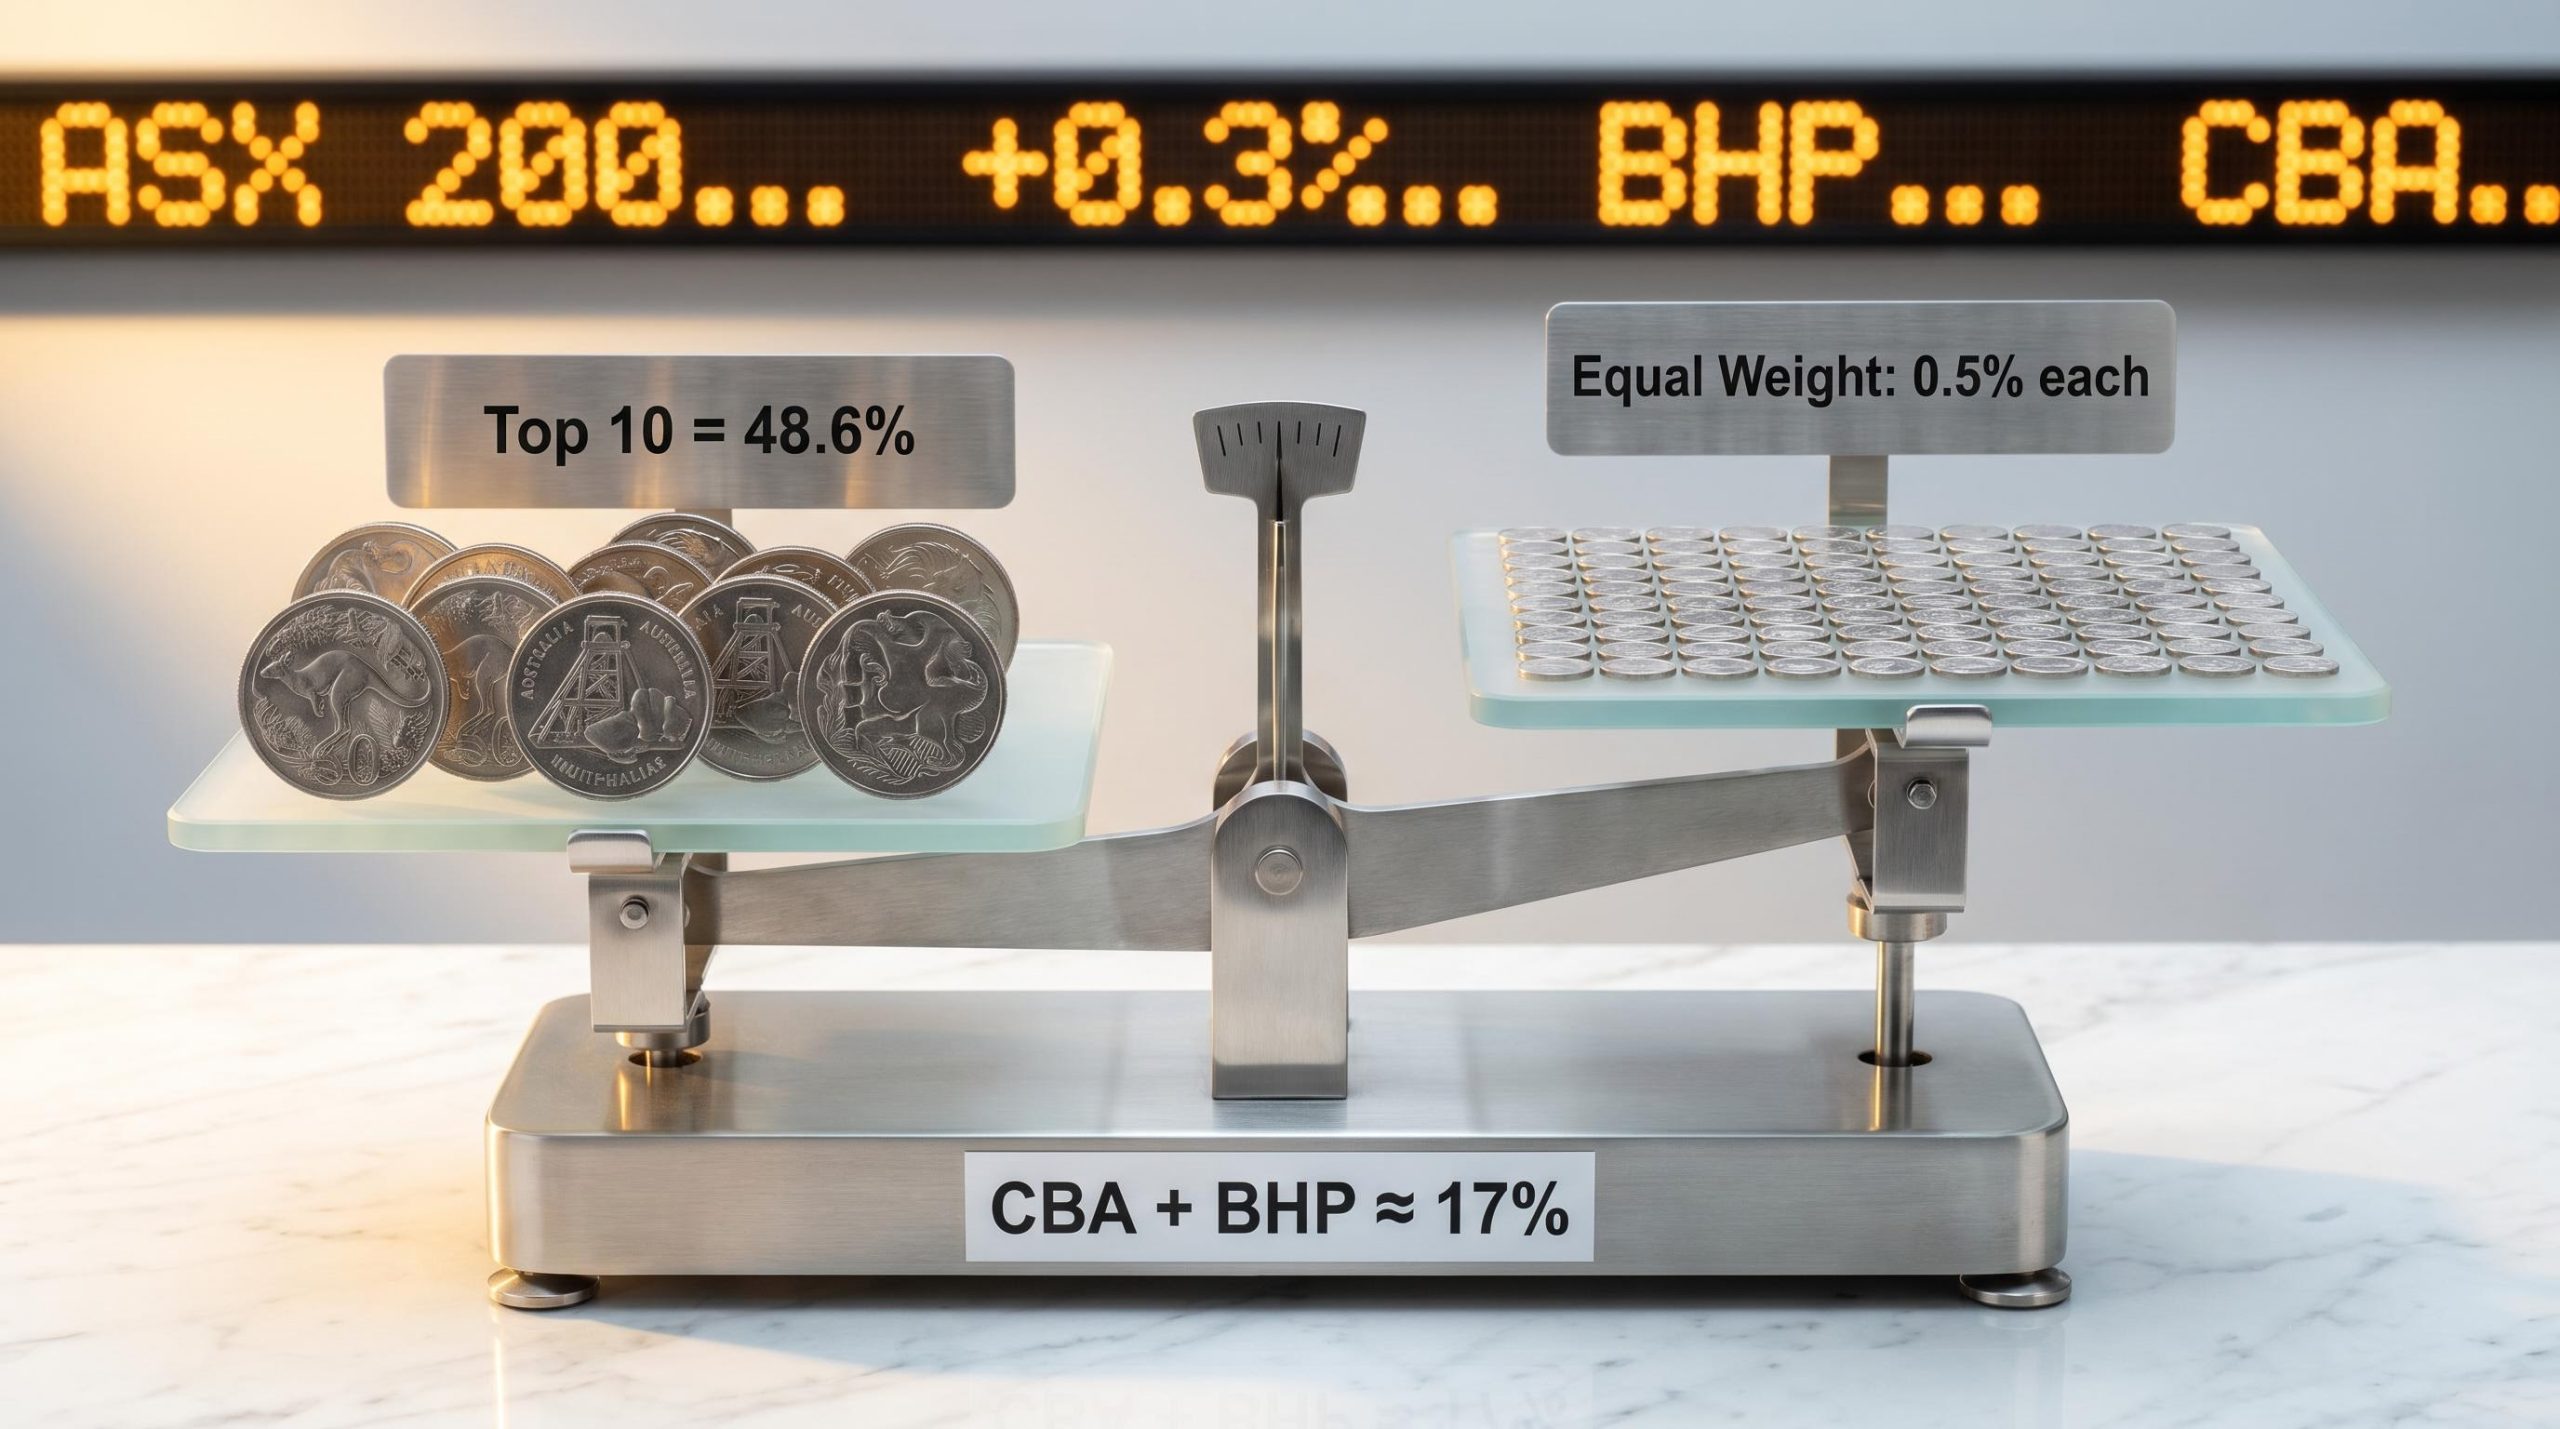
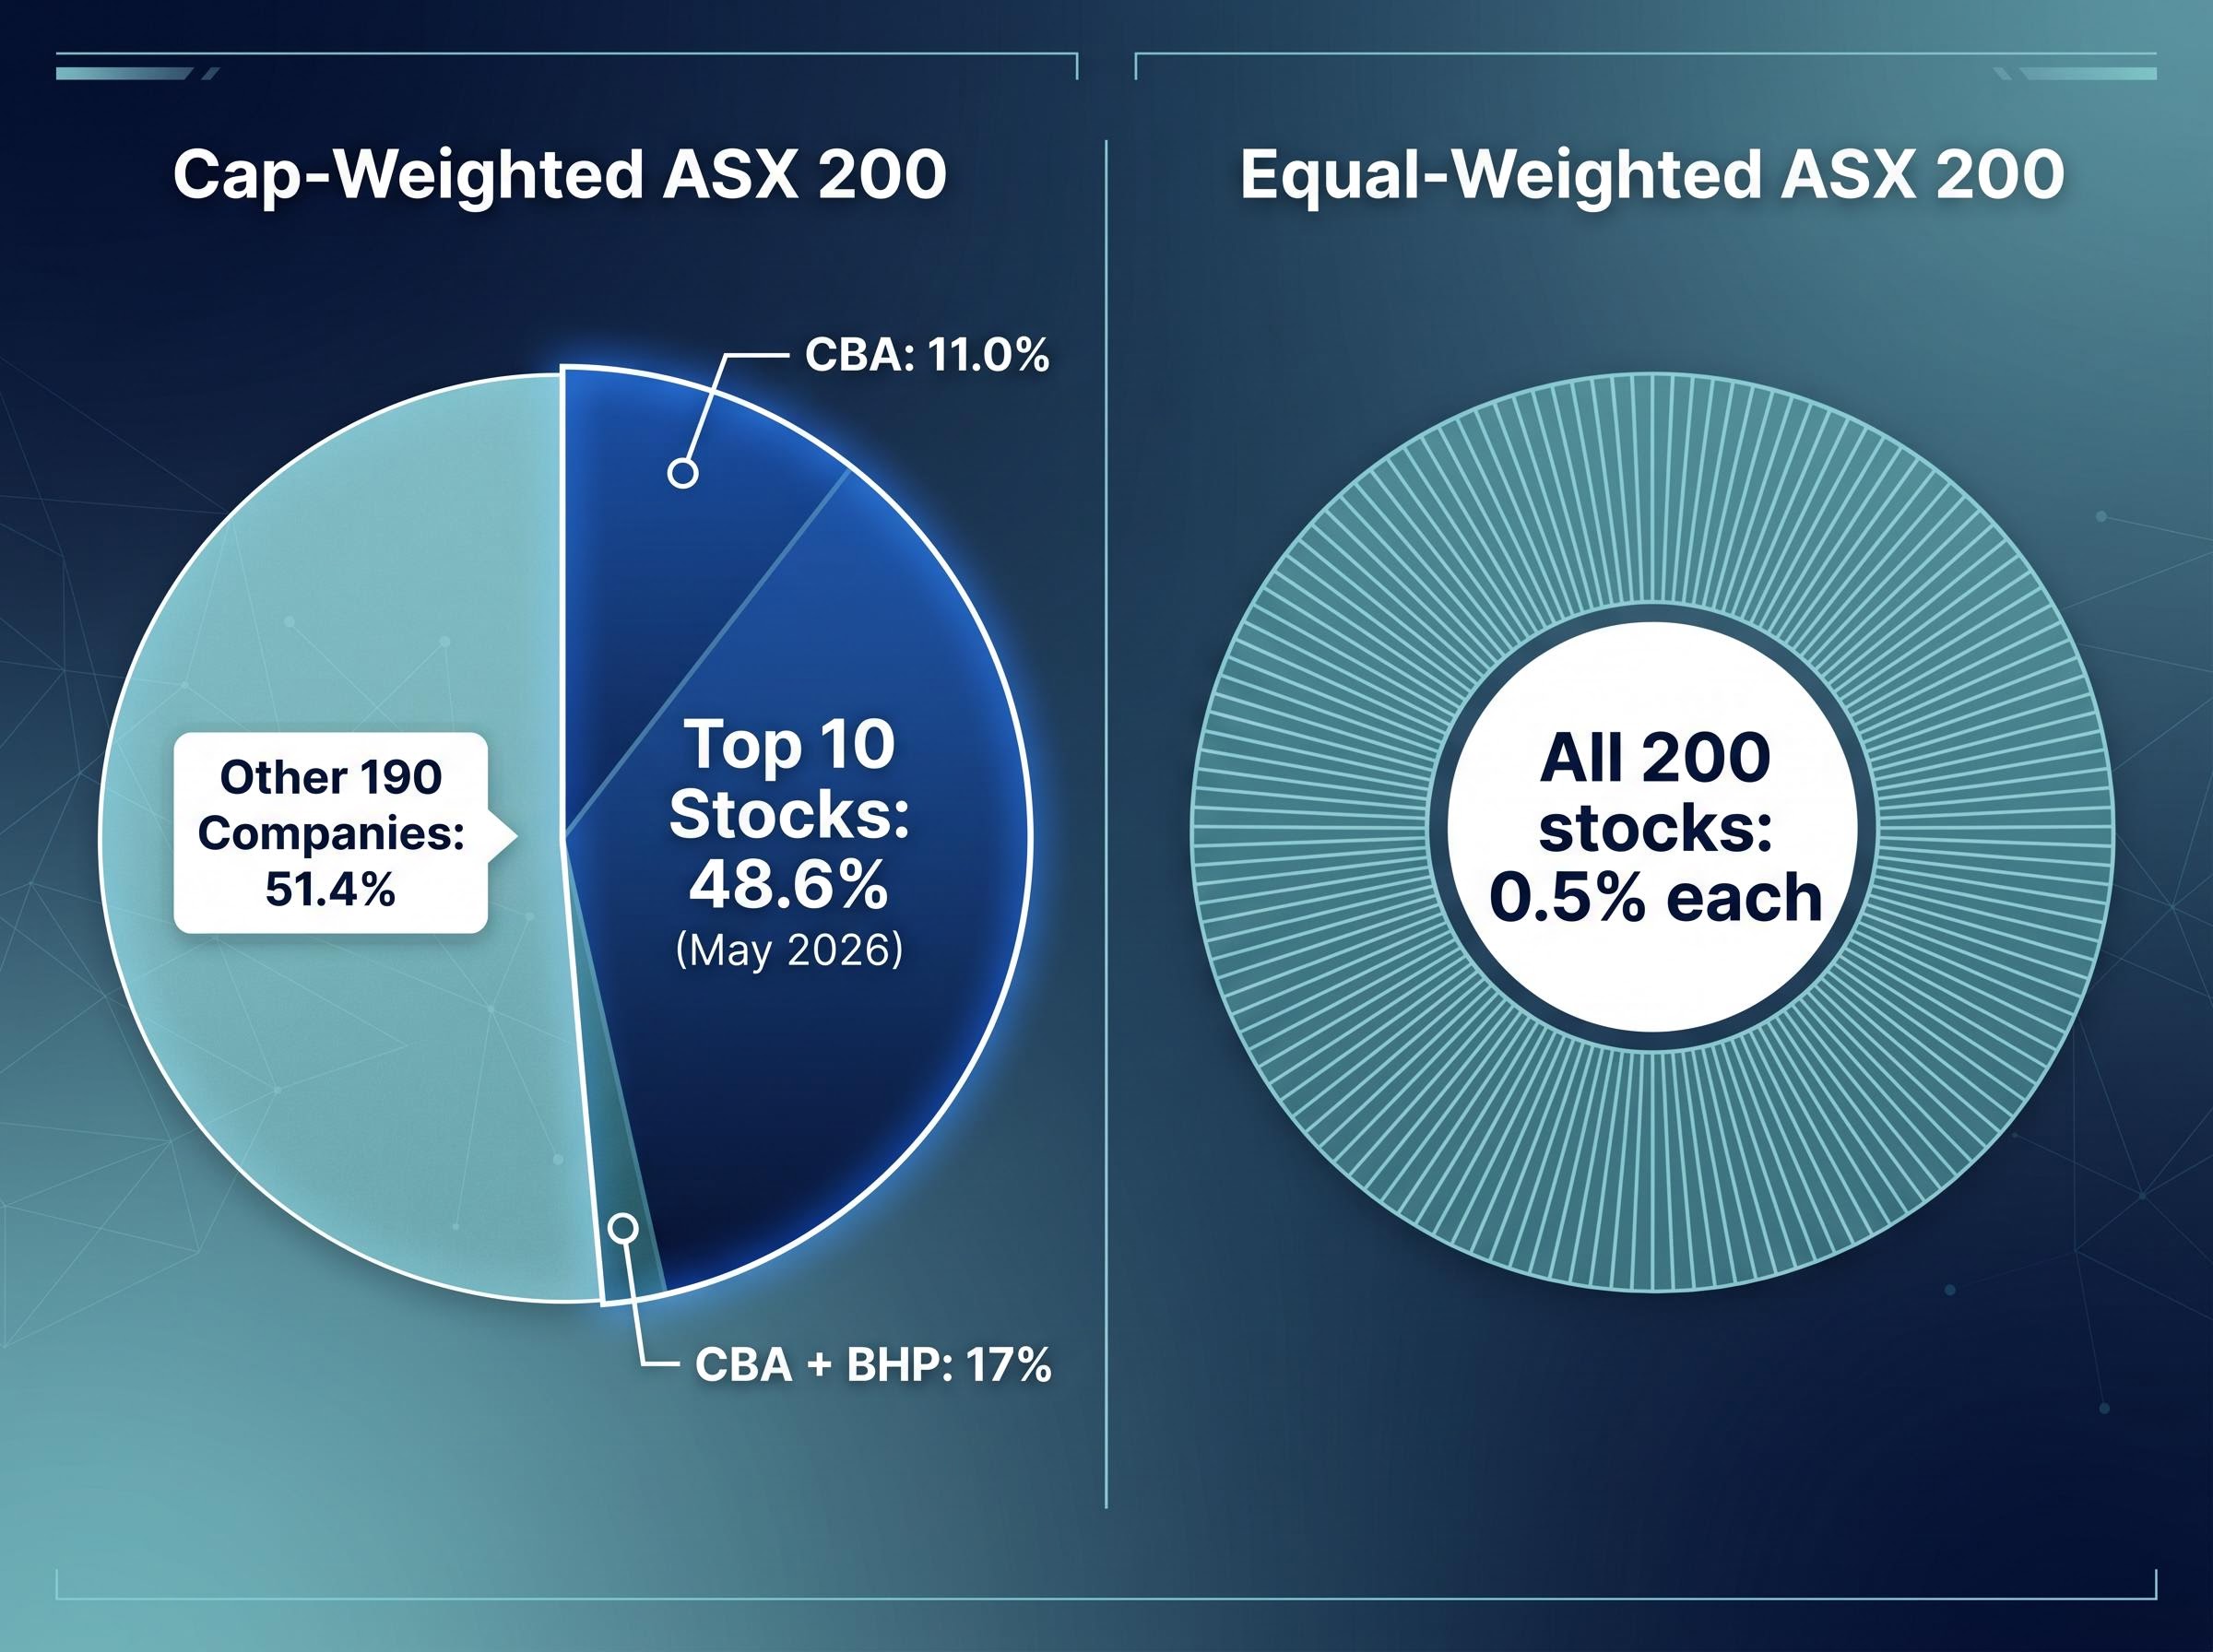
Almost half of the ASX 200 belongs to just 10 companies. As of May 2026, the top 10 holdings account for 48.6% of the index, according to S&P Global data. An investor who buys a “diversified” ASX index ETF is, structurally, placing nearly half their domestic equity exposure into a handful of banks and miners.
The distinction between market capitalisation-weighted and equal-weighted ETFs determines how concentrated that risk actually is. For Australian investors, the distinction carries particular weight given the sector composition of local indices and the US-heavy makeup of most global ETFs. Yet the label “diversified” on a fund’s product page rarely signals anything about the distribution of that exposure.
What follows explains exactly how cap-weighted and equal-weighted index construction differs, what that difference means for Australian investors using ASX and global ETFs, and how to evaluate which structure suits a given portfolio. The analysis uses current data from Australian-listed funds and providers to make the trade-offs concrete rather than theoretical.
How index construction determines who gets how much of your money
Market capitalisation weighting assigns each company a share of the index proportional to its total market value. The larger the company, the larger its slice of every dollar invested. Commonwealth Bank (CBA) holds approximately 11.0% of the ASX 200 index as of May 2026, according to S&P Global data. CBA and BHP together account for roughly 17% of the index.
This is not an accident. It is the deliberate logic of cap-weighting: the market’s own pricing determines each company’s share. The result is that capital flows disproportionately toward the largest names, concentrating exposure among the companies the market has already valued most highly.
The equal-weight alternative: same index, different distribution
Equal-weighted funds use the same universe of stocks as their cap-weighted counterparts but assign each constituent an identical allocation. In an equal-weighted version of the ASX 200, each of the 200 stocks would receive 0.5%, regardless of whether it is a big-four bank or a small-cap miner.
These funds typically rebalance quarterly back to equal allocations. That rebalancing acts as a built-in mechanism that systematically trims outperformers (selling high) and tops up underperformers (buying low), a structural feature that distinguishes the approach from cap-weighting’s tendency to let winners accumulate.
Neither approach is inherently superior. Each encodes a different assumption about where returns will come from: cap-weighting bets on the continued dominance of the largest companies, while equal-weighting bets on broader participation across the index.
| Dimension | Cap-Weighted | Equal-Weighted |
|---|---|---|
| Allocation method | Proportional to market value | Identical weight per stock |
| Concentration outcome | Top holdings dominate | Exposure spread evenly |
| Rebalancing mechanics | Minimal; weights drift with prices | Quarterly reset to equal allocations |
| Implicit market view | Largest companies will continue to lead | Returns will come from broader participation |
When big ASX news breaks, our subscribers know first
What nearly 50% in 10 stocks actually looks like inside the ASX 200
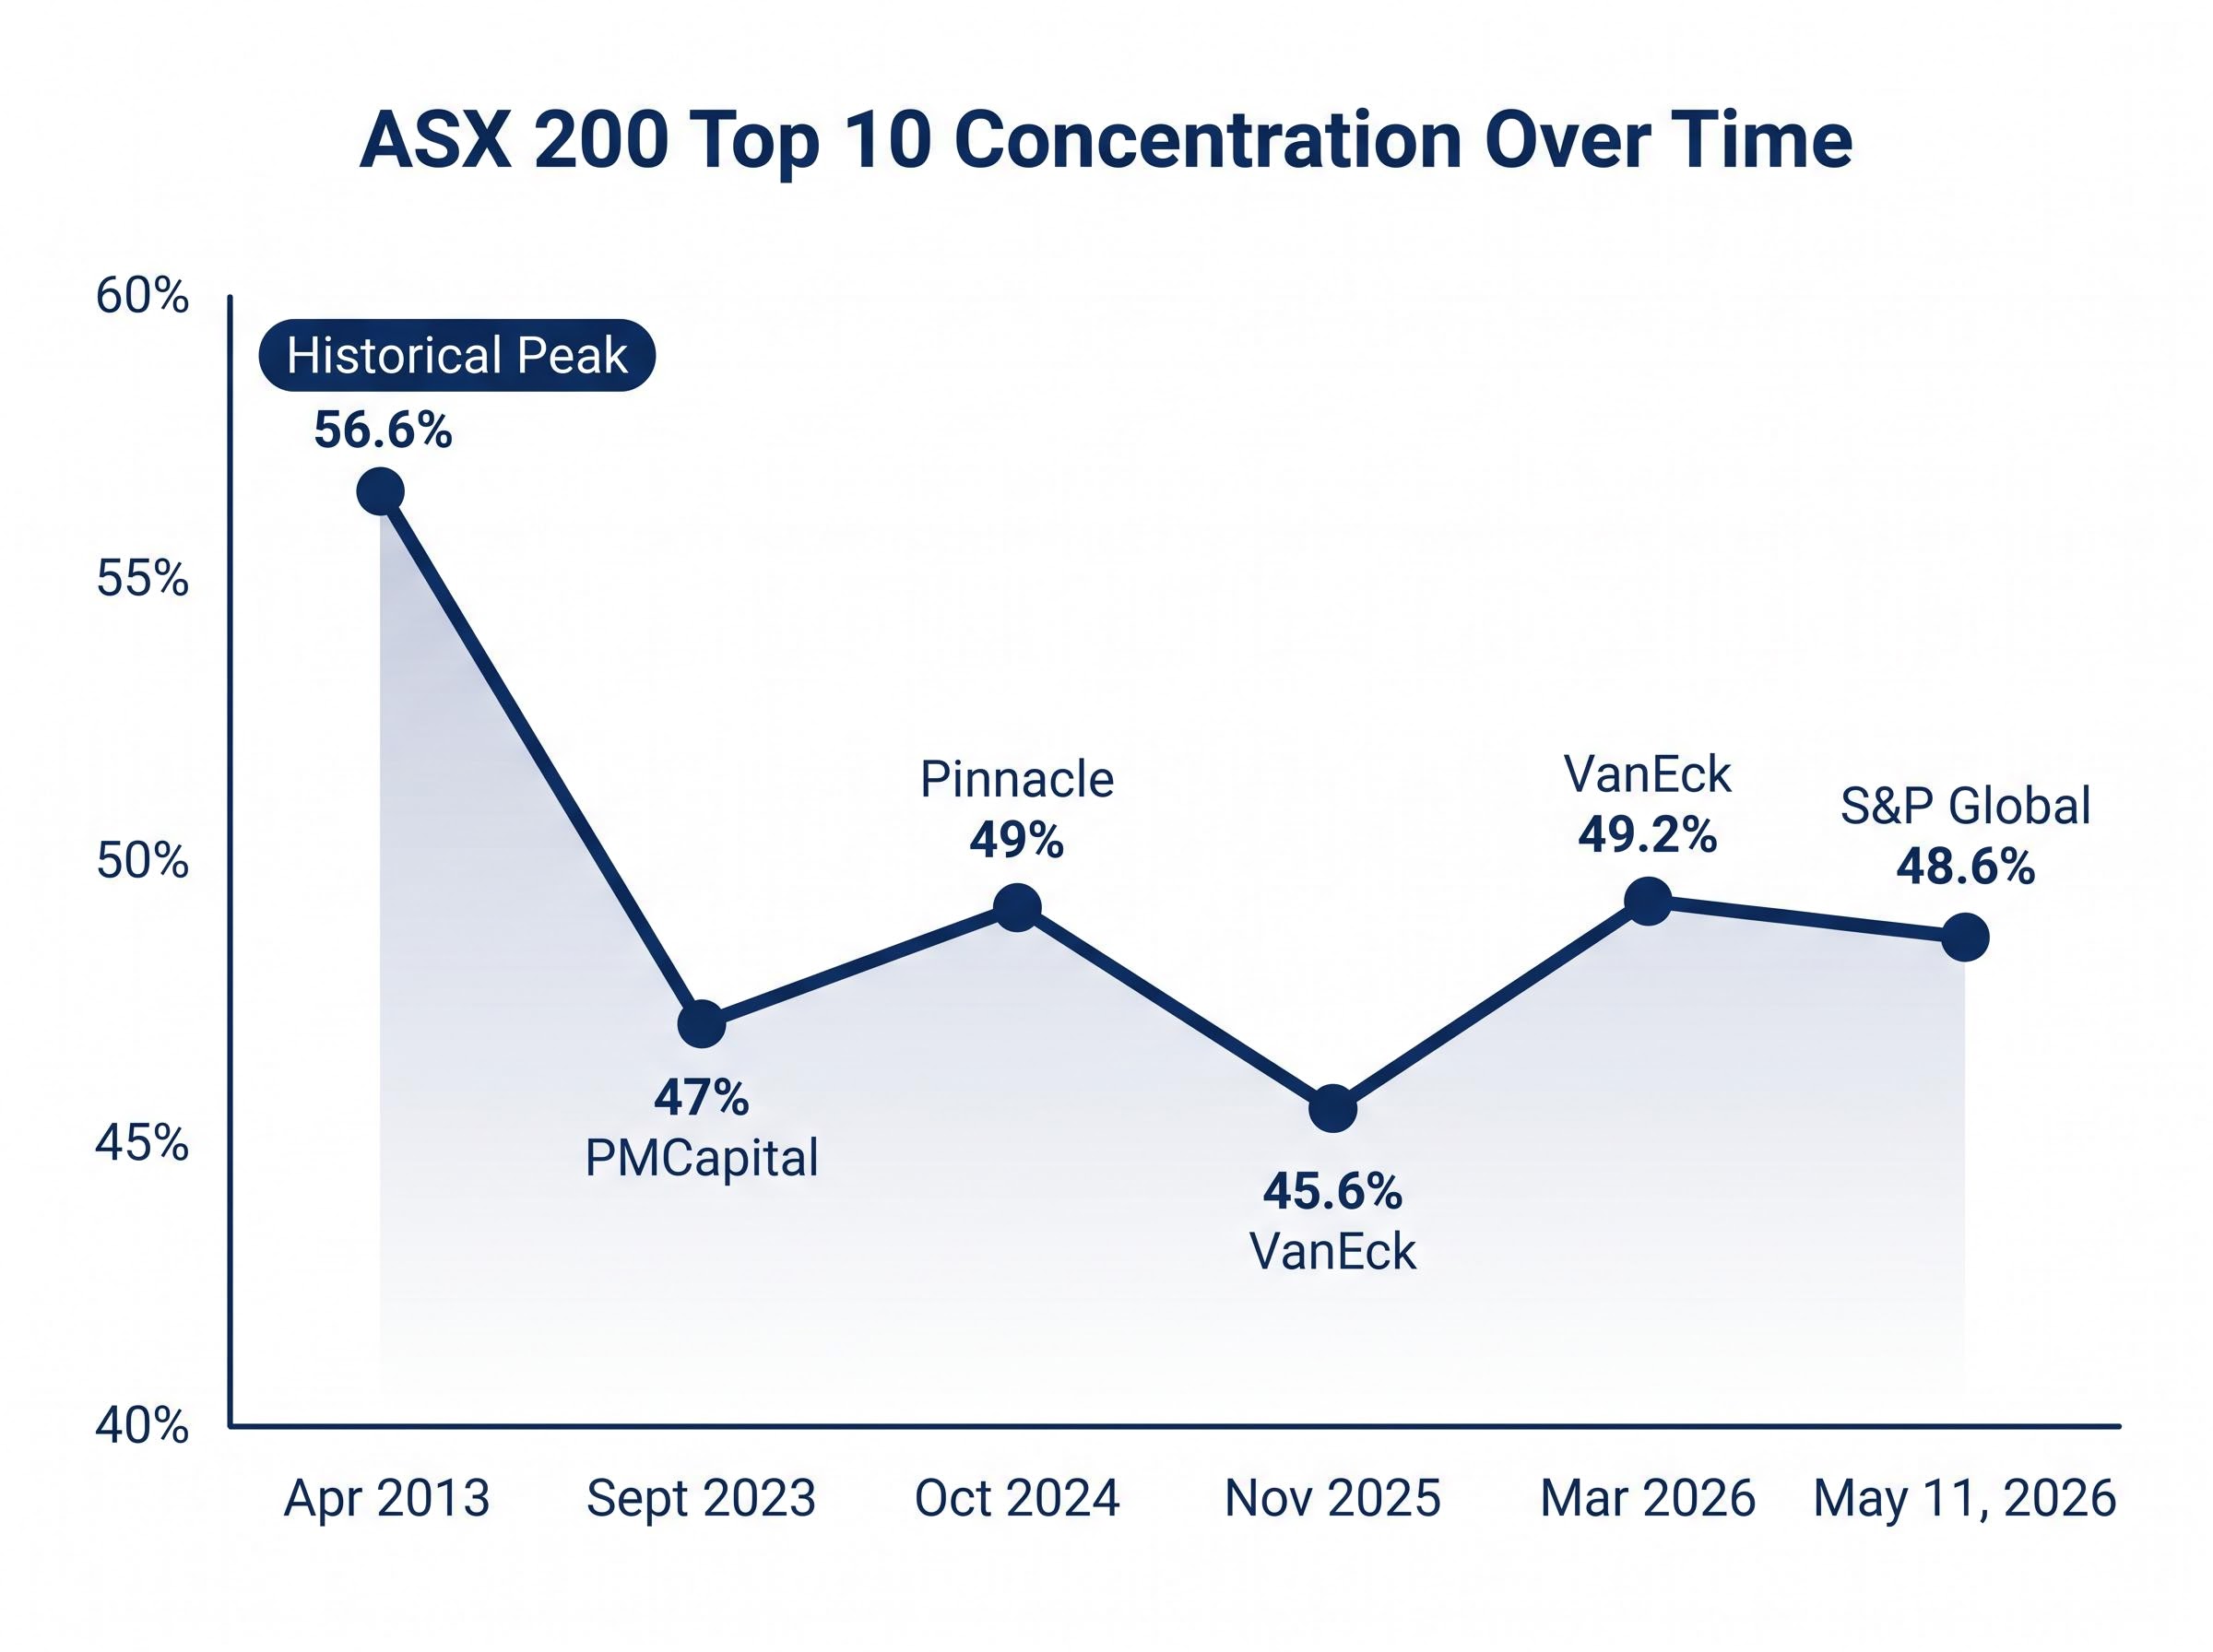
The 48.6% figure is not a one-off snapshot. Multiple sources across different dates confirm the same structural pattern:
- S&P Global (May 11, 2026): Top 10 concentration at 48.6%
- VanEck (March 2026): 49.2%, up from 45.6% in November 2025
- Pinnacle Investment (October 2024): 49%
- PMCapital (September 2023): 47%
The consistency is the point. Across three years and four independent snapshots, the top 10 has held between 47% and 49.2% of the index. The remaining 190 companies share the other 51.4%.
What those top 10 holdings actually represent matters as much as the percentage. The dominant sectors are Financials (the big-four banks) and Materials (large resource companies). An ASX 200 index ETF is not a broad bet on the Australian economy. It is a concentrated bet on a narrow slice of it.
“Investing in an ASX 200 index fund is effectively a bet on the big-four banks and a handful of big resource stocks.” — PMCapital
VanEck’s data adds a temporal dimension: concentration rose from 45.6% to 49.2% between November 2025 and March 2026, a pace the firm described as not seen outside crisis periods. RBA research (Discussion Paper RDP 2019-04) provides longer-term context, noting that the ASX top 10 has represented approximately 50% of the top 100 stocks since 1917. Concentration peaked at 56.6% in April 2013, according to VanEck.
The RBA Discussion Paper RDP 2019-04, a historical study of Australian equities, provides the long-run foundation for that observation, documenting that the ASX top 10 has represented approximately 50% of the top 100 stocks since 1917, with concentration peaking at 56.6% in April 2013.
By contrast, Pinnacle Investment noted that the ASX Small Ordinaries index top 10 accounts for only 14% of that index, illustrating how dramatically concentration differs across market-cap tiers.
The underlying mechanics of ASX wealth concentration explain why cap-weighted indices behave the way they do: across 210 large-cap ASX companies over 15 years, just 10 stocks generated 56% of all returns, with a single outlier, Pro Medicus, accounting for 27% of the total, meaning the passive investor who held the index captured that outsized gain automatically while the stock-picker had to identify it in advance.
Global ETFs and the US concentration problem most investors miss
Concentration risk does not stop at the domestic sleeve. ETFs marketed as “global” or “international” are typically benchmarked against the MSCI World index or similar developed-market indices. These are themselves cap-weighted, meaning they tilt heavily toward the largest global markets by market capitalisation.
Why cap-weighting amplifies US tech exposure over time
The reflexive dynamic of cap-weighting plays out most visibly in global indices. As large US technology companies grow, their index weight grows, which attracts more passive inflows, which supports further price appreciation, which reinforces the weight. This is a feature of cap-weighting, not a flaw, but it means investors passively accumulate more US tech concentration the longer they hold.
US index fund concentration has followed the same self-reinforcing logic at an even more extreme scale: five mega-cap stocks controlled approximately 23% of the broad US market index as of mid-April 2026, drove roughly 70% of the market’s Q1 2026 decline, and then delivered more than half of April’s recovery, a dynamic that cap-weighted global ETFs held by Australian investors embed by default.
The Betashares Global Shares ETF (BGBL) illustrates the result. As of 30 April 2026, BGBL carried a 73.2% US weighting and a 28.1% technology sector allocation, according to Betashares. VGS and IWLD track similar developed-market indices and carry analogous US concentrations consistent with the MSCI World index’s roughly 70%+ US composition at current market valuations; investors should check current factsheets for live data.
An Australian investor holding both a domestic ASX index ETF and a global index ETF may believe they have achieved broad geographic and sector diversification. Both positions may instead carry embedded concentration: Financials and Materials domestically, US Technology internationally.
| Dimension | BGBL (Cap-Weighted Global) | Equal-Weighted Global (Conceptual) |
|---|---|---|
| US weighting | 73.2% | Proportional to country count (significantly lower) |
| Technology allocation | 28.1% | Proportional to sector count (significantly lower) |
| Concentration dynamic | Self-reinforcing as US tech grows | Rebalanced periodically to equal allocations |
More than 400 ETFs are currently listed in Australia, compared with upward of 4,000 in the US market. Even within that growing domestic range, the equal-weight options for global exposure remain limited.
The performance trade-off: what the live data shows about equal-weight ETFs in Australia
The structural argument for equal-weighting is one thing. The live return data tells a more complicated story.
| ETF | 2024 Return | 2025 Return |
|---|---|---|
| MVW (VanEck Equal Weight) | 9.40% | 7.83% |
| VAS (Vanguard Australian Shares) | 11.40% | 10.65% |
| IOZ (iShares Core S&P/ASX 200) | 11.34% | 10.26% |
MVW lagged both cap-weighted peers by approximately 2 percentage points per year in both 2024 and 2025. That is a measurable cost, and it compounds over time.
VanEck’s historical case points in a different direction. After the 2013 concentration peak of 56.6%, equal-weight outperformed cap-weight over the subsequent five years.
“+22.1% average outperformance over 5 years following the 2013 concentration peak.” — VanEck historical data
VanEck has argued that the current regime, characterised by the speed of the recent concentration increase, may represent a structural shift favouring equal-weight going forward. The firm notes that at high concentration levels (around 45.5%), equal-weight’s historical win rate was only 35%, but contends the current rate of increase changes the calculus.
The honest reading is this: the backtested case for equal-weight outperformance at high concentration levels is real and historically documented. The recent live data has not yet confirmed it. Investors considering equal-weight ETFs should understand that distinction clearly.
Past performance does not guarantee future results. Financial projections are subject to market conditions and various risk factors.
What equal-weight and cap-weight ETFs are actually available on the ASX right now
The conceptual framework is useful only if it connects to products investors can actually buy. In Australia, the equal-weight ETF category remains narrow:
- MVW (VanEck Australian Equal Weight ETF): The primary ASX-listed equal-weight option for domestic equities. Tracks an equal-weighted version of the ASX 200 universe. VanEck positions it as a complement to cap-weighted ASX exposure rather than a full replacement.
- QNDQ (Betashares NASDAQ 100 Equal Weight ETF): Launched February 2024 on the ASX. Provides equal-weighted exposure to NASDAQ 100 constituents, offering a way to reduce US tech concentration within the international sleeve of a portfolio.
- ALFA (VanEck Australian Long Short Complex ETF): Launched early 2025. An actively managed systematic long/short strategy that seeks to exploit valuation distortions created by concentration (going long on underweights and short on overweights). Not an equal-weight index product, but a related active alternative that responds to the same structural problem.
Beyond these options, the equal-weight category on the ASX remains limited. More than 400 ETFs are listed in Australia, but investors wanting equal-weight global developed-market exposure have few direct choices. This breadth limitation is worth factoring into any allocation decision.
Building a global portfolio on the ASX using cap-weighted funds such as IVV and VGS delivers broad developed-market exposure at a low cost, but both carry the US concentration profile described above, with VGS holding approximately AUD 44.2 billion under management as at March 2026 and IVV charging approximately 0.04% per annum, making fee drag a comparatively minor concern relative to country concentration for most long-term holders.
This product overview is not a recommendation. Each fund carries its own risk profile, fee structure, and investment objective.
How to decide which structure belongs in your portfolio
The choice between cap-weighted and equal-weighted ETFs is a portfolio composition question, not a performance prediction. The right answer depends on what an investor already holds, not on which structure has performed better recently.
Four questions provide a starting framework:
- What does superannuation already hold? Investors with default MySuper options are typically allocated to cap-weighted ASX and global indices. Before buying a single ETF, the cap-weighted concentration may already be embedded in their total wealth position.
- Am I employed in a sector that features heavily in the ASX 200? An investor working in banking or mining already carries implicit sector exposure through their employment income and job security. Adding cap-weighted ASX index exposure doubles that concentration.
- Am I comfortable with the current sector composition of the index? If the top 10 holdings reflect sectors the investor is confident in over their time horizon, cap-weighting may be entirely appropriate.
- What is the fee difference between the two options I am comparing? Equal-weight ETFs may carry higher management expense ratios than cap-weight equivalents. The difference compounds over decades.
Morningstar’s analysis offers a useful frame: one specialist noted her own portfolio tilts international because her superannuation, employment, mortgage, and industry exposure are all linked to Australia. The concept of deliberate asymmetry applies here. An investor heavily exposed to Australian Financials through super and employment might actively prefer a domestic equal-weight ETF to reduce that implied concentration.
Fees, rebalancing costs, and the total cost of choosing equal-weight
Equal-weight ETFs require more frequent rebalancing (typically quarterly) than cap-weighted funds, and this mechanically increases transaction costs that may be reflected in the management expense ratio. Morningstar modelling illustrates the long-term impact of fees: a 1% annual fee compounds to approximately $125,000 in total costs over a long investment horizon, compared with roughly $13,000 for a 0.1% fee over the same period. Investors should compare management expense ratios directly from provider factsheets when evaluating MVW against VAS or IOZ.
For investors wanting to model the compounding fee impact across the full ASX ETF universe rather than the two or three funds compared here, our dedicated guide to ETF fee comparison on the ASX applies a category-relative screening framework using the Morningstar Price Score, with worked examples showing how a sub-1% fee difference compounds into more than $575,000 in terminal wealth divergence over 30 years.
Morningstar’s 20-year capital market assumption projects both Australian and international equities to return approximately 7% annually. In that environment, fees and structural choices become a larger share of the return outcome.
Concentration is a choice, not a default
The label “diversified” on an ETF product page describes the fund’s universe, not its distribution of risk. The data in this article makes two structural facts visible: ASX 200 index ETFs concentrate nearly half of domestic equity exposure into 10 stocks, predominantly in Financials and Materials (48.6% as of May 2026). Major global index ETFs concentrate roughly 73.2% of international exposure into the US market, with over a quarter in technology (BGBL data, April 2026).
Neither fact makes cap-weighted or equal-weighted funds inherently better. Both facts make informed choice possible. Australian-listed ETFs are legally required to disclose their full holdings. Before selecting any fund, investors can examine the actual holdings, the top 10 concentration figure, and the country and sector breakdown on the provider’s factsheet or ASX disclosure page.
Index construction is not a passive default. It is an active decision embedded in every ETF purchase, and one that every investor can inspect before committing capital.
This article is for informational purposes only and should not be considered financial advice. Investors should conduct their own research and consult with financial professionals before making investment decisions.