A lockup expiration that doubles the available float should, in theory, punish shareholders. SpaceX’s first major unlock did the opposite: the stock posted a 6.1% advance on 6 August before adding a further 15.8% the next day, inflicting a painful squeeze on bears who had positioned for the opposite outcome.
With a second tranche of approximately 319 million shares set to unlock on 20 August, the options market is not sitting idle. Bearish put buyers have committed well over $8.5 million in premium across three distinct strike tiers, spread over several expiration dates. The shape of that positioning is more interesting than the dollar amount.
Here is how the first unlock produced a squeeze when it should have produced a selloff, what the tiered put structure tells you about where sophisticated traders think SpaceX shares are headed, and how to read this kind of options tape yourself the next time a major unlock cycle approaches.
How SpaceX’s first unlock became a short squeeze in reverse
Going into 6 August, the directional thesis appeared well-founded. Bearish positions had accumulated heavily ahead of the date, with broad market consensus expecting the float expansion to weigh on the stock. SpaceX shares had already fallen steeply from their post-IPO peak back toward the $100 level, meaning the bearish trade was a crowded one stacked on top of an already significant drawdown.
SpaceX short interest had reached 29-31% of the SPCX float heading into the August window, with an estimated $15.5 billion in paper profits accumulated by bears who, despite their gains, showed no signs of covering, a structural condition that made the crowded pre-positioning particularly fragile.
Then the expected flood of selling never arrived. Pre-event coverage cited a potential insider selling ceiling of approximately $101-$123 billion in eligible stock. That was the ceiling, not a forecast, and actual insider selling proved far more restrained than bears had positioned for. The gap between what the market feared and what actually happened became the catalyst.
The squeeze unfolded in three steps:
- Crowded pre-positioning: Short interest and bearish options structures were heavily concentrated ahead of a well-telegraphed date, compressing the margin for error on the downside thesis.
- Restrained insider selling: Actual supply hitting the market fell well short of the feared ceiling, removing the fundamental pressure the short thesis depended on.
- Forced short covering: With the bearish catalyst failing to materialise, shorts began covering into rising prices, amplifying the upward move and turning the unlock itself into fuel for the rally.
On the lockup expiration date of 6 August 2026, SpaceX shares advanced 6.1%, then climbed a further 15.8% in the session that followed.
The magnitude of the feared selling ceiling and the magnitude of the actual selling were two entirely different numbers. Confusing the two is what put short sellers in the squeeze.
When big ASX news breaks, our subscribers know first
What lockup expirations actually do to a stock (and why the simple answer is wrong half the time)
A lockup period is a contractual restriction that prevents insiders, those who held shares before the IPO, from selling for a defined window after listing. When that window expires, previously restricted shares become eligible for sale, expanding the tradable float. In theory, more supply means lower prices.
In practice, the outcome depends on context. SpaceX’s lockup structure is staggered rather than the single 180-day cliff that many investors assume is standard. That distinction matters.
Four decades of academic research on lockup expiration price impact find average abnormal returns of approximately -1.5% around these events, a figure that cuts sharply against the catastrophic supply-shock narrative that concentrates short interest ahead of well-telegraphed dates.
| Tranche Date | Shares Released (Approx.) | Cumulative Float Impact | Notes |
|---|---|---|---|
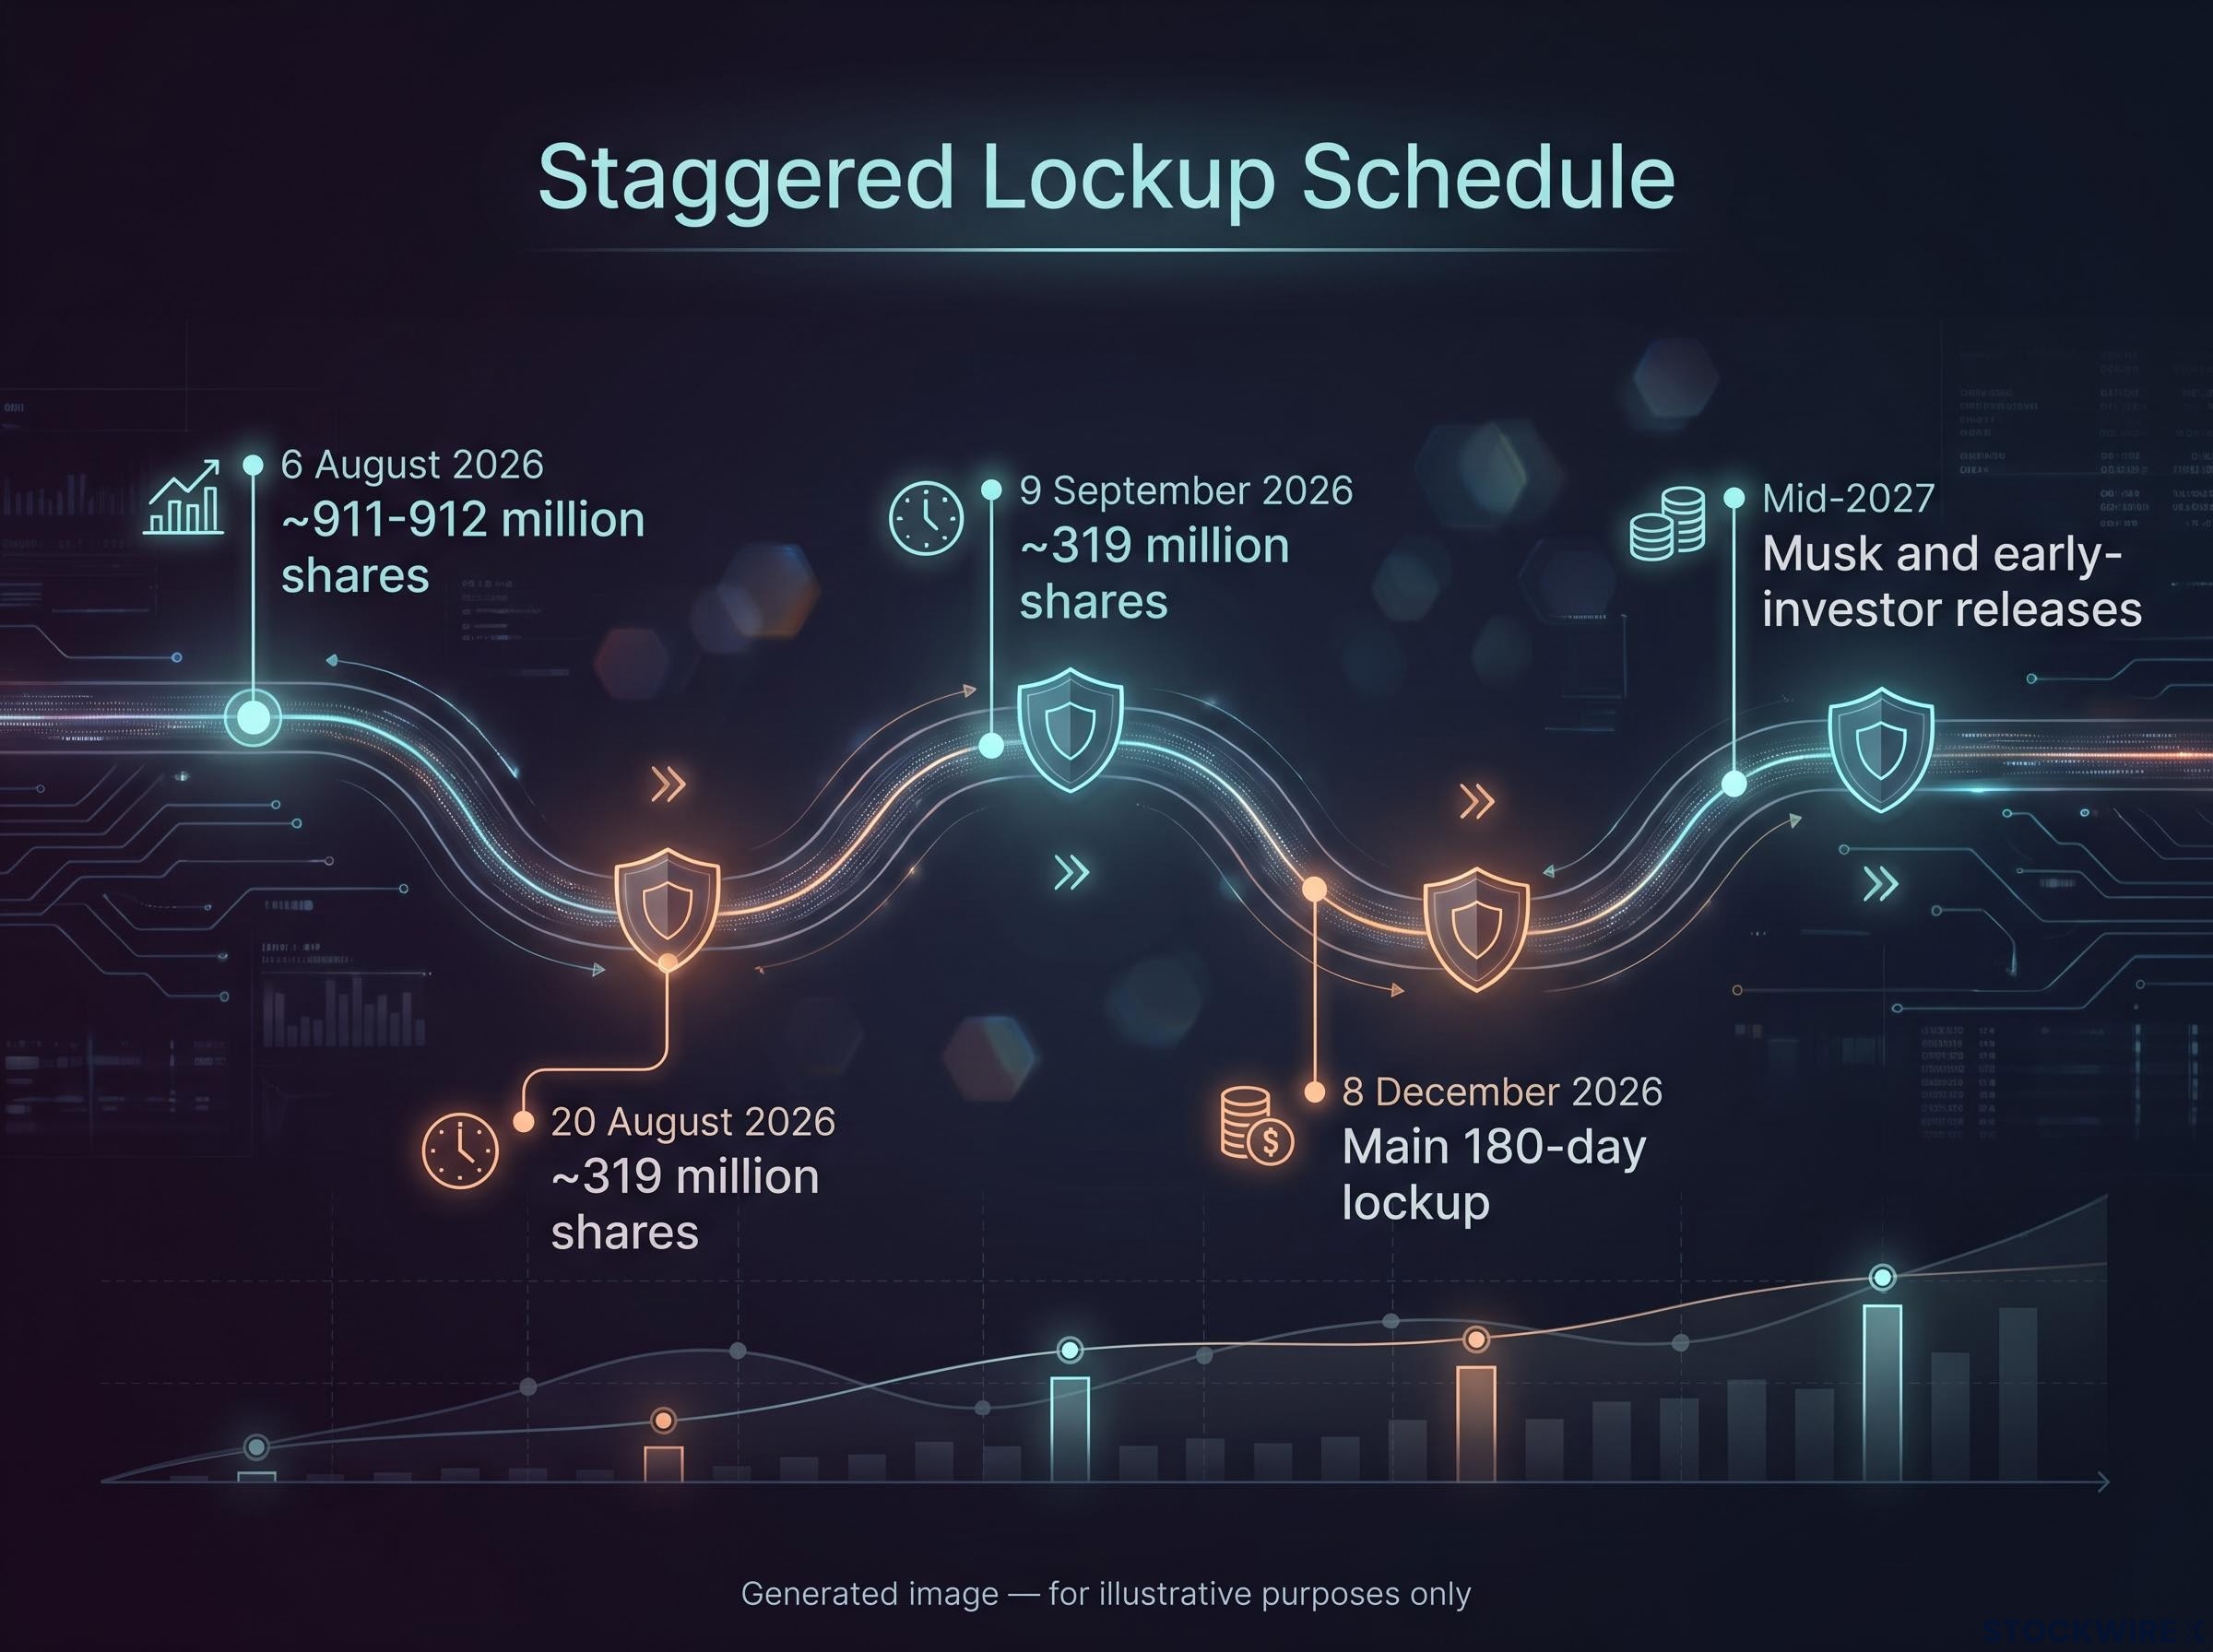
| 6 August 2026 | ~911-912 million | Float doubled (~639M to ~1.55B) | First tranche; squeeze catalyst |
| 20 August 2026 | ~319 million | Further float expansion | Imminent; tiered put activity building |
| 9 September 2026 | ~319 million | Additional supply tranche | Third staggered release |
| 8 December 2026 | Main 180-day lockup | Largest remaining unlock | Main lockup completion |
| Mid-2027 | Musk and early-investor releases | Extended schedule | Final tranche; longest restriction period |
Two structural conditions make a crowded lockup trade fragile:
- The date is well-telegraphed, meaning every market participant can pre-position before it arrives, compressing the information advantage to near zero.
- Consensus positioning over-discounts the worst case, which means any outcome better than the feared floor raises the probability of a reversal rather than a continuation.
The staggered schedule is not a technical footnote. It means every unlock from here through 8 December is a fresh event risk that carries its own potential for the market to misprice consensus. Each date on the calendar is a distinct analytical problem, not a diminishing echo of the first.
Reading the $8.5 million put structure as a probability map, not a panic signal
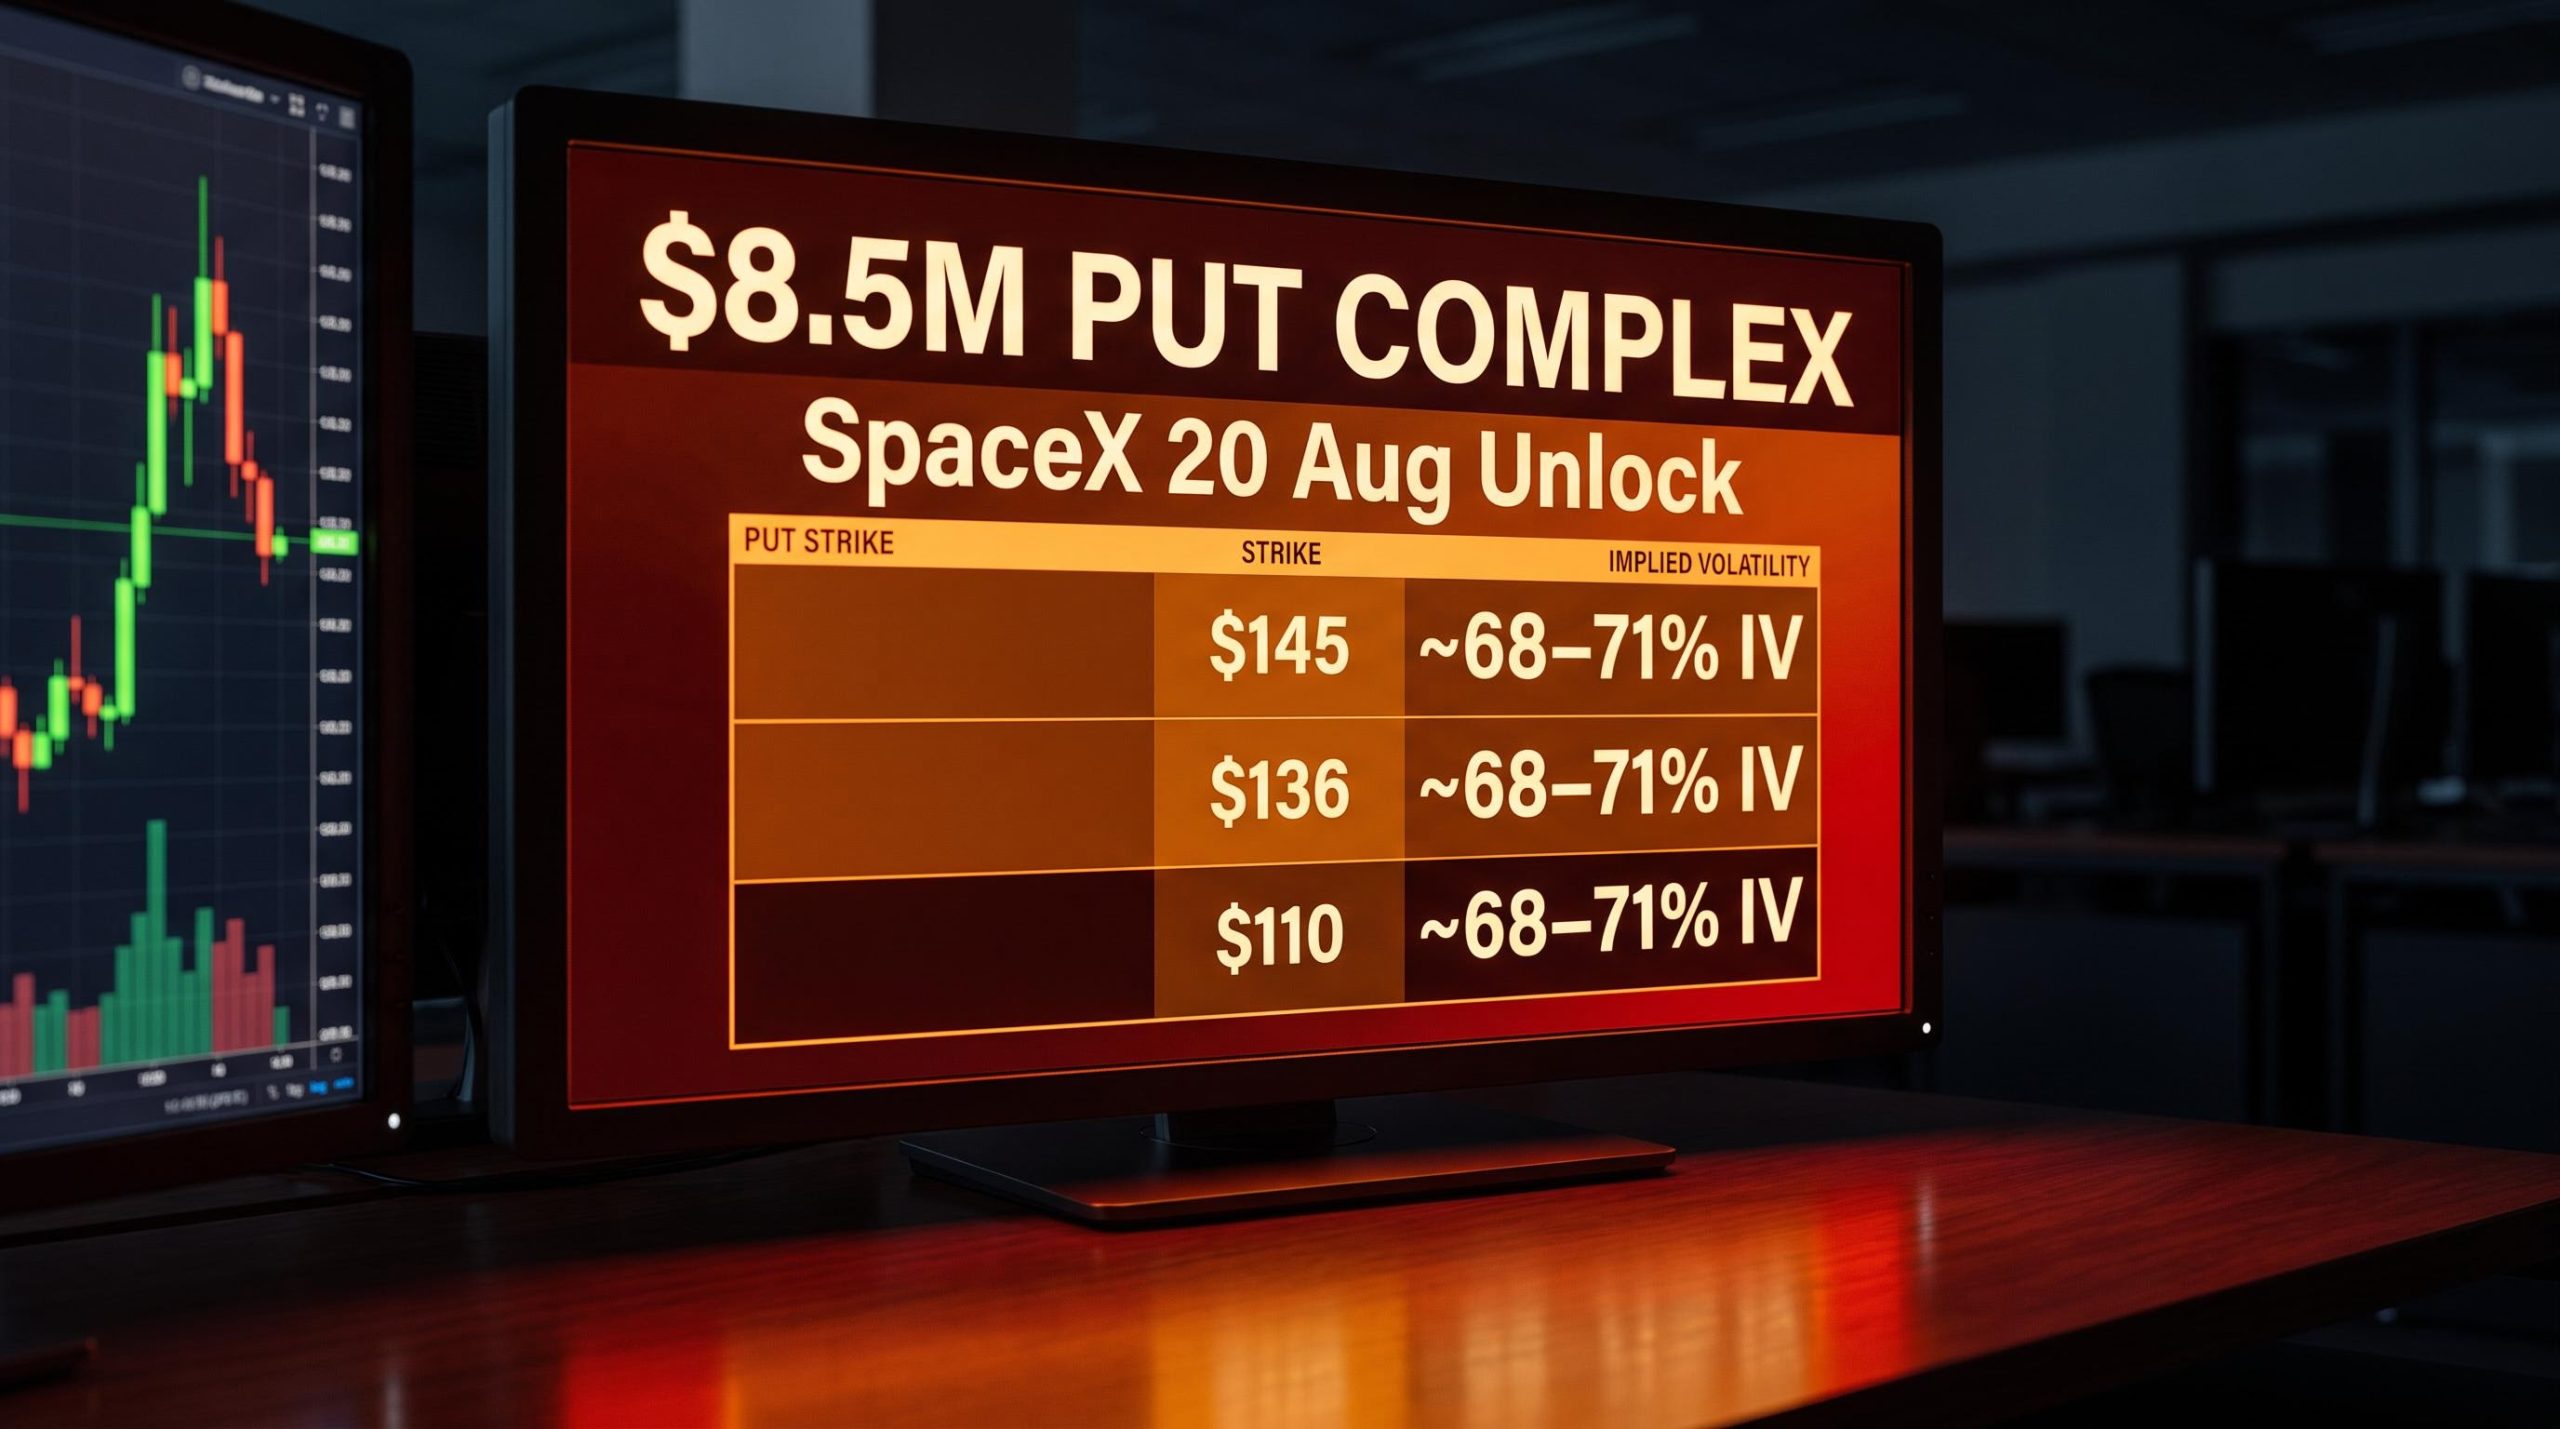
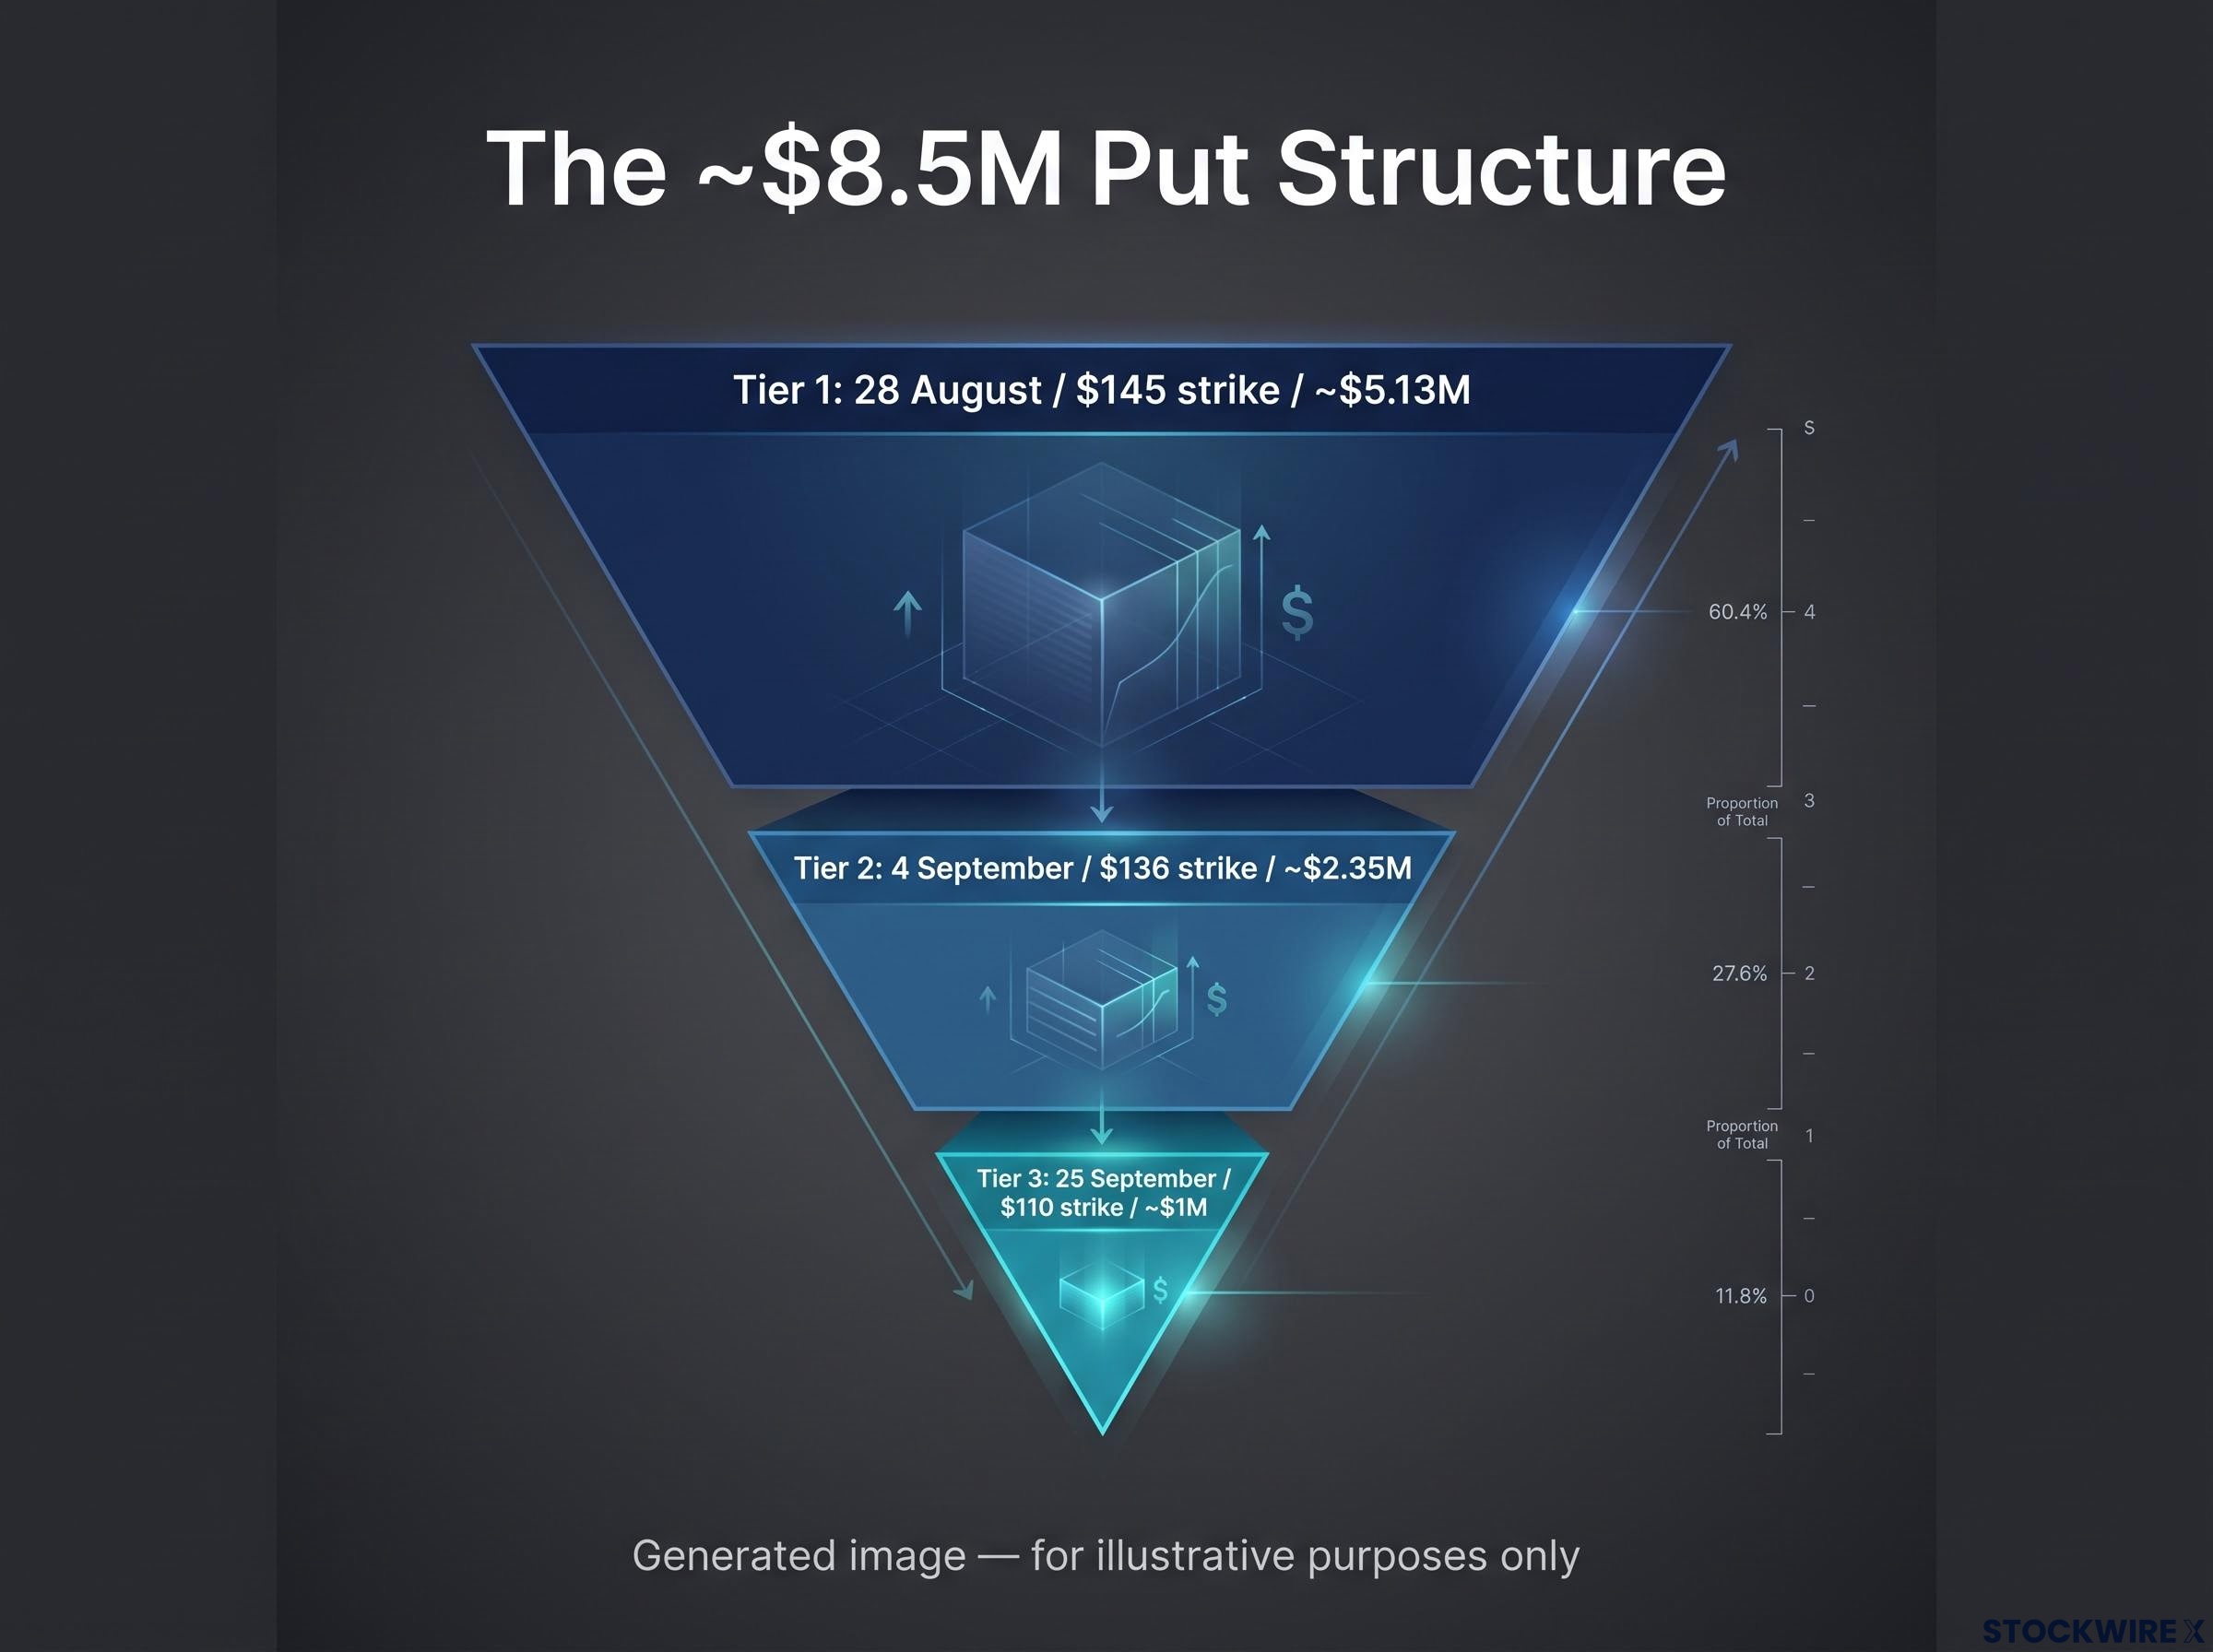
Following the squeeze, bearish put buyers did not disappear. They returned with a more carefully staged thesis. In the session preceding this report, put premium totalling roughly $8.5 million was placed across three tiers, each reflecting a different downside scenario.
| Tier | Expiration | Strike | Premium | Implied Volatility |
|---|---|---|---|---|
| Tier 1 (Near-the-money) | 28 August | $145 (~1% OTM) | ~$5.13M | ~68% at entry; ~71% at reporting |
| Tier 2 (Mid-strike) | 4 September | $136 (~7% OTM) | ~$2.35M | ~67% at entry; ~70% at reporting |
| Tier 3 (Deep OTM) | 25 September | $110 (~25% OTM) | ~$1M | ~71% at entry; ~69% at reporting |
| Total | ~$8.5M |
Tier 1 carries the highest conviction: the dominant position in the complex, accounting for $5.13 million of the $8.5 million total, was placed with just 10 days remaining to expiration at a strike approximately 1% out of the money. This is not a hedged portfolio protection trade spread evenly across scenarios. It is a near-term directional bet anchored to the 20 August unlock, with the deeper tiers functioning as staged extensions if that primary thesis plays out.
Tier 2 embodies the scenario where an initial dip extends into a moderate trend move lower as the market digests additional supply from the 20 August and 9 September tranches. The positioning was fresh: the 4 September $136 put had virtually no open interest before the session, climbing from around 11 contracts to more than 3,000 in a single day, a pattern consistent with new capital entering a directional view rather than an adjustment to prior positions.
The 4 September $136 put saw open interest jump from roughly 11 contracts to above 3,000 in a single session, a signature of new money establishing a fresh directional trade rather than rolling an existing one.
Tier 3 functions as a tail-risk expression anchored near the $110 prior support level, where the payoff is large if successive unlocks trigger the cumulative supply pressure the first one avoided.
At least one large structure on the other side expressed upside conviction, confirming that overall large-ticket flow was mixed rather than uniformly bearish. The concentration of premium in Tier 1 tells you where the highest conviction sits; the staging across three tiers tells you how carefully these traders are distributing exposure across scenarios.
Implied volatility as the market’s real-time fear gauge around unlock events
Implied volatility is the premium the options market charges to underwrite uncertainty in a given name over a specific period. It is distinct from historical volatility, which measures how much a stock has actually moved in the past. Implied volatility captures how much the market expects it to move going forward.
Implied volatility is extracted by reverse-engineering live option prices rather than derived from historical data, which is why the 67-71% readings across SpaceX’s put tiers represent the market’s real-time collective expectation about future price movement magnitude, not a backward-looking average.
Across SpaceX’s three put tiers, implied volatility clustered in the 67-71% range at entry and at time of reporting. That range tells you something specific when you calibrate it:
For mature large-cap stocks, implied volatility typically runs between 20-35%. SpaceX’s put structures were priced at 67-71%, roughly double the upper end of that range.
Three things to watch when reading implied volatility around a known catalyst date:
- Rising implied volatility between the time a position is placed and the time you observe it signals that the market became more fearful, not less, in the intervening period. For Tiers 1 and 2, implied volatility rose from entry to reporting, confirming that institutional anxiety around the 20 August unlock was building, not receding.
- The absolute level relative to typical ranges gives you a calibration for how unusual the pricing is. The 67-71% range is event-driven pricing, not a normal operating environment.
- Convergence across strike distances signals event-driven uncertainty rather than position-specific pricing. When puts at 1%, 7%, and 25% out of the money all carry similar implied volatility, the market is pricing a single source of risk (the unlock calendar) across the entire options chain.
A reader tracking this in real time would see rising implied volatility on the near-dated puts as confirmation that professional positioning around the 20 August tranche was intensifying, not fading.
Why each successive unlock is a fresh analytical problem, not a repeat of the last
Serial unlock events do not repeat mechanically. Each tranche is shaped by how the prior one resolved, and after a surprise squeeze, traders tend to hedge more carefully and stage exposure across scenarios rather than simply re-running the original short thesis.
Three unlock dates remain on the 2026 calendar, each carrying distinct analytical context:
- 20 August: Approximately 319 million shares. Imminent. The tiered put structure described above is concentrated around this date, with the highest-conviction premium expiring within 10 days.
- 9 September: Approximately 319 million shares. The mid-tier puts at the $136 strike expire the week before this date, meaning Tier 2 is calibrated to capture weakness flowing from the August tranche into the September one.
- 8 December: The main 180-day lockup completion. This is the largest remaining event risk on the calendar, and its resolution will be shaped by everything that happens at the prior two tranches.
When this report was compiled, SpaceX shares were changing hands near $143, having pulled back substantially from their post-IPO peak but clawing back ground from the lows around $100. The stock’s journey since listing, a rally of roughly 42% from IPO price to peak followed by a sharp reversal and partial recovery, means each successive unlock finds the market at a different starting point and a different level of conviction among holders.
What the post-squeeze put structure says about updated priors
The tiered, multi-expiration architecture of the $8.5 million put complex is itself evidence of more careful thinking compared to the blunt pre-6 August short positioning. Staging exposure across three tiers rather than concentrating it in a single strike reflects an acknowledgment that the outcome distribution is genuinely uncertain. Professionals are paying for optionality across scenarios rather than betting on a single resolution.
A reader approaching the 20 August unlock expecting “it squeezed last time, so it will squeeze again” is making the same category error as the shorts who piled in before 6 August: applying a consensus script to an event that is structurally different from the one that produced the consensus.
What this case study changes about how you should read lockup events
SpaceX’s first unlock cycle is an unusually clear illustration of dynamics that recur across every major IPO lockup. The specific names, dates, and premium figures will change; the underlying mechanics do not. Five principles carry forward:
- Lockups are probabilistic catalysts, not deterministic supply events. Large unlocks raise the potential for selling, but insider behaviour, market sentiment, and pre-positioning can invert the expected reaction. SpaceX’s first unlock more than doubled the float, yet shares rose.
- Crowded trades around well-known dates are structurally fragile. When every participant is positioned for the same outcome, any result better than consensus worst-case raises the probability of a reversal. The squeeze becomes the news.
- Options flow encodes a probability distribution, not a single directional bet. Tiered put structures across strikes and maturities reveal where institutional traders think a stock is most likely to go around the next catalyst, where it might go if pressure persists, and where the tail risk sits.
- Implied volatility is a measurable anxiety signal. Elevated and rising implied volatility concentrated around known event dates tells you the market is demanding higher compensation to underwrite risk at those specific inflection points.
- Serial unlocks are fresh analytical problems, not echoes of prior ones. Each tranche is shaped by how the previous one resolved. Updated priors produce updated positioning, which produces different dynamics.
The $8.5 million put complex is evidence that even after being caught on the wrong side of the 6 August squeeze, professional traders are returning to the downside thesis with more structured, staged positioning rather than abandoning it. The 8 December main lockup remains the largest event risk on the calendar, and it will be shaped by everything that happens at 20 August and 9 September first. SpaceX’s staggered calendar through year-end offers multiple opportunities to apply this framework in real time.
For investors wanting to apply the lockup framework across future IPO positions, our comprehensive walkthrough of US IPO trading strategy covers the optimal momentum window, exit timing relative to lockup expiration, and the historical return distribution that explains why 64% of IPOs underperform the S&P 500 within twelve months.
This article is for informational purposes only and should not be considered financial advice. Investors should conduct their own research and consult with financial professionals before making investment decisions. Past performance does not guarantee future results. These statements are speculative and subject to change based on market developments and company performance.
—