
The 30-year Treasury yield closed at 5.33% on 18 August 2026, its highest level since 2007, and the signal it sends is not about a single bad day in bonds. It is about a structural repricing of what investors demand to lend to the US government for three decades.
This is not an isolated American story, either. Long-dated government borrowing costs across the G10 have been climbing in tandem, with yields in several major developed economies touching levels not seen for years. When every major developed economy’s long-dated debt reprices at the same time, the explanation is bigger than any one country’s fiscal debate.
Here is what that shift means for how you think about Treasuries from here: whether they still function as a safe haven, what the income case looks like at yields not seen in nearly two decades, and which risks are now live for your mortgage rate, your equity portfolio, and the broader economy.
The structural forces driving the 30-year Treasury yield
Three pressures have converged to push the 30-year yield above 5.3%, and none of them is temporary:
- Rising term premium: The extra compensation investors demand for holding long-dated bonds rather than rolling shorter-term positions has climbed materially, reflecting genuine uncertainty about the US fiscal trajectory over decades, not just the next rate decision
- Persistent fiscal deficit concerns: The sheer scale of projected US borrowing has made investors more cautious about locking money away for 30 years without a meaningful yield cushion
- Price-sensitive auction demand: Buyers are showing up, but only at higher yields, meaning the market is discovering a new, elevated clearing price for long-term government debt
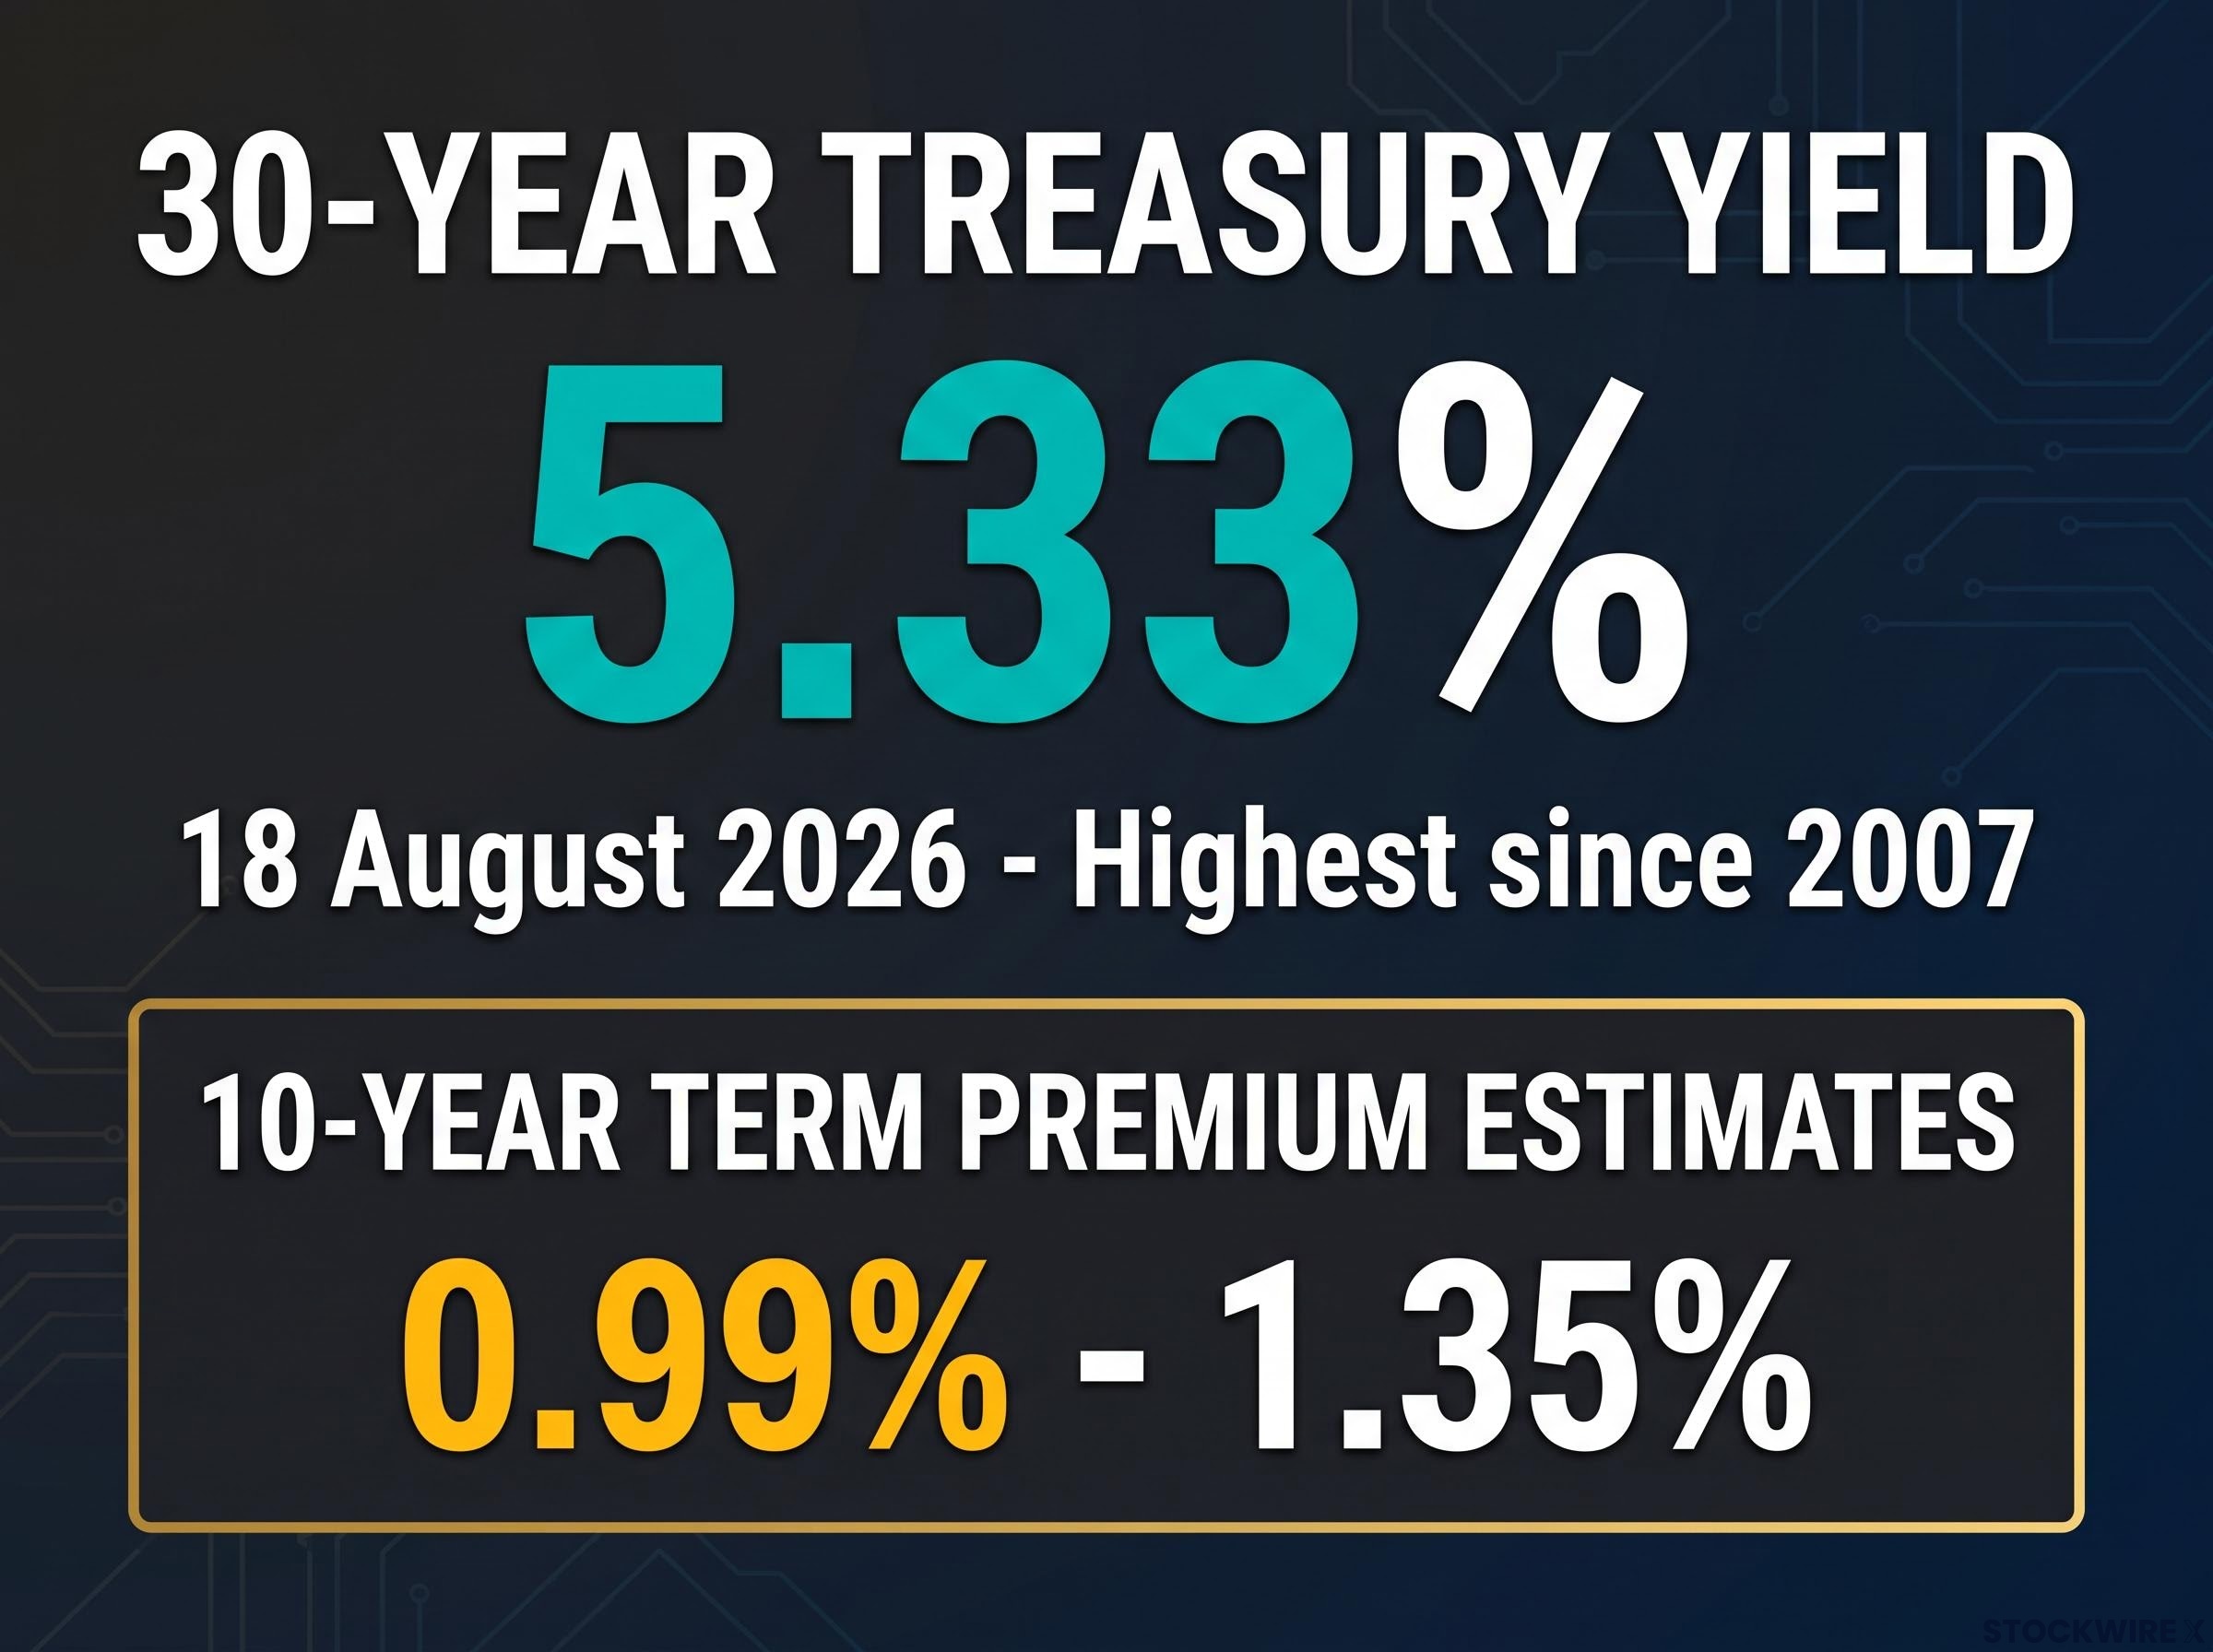
Term premium estimates for the 10-year point reached 0.99%-1.35% as of mid-August 2026, up from earlier 2025-2026 lows, according to San Francisco Fed and Bloomberg strategist estimates.
That range tells you something specific: investors are not simply adjusting for where the Fed funds rate might sit next quarter. They are demanding a structural premium for uncertainty about where US fiscal policy leads over the next 10, 20, and 30 years. That is a more durable form of yield pressure than anything the Fed can resolve with a single rate decision.
The historical case for yield normalisation is grounded in pre-QE data: US 30-year yields near 5% were entirely consistent with the early-to-mid 2000s, and the decade of suppressed rates following the financial crisis created an artificially low baseline that distorted what investors came to treat as normal.
Why this is not a Fed story
Long-end yield moves have outpaced what near-term Fed rate-hike expectations alone would justify. The 30-year auction on 13 August 2026 cleared at 5.216%, the highest borrowing cost for that maturity in roughly a quarter century (since approximately 2001). The 10-year auction cleared at 4.683%, its highest since 2007.
The disconnect between short-end and long-end pricing confirms a structural rather than cyclical repricing. The Fed controls the front end of the yield curve. The market is telling you it now controls the back end.
When big ASX news breaks, our subscribers know first
How the auctions actually went, and what the numbers reveal
A “tail” in Treasury auction language means the auction clears at a yield slightly above where the market was trading beforehand, a sign that the government had to pay up to attract enough buyers. Both the 10-year and 30-year auctions in mid-August showed modest tails. That is price sensitivity, not absence.
| Maturity | Auction Date | Yield Cleared | Bid-to-Cover | Dealer Takedown |
|---|---|---|---|---|
| 10-Year | 12 August 2026 | 4.683% | Modest (near average) | Comparable to recent |
| 30-Year | 13 August 2026 | 5.216% | 2.39 | 11.5% |
A bid-to-cover of 2.39 with an 11.5% primary dealer takedown (the share absorbed by Wall Street dealers who are obligated to bid) tells you institutional demand is real but conditional on price. Primary dealers taking a relatively small share means other buyers, including foreign central banks and asset managers, were doing most of the purchasing.
That distinction matters. Yields at these levels are clearing markets, not flashing a crisis. The difference between a structural demand collapse and a repricing to new equilibrium is the difference between panic and adjustment. Right now, the data points to adjustment.
This is not just a US story: G10 sovereign bonds under simultaneous pressure
The US yield move looks different when you zoom out. Sovereign debt yields across several major developed economies have been hitting their highest levels in years at the same time as the American 30-year benchmark. This is not capital fleeing the US for safer alternatives; the alternatives are repricing too.
- G10 sovereign yields at multi-year peaks across several major economies, not just the US
- The repricing reflects a global reassessment of how much compensation lenders require from governments, regardless of country
- US Treasuries retain unmatched depth and liquidity, keeping them as the primary core sovereign asset even as absolute yields climb
Rabobank Head of FX Strategy Jane Foley, as reported by FXStreet, noted that sustained pressure on global bond markets could further test the traditional safe-haven classification of US government debt.
A simultaneous multi-country repricing tells you this is a structural shift in how the world prices government borrowing, not a sentiment-driven flight from US assets specifically. That has different implications for where yields settle. There is no obvious flight-to-quality alternative when every major sovereign market is adjusting at once, which means the relative value case for Treasuries remains intact even as the absolute yield demanded has risen.
Distinguishing global versus domestic yield signals matters precisely because the same absolute yield level carries different portfolio implications depending on whether it reflects a worldwide repricing of sovereign credit or a country-specific fiscal credibility event; the UK-Germany spread, not the raw gilt yield, is the honest diagnostic for country-specific risk.
What 5.3% Treasuries do to mortgages, corporate debt, and equity valuations
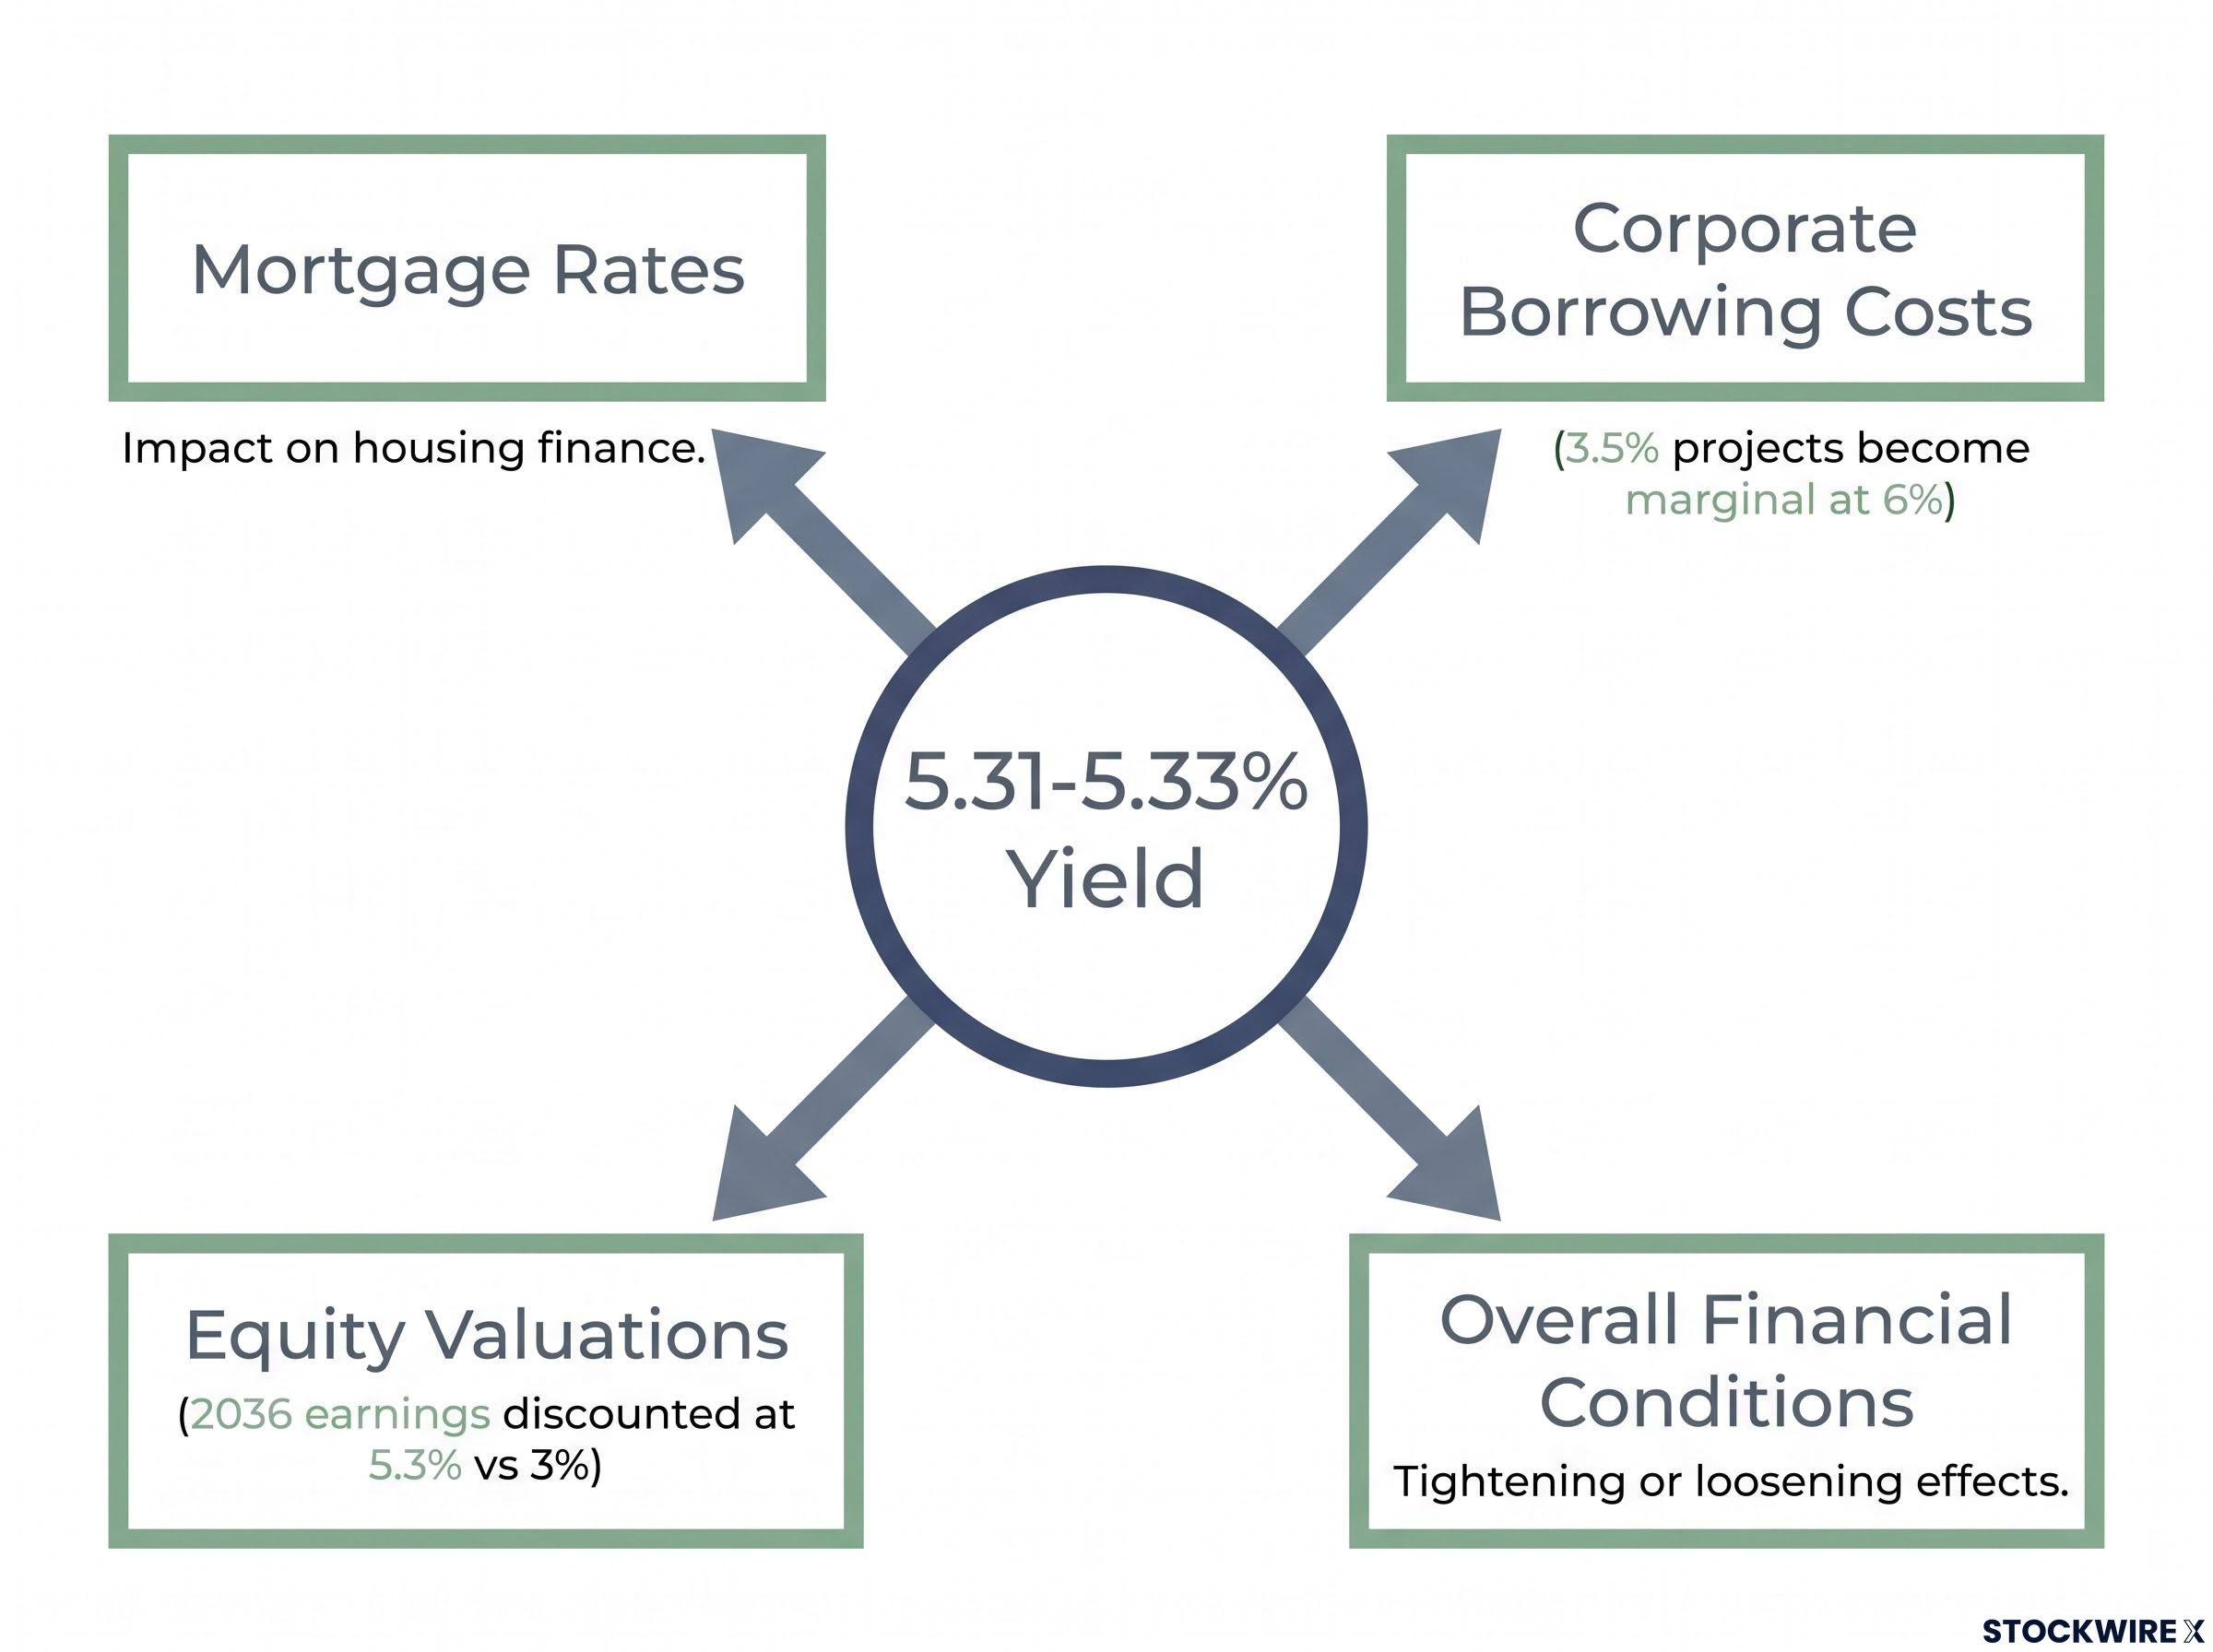
The 30-year Treasury yield is not an abstract bond market number. It is the base rate from which borrowing costs across the economy are built. At 5.31-5.33%, the pressure transmits through four channels simultaneously:
- Mortgage rates: Lenders apply a spread above Treasury yields to set mortgage pricing. Higher Treasuries mean higher mortgage rates, which reduces what buyers can afford and slows housing market activity directly.
- Corporate borrowing costs: Companies issuing long-term debt pay a premium above Treasury yields. Capital-intensive projects that made sense at 3.5% borrowing costs become marginal or unattractive at 6% or above.
- Equity valuations: Higher discount rates compress the present value of future cash flows, which pressures stock prices broadly.
- Overall financial conditions: The combination of tighter mortgage credit, more expensive corporate debt, and lower equity valuations acts as a brake on economic growth, even without a single additional Fed rate increase.
The mechanical link between Treasury yields and mortgage rates means that the 30-year fixed rate is set by the bond market, not the Federal Reserve; lenders price mortgages as a spread above Treasury benchmarks, so the current yield environment translates directly into the monthly payment a homebuyer faces before any Fed decision is made.
Why growth stocks feel the squeeze most
Long-duration equities, growth companies whose earnings are weighted heavily toward years or decades in the future, are disproportionately affected by discount rate rises. A dollar of earnings expected in 2036 is worth meaningfully less today when discounted at 5.3% instead of 3%. Value stocks with near-term cash flows absorb the same rate pressure with less damage to their present valuation.
For a reader with a mortgage, a stock portfolio, or a view on business investment, the current yield level means tighter conditions on all three fronts simultaneously. That is materially different from a rate environment where only one channel is under pressure.
Safe haven, income vehicle, or duration risk? What long Treasuries are now
The 5.3% yield on the 30-year Treasury forces a renegotiation of what this asset actually does in a portfolio. Four implications stand out:
- Duration risk has increased: At current yield levels, a further rise of 50 basis points would produce substantial mark-to-market losses in long-duration positions. Active duration management is now required, not optional.
- The income case is the strongest in nearly two decades: Over 5% nominal yield on very long-dated Treasuries is a far more attractive starting point than anything available during the 2009-2022 low-rate era. Liability-matching investors, such as pension funds and insurers, can now lock in meaningful long-term income at yields not seen for roughly 20 years.
- Diversification assumptions need updating: The traditional negative stock-bond correlation that underpinned the 60/40 portfolio cannot be assumed to hold when fiscal stress or inflation dominates. Bonds and equities can fall together in this environment.
- Global safe-haven choices are narrower: With G10 yields rising in parallel, the universe of viable alternatives to Treasuries has not expanded. International capital is likely to stay anchored in US government debt, even while demanding higher compensation.
Over 5% nominal yield on very long-dated Treasuries represents the strongest income starting point in roughly two decades, a meaningful shift for any investor reconsidering the role of government bonds in their portfolio.
The reader who came in thinking Treasuries are simply safe should now understand they are a meaningful asset choice rather than a default, with real income potential and real duration risk that requires active management.
This article is for informational purposes only and should not be considered financial advice. Investors should conduct their own research and consult with financial professionals before making investment decisions.
What changes from here, and what investors should be watching
This is not a one-day story with a tidy resolution. The structural forces behind the yield move, fiscal deficits, term premium expansion, global sovereign repricing, are ongoing. Whether 5.3% becomes a temporary peak or a floor for a new yield range depends on variables you can track in real time:
The US fiscal deficit trajectory is not a forward-looking abstraction: federal net interest payments reached $659 billion in FY 2024, consuming roughly 13% of the federal budget, and the CBO projects they will surpass defence spending as a share of GDP by 2034, which is the structural borrowing pressure directly behind the term premium expansion visible in current long-end yields.
- Term premium trajectory: If term premium estimates continue expanding beyond the current 0.99-1.35% range, it signals that structural long-end pressure has further to run
- Auction demand metrics: Watch bid-to-cover ratios and dealer takedown percentages in upcoming Treasury supply events; deterioration would indicate genuine demand weakness rather than repricing
- Fiscal deficit trajectory: Any legislative developments that alter projected borrowing paths will directly affect how much compensation investors demand at the long end
- Global sovereign yield direction: If other G10 yields continue rising, the relative attraction of Treasuries as a safe haven does not improve even if US absolute yields stabilise
Past performance does not guarantee future results. Financial projections are subject to market conditions and various risk factors.
A reader who monitors these variables over the coming weeks will be better positioned to judge whether the current yield level is a ceiling or a starting point, and that is the most actionable question this story leaves you with.